IMO 2020 What Every Shipper Needs To Know - March 2019 - JOC.com
←
→
Page content transcription
If your browser does not render page correctly, please read the page content below
Credit: Alfa Laval
                                                              March 2019

                                  Sponsored by

                     IMO 2020
                     What Every Shipper Needs To Know

                                   Produced by

                                                        and
WHITEPAPER, March 2019
                                                                          IMO 2020: What Every Shipper Needs To Know

     Table of Contents
        Key Takeaways.  .  .  .  .  .  .  .  .  .  .  .  .  .  .  .  .  .  .  .  .  .  .  .  .  .  .  .  .  .  .  .  . 1
        Introduction.  .  .  .  .  .  .  .  .  .  .  .  .  .  .  .  .  .  .  .  .  .  .  .  .  .  .  .  .  .  .  .  .  .  1
        History: IMO Efforts to Reduce Pollution.  .  .  .  .  .  .  .  .  .  .  .  .  .  .  .  .  2
        Methods for IMO 2020 Compliance .  .  .  .  .  .  .  .  .  .  .  .  .  .  .  .  .  .  .  .  6
        Marine Fuel Markets .  .  .  .  .  .  .  .  .  .  .  .  .  .  .  .  .  .  .  .  .  .  .  .  .  .  .  .  .  6
        Implementation Factors for Carrier and Shipper Consideration .  .  8
        Fuel Surcharge 101: What Goes Into the Calculator.  .  .  .  .  .  .  .  .  .12
        Trade Factors for Consideration .  .  .  .  .  .  .  .  .  .  .  .  .  .  .  .  .  .  .  .  . 12
        Fuel Price Factors for Consideration.  .  .  .  .  .  .  .  .  .  .  .  .  .  .  .  .  .  . 13
        A Model for Fuel Surcharges in 2020 .  .  .  .  .  .  .  .  .  .  .  .  .  .  .  .  .  .  . 13
        The Path Forward .  .  .  .  .  .  .  .  .  .  .  .  .  .  .  .  .  .  .  .  .  .  .  .  .  .  .  .  .  . 21
        Conclusion.  .  .  .  .  .  .  .  .  .  .  .  .  .  .  .  .  .  .  .  .  .  .  .  .  .  .  .  .  .  .  .  .  .  .22
        About IHS Markit .  .  .  .  .  .  .  .  .  .  .  .  .  .  .  .  .  .  .  .  .  .  .  .  .  .  .  .  .  .  .23
        About The JOC.  .  .  .  .  .  .  .  .  .  .  .  .  .  .  .  .  .  .  .  .  .  .  .  .  .  .  .  .  .  .  . 23
        About Gemini Shippers Group.  .  .  .  .  .  .  .  .  .  .  .  .  .  .  .  .  .  .  .  .  .  .23
        About Seabury Maritime .  .  .  .  .  .  .  .  .  .  .  .  .  .  .  .  .  .  .  .  .  .  .  .  .  . 23

     Table of Figures
        Fig. 1: Sulfur Emission Reduction After IMO 2020 Implementation.  2
        Fig. 2: Map of 2019 Emission Control Areas .  .  .  .  .  .  .  .  .  .  .  .  .  .  .  3
        Fig. 3: Map of China’s Domestic Emission Control Areas.  .  .  .  .  .  .  . 4
        Fig. 4: Sulfur Percentage Reduction in ECAs vs. Global, 2000-2020.  5
        Fig. 5: Forward Price Change Projections for Different Fuel Grades.  .  . 7
        Fig. 6: Projected Marine Fuel Oil Market Share .  .  .  .  .  .  .  .  .  .  .  .  .  8
        Fig. 7: Assumed Data (8,500 TEU) for Surcharge Model.  .  .  .  .  .  .  .14
        Fig. 8: Assumed Data (4,500/13,100 TEU) for Model Comparison.  .  . 14
        Fig. 9: Fuel Surcharge Model Findings .  .  .  .  .  .  .  .  .  .  .  .  .  .  .  .  .  . 15
        Fig. 10: Fuel Surcharge Model Comparison by TEU .  .  .  .  .  .  .  .  .  .15
        Fig. 11: Slow Steaming Impact on Fuel Price .  .  .  .  .  .  .  .  .  .  .  .  .  .16
        Fig. 12: Comparison of Scrubber Option Cost by Ship Size.  .  .  .  .  .16
        Fig. 13 Fuel Surcharge Comparison, Scrubber Use vs. MGO .  .  .  .  .17
        Fig 14: Contracting Base + Bunker Sample .  .  .  .  .  .  .  .  .  .  .  .  .  .  .19

II                                                                                                           www.ihsmarkit.com | www.joc.com
                                                                                                                                          ©2019 IHSMarkit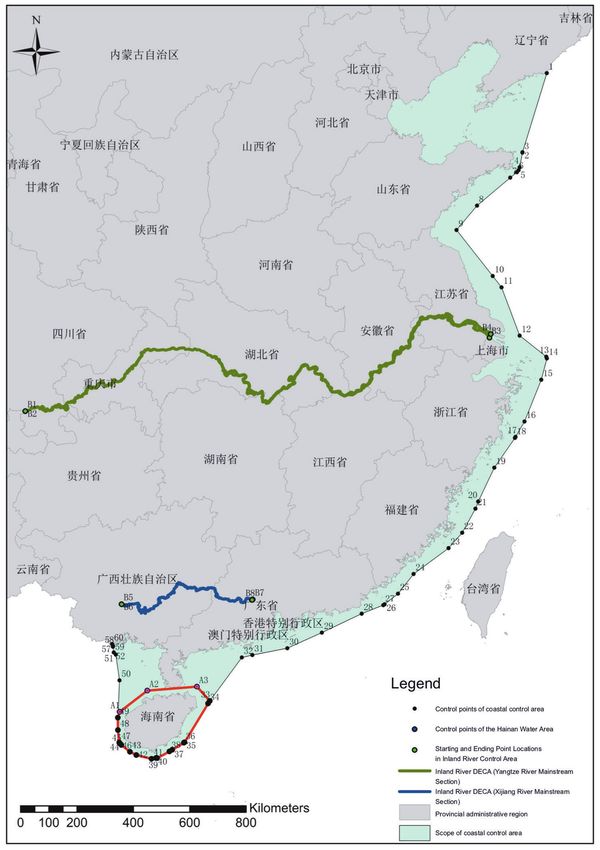
WHITEPAPER, March 2019
  IMO 2020: What every shipper needs to know

Key Takeaways
   • Jan. 1 will mark the full implementation of IMO 2020 regulations reducing sulfur
     oxide emission from 3.5 percent m/m to 0.5 percent m/m.
   • Carriers have several ways to comply with these new rules. Each method brings its
     own advantages, disadvantages, and cost implications.
   • New emission standards will lead to significant improvements in pollution
     derived from ships’ emissions.
   • Compliance will lead to an increase in operational costs, which carriers will
     attempt to pass on to shippers through new bunker formulas.
   • 2019-2020 trans-Pacific contract negotiations will occur amid the uncertainty of
     this pending cost increase.
                                                                                                   To navigate IMO 2020,
   • Shippers should accept and endorse that the benefits of environmental                         carriers and shippers
     improvements come with some increases in costs for low sulfur fuel, while                     will need open dialgue.
     engaging in a thorough dialogue and review of fuel surcharge trade factors with               This report provides
     their carrier partners.                                                                       insight and a general
   • Fuel costs already represent more than 50 percent of total operating expenses,                overview of the issues
     and IMO 2020 poses an increase too significant for carriers to absorb and stay                in order to support
     operational.                                                                                  better understanding
                                                                                                   and negotiations.

Introduction
With less than 10 months before the International Maritime Organization (IMO) regulation on
sulfur oxide emission goes into effect, carriers and shippers alike are facing an uncomfortable
uncertainty over its potential effects on costs and freight rates as they enter the 2019-2020
trans-Pacific contracting period. The 2020 deadline to reduce sulfur oxide emissions to
0.5 percent m/m is one of the most significant regulations impacting liner shipping in recent
memory. Lacking an industry standard for fuel-surcharges computation or a clear picture of
the underlying costs for low-sulfur fuel, participants can only roughly estimate its economic
impact. Several factors affecting a carrier’s calculation of the fuel surcharges add complexity,
making transparency ever so paramount to building trust on both sides. The intention of
this whitepaper, produced by Seabury Maritime in cooperation with Gemini Shippers Group,
is to promote open dialogue between carriers and shippers by providing insight and a
general understanding around metrics used behind bunker calculations.

The IMO is the United Nations agency responsible for implementing global maritime
regulations after they are ratified by a number of member states. On Oct. 27, 2016, its Marine
Environmental Protection Committee (MEPC) agreed to implement a global 0.5 percent m/m
sulfur oxide emissions limit, effective Jan. 1, 2020. The current global limit is 3.5 percent
m/m sulfur oxide. Airborne sulfur oxide is a dangerous pollutant, especially near population
centers, and is a leading cause for acid rain. Studies have shown that sulfur oxide is a cause
of respiratory diseases such as asthma.

www.ihsmarkit.com | www.joc.com                                                                                          1
©2019 IHSMarkit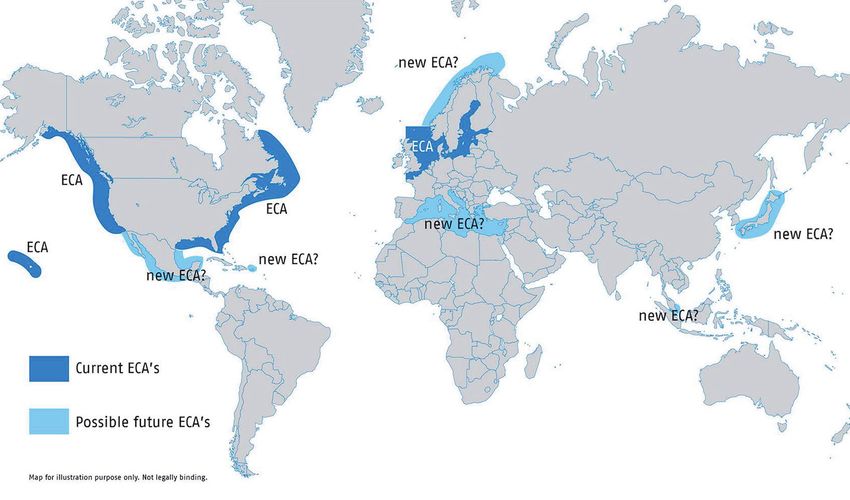
WHITEPAPER, March 2019
                                                                        IMO 2020: What Every Shipper Needs To Know

                           This exhaust limitation can be met in various ways including:

                                • Low-sulfur-compliant fuel oil use.
                                • Low-sulfur alternative fuel use, such as Liquefied Natural Gas (LNG).
                                • Exhaust gas cleaning system, aka “scrubbers,” installation.
                           Each of these solutions has its own advantages, disadvantages, and complexities.

                           History: IMO Efforts to Reduce Pollution
                           In 1997, as part of the IMO’s work to reduce shipping’s harmful impact on the environment, the
                           organization adopted Annex VI to the International Convention for the Prevention of Pollution
                           from Ships (MARPOL Convention). MARPOL Annex VI went into effect in May 2005. The annex
                           set limits on sulfur oxide and nitrogen oxide emissions from ship exhausts, creating a global
                           cap of 4.5 percent m/m on the sulfur content of fuel oil. Annex VI also contained a provision
                           for the establishment of Emission Control Areas (ECAs) with more stringent controls on sulfur
   The 2020 deadline to    emissions near coastal areas.
     reduce sulfur oxide
           emissions to    Broadly, Annex VI and subsequent revisions adopted in 2008, seek to control airborne emissions
 0.5 percent m/m is one    from ships including sulphur oxides (SOx), nitrogen oxides (NOx), ozone depleting substances
 of the most significant   (ODS), and volatile organic compounds (VOC). Release of these substances has been linked
  regulations impacting    to local and global air pollution, human health issues, and environmental problems. In 2012
liner shipping in recent   the limit was reduced from 4.5 percent m/m to the current 3.5 percent m/m, a 22.2 percent
               memory.     reduction.

                           IMO’s Marine Environment Protection Committee (MEPC 70), confirmed the pending changes in
                           October 2016.

                           Under the new rules, ships operating outside of ECAs will be required to limit sulfur emission to
                           0.50 percent m/m from Jan. 1, 2020. This new limit is an 85.7 percent reduction from the current
                           3.5 percent m/m limit.
                            Fig. 1: Sulfur Emission Reduction After IMO 2020 Implementation

                           Source: Gemini / Seabury Maritime Analysis

2                                                                                         www.ihsmarkit.com | www.joc.com
                                                                                                                 ©2019 IHSMarkit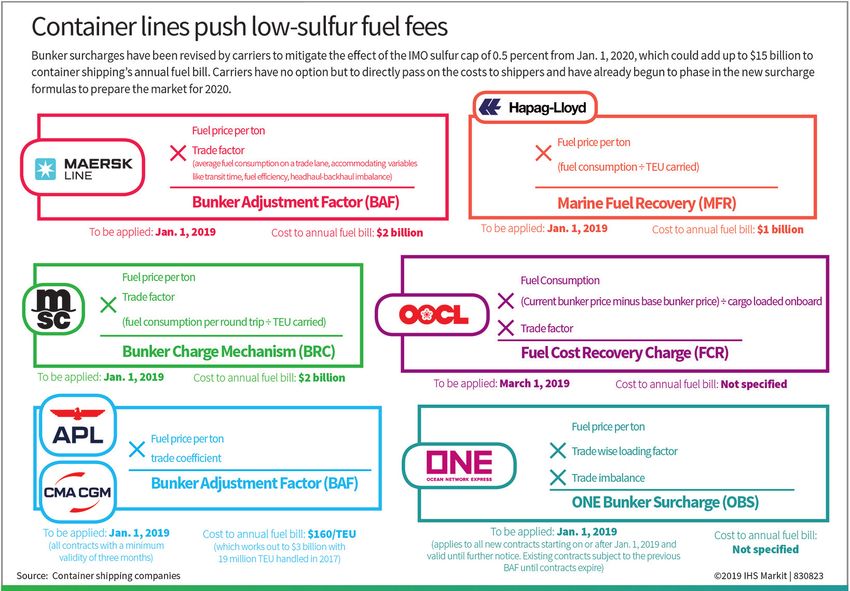
WHITEPAPER, March 2019
   IMO 2020: What Every Shipper Needs To Know

                                                                                                         Sulfur content
                                                                                                 standards are already
Credit: Krispen Atkinson                                                                             more strict within
Sulfur content standards are already more strict within certain Emission Control Areas. As of          certain Emission
Jan. 1, 2015, the limit for sulfur emissions within an ECA was 0.1 percent m/m. The current            Control Areas —
ECAs are in North America and Northern Europe, as shown in the map below. Some other               0.1 percent m/m has
countries have been implementing their own limits in their territorial waters, or within port       been the regulation
limits. As a result, some trade routes will be effected after 2020 more than others, depending        within ECAs since
on the share of time spent within ECAs during a voyage.                                                       Jan. 2015.

The ECAs established under Annex VI covering the coastal waters of the United States
and Europe will continue at the 2015 standard of 0.1 percent m/m content.
 Fig. 2: Map of 2019 Emission Control Areas (Current & Proposed)

Source: DNV GL

www.ihsmarkit.com | www.joc.com                                                                                        3
©2019 IHSMarkit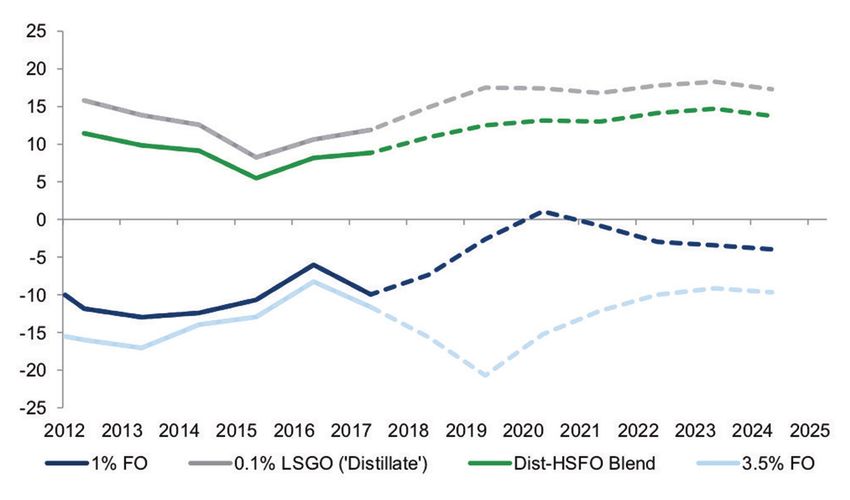
WHITEPAPER, March 2019
                                                                                         IMO 2020: What Every Shipper Needs To Know

                             Fig. 3: Map of China’s Domestic Emission Control Areas

Authorities will validate
    carriers’ use of low-
     sulfur fuel through
       audits of bunker
  delivery notes, vessel
   documentation, and
   bunkering sampling
  where infractions are
             suspected..

                            Source: Ministry of Transport of the People’s Republic of China

4                                                                                                       www.ihsmarkit.com | www.joc.com
                                                                                                                               ©2019 IHSMarkit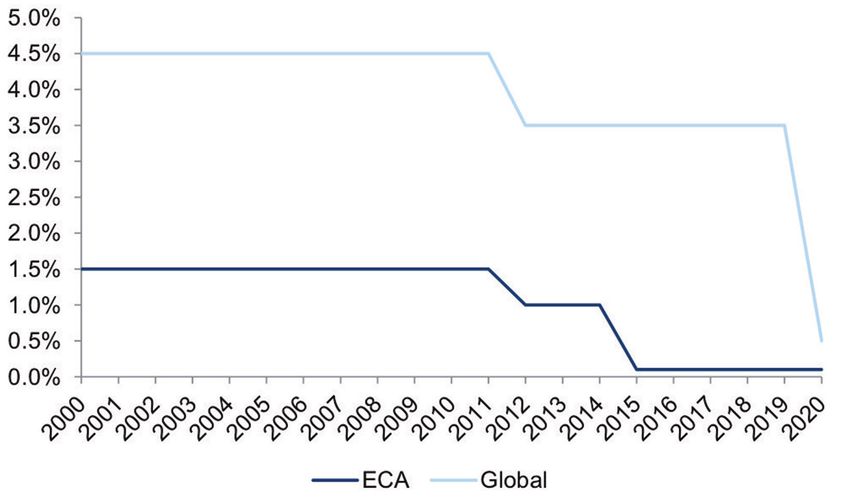
WHITEPAPER, March 2019
   IMO 2020: What Every Shipper Needs To Know

In support of current efforts to curb pollution, China adopted its own Domestic Emission
Control Areas (DECAs) in 2016 with a phased approach to implementation.

    • From Jan. 1, 2016, ports in the emission control areas can require ships at berth
      to use fuel oils with sulfur content ≤ 0.5 percent m/m.
    • From Jan. 1, 2017, ships berthing at core port areas within the DECAs are required
      to use fuel oils with sulfur content ≤ 0.5 percent m/m, except for the first hour
      after arrival and the last hour prior to departure.
    • From Jan. 1, 2018, ships berthing at any ports within the DECAs are required to
      use fuel oils with sulfur content ≤ 0.5 percent m/m, except for the first hour after
      arrival and the last hour prior to departure.
    • From Jan. 1, 2019, ships entering the DECAs are required to use fuel oil with sulfur
      content ≤ 0.5 percent m/m at all times.

The progression of change in sulfur limits since 2005 has led to a dramatic reduction in sulfur
emissions and the related effect on pollution.                                                    Carriers have three
                                                                                                  choices for meeting
 Fig. 4: Sulfur Percentage Reduction in ECAs vs. Global, 2000-2020
                                                                                                  IMO 2020 compliance.

Source: Goldman Sachs

Despite some calls for the IMO to delay implementation, nearly all industry participants
have accepted that these rules will go into effect on Jan. 1, 2020. Carriers are well down
the path of planning for implementation of the new rules. Monitoring and enforcement of
penalties for non-compliance is carried out by flag and port states. As part of monitoring
and enforcement, flag states issue vessels an International Air Pollution Prevention (IAPP)
certificate. The IAPP obligates carriers to uses fuel oil with a sulfur content that does not
exceed the applicable MARPOL limits, documented by a bunker delivery note. Authorities

www.ihsmarkit.com | www.joc.com                                                                                          5
©2019 IHSMarkit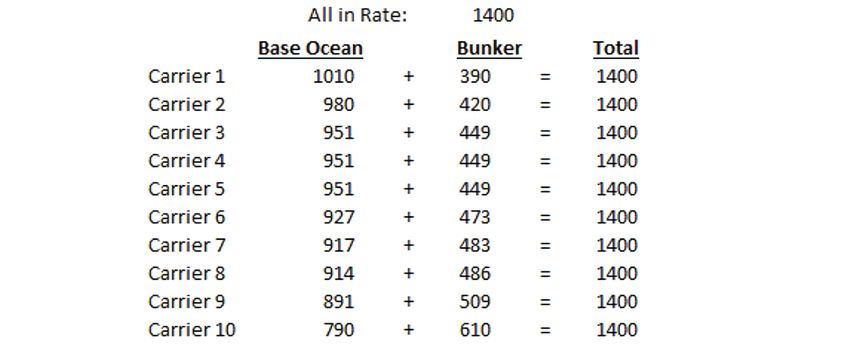
WHITEPAPER, March 2019
                                                                  IMO 2020: What Every Shipper Needs To Know

                           will validate carriers’ use of low-sulfur fuel through audits of bunker delivery notes, vessel
                           documentation, and bunker sampling where infractions are suspected. Carriers found to
                           have violated the rules risk significant fines, which in the United States can be up to $25,000
                           per day. Many question the standardization of enforcement across different flag and port
                           states and suspect that levels of enforcement reliability will vary in different parts of the
                           world.

                           Methods for IMO 2020 Compliance
                           Carriers have three choices for meeting IMO 2020 compliance:

    The maritime fuel
market is going to see a
 major disruption in its
way of doing business.
                            Low Sulfur Fuel               Exhaust gas cleaning systems                 Liquid Natural Gas
                                                                  (Scrubbers)

                           Each carrier will deploy a strategy that best meets their needs, and many carriers will use a
                           combination of all three solutions both in the long and short term. Each solution brings certain
                           features and trade-offs for the carrier to consider. Several diverse factors — including fuel
                           availability, fleet age and makeup, charter versus ownership, capital cost, shipyard capacity,
                           and implementation time — must be considered. For shippers, an understanding of the carriers’
                           planned strategy will provide further insight into how these costs will manifest in fuel surcharges.

                           Marine Fuel Markets
                           The total annual global marine fuel demand is in excess of 400 million tons, with projected
                           2020 demand exceeding 500 million tons. The larger containerships (4,000 TEU and greater)
                           account for approximately 20 percent of all marine fuel demand. Fuel costs typically
                           represent more than 50 percent of the total running costs for a ship and are increasingly
                           becoming the focus for improvements in order to gain a market advantage.

                           Stemming from the new sulfur regulations, the maritime fuel market is going to see a
                           major disruption in its way of doing business. Up to now, marine fuel “bunkers” have been
                           dominated by residual/heavy fuel oil (HFO), and to some extent distillate marine gas oil
                           (MGO). HFO is the residue of the distillation process of crude oil, and it is the fuel grade most
                           frequently used in shipping.

6                                                                                       www.ihsmarkit.com | www.joc.com
                                                                                                                   ©2019 IHSMarkit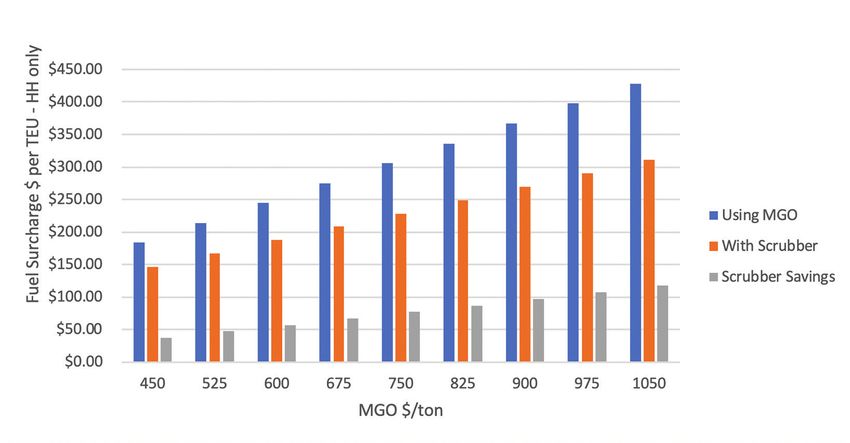
WHITEPAPER, March 2019
   IMO 2020: What Every Shipper Needs To Know

MGO is one of the highest marine fuel grades. It is more expensive because it is a lighter
fraction and better quality than diesel fuel and is typically 0.1 percent sulfur content. HFO is
the lowest cost fuel, while MGO typically has a 40-50 percent premium.

As of Feb. 8, 2019, global Top 20 port price averages are $420 versus $647 per ton for HFO
versus MGO respectively. Forward price curves and general market consensus are projecting
a price differential upwards of $180 per ton based on recent crude oil prices and projections.

After the implementation of the sulfur regulations, the only vessels that will be permitted to
continue burning HFO will be those fitted with exhaust scrubbers. All other ships will need to
shift to MGO or other compliant fuels.

Oil majors and refiners are already moving towards creating new low-sulfur fuel blends
(ULSFO) to meet the 0.5 percent sulfur limit. These will be cheaper than MGO and physical
properties closer to those of HFO. Most of these new low-sulfur fuel blends so far are
experiencing compatibility and stability issues, as any blending of fuels can create problems
                                                                                                   Consumption of ULSFO
including potential engine failure at sea. These ULFSO fuels will typically be a blending of
                                                                                                   will slowly replace
MGO and HFO, and will likely be priced accordingly between the two options.
                                                                                                   MGO, and as more
Initially, lack of scrubber installations will translate to most ships shifting to MGO use.        ships have scrubbers
Approximately 2,000 ships are expected to be scrubber fitted by 2020 that will continue            installed, demand for
to use HFO. Increasingly, consumption of ULSFO is expected to replace MGO. As more ships           HFO will rise.
have scrubbers installed, the demand for HFO will again increase.
 Fig. 5: Forward Price Change Projections for Different Fuel Grades

Source: Goldman Sachs

www.ihsmarkit.com | www.joc.com                                                                                        7
©2019 IHSMarkit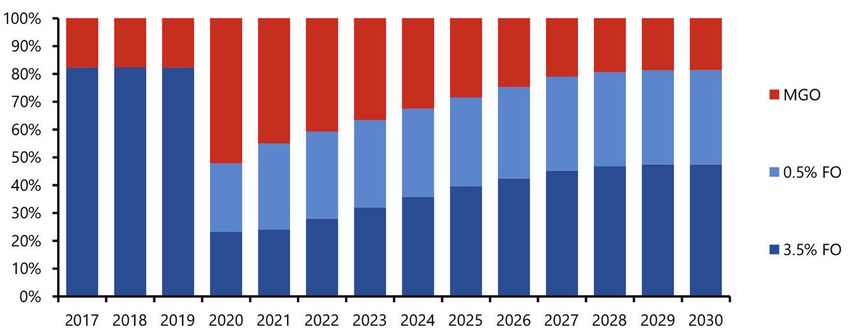
WHITEPAPER, March 2019
                                                                      IMO 2020: What Every Shipper Needs To Know

                              Fig. 6: Projected Marine Fuel Oil Market Share

                             Source: Argus Media

                             Additionally, alternative fuels are also increasingly being adopted, with Liquified Natural
    New fuel blends and      Gas (LNG) being the alternative fuel of choice for various newbuildings since 2014. LNG is
    alternative fuels will   significantly lower cost than MGO and even HFO. However, the fueling infrastructure is not
     inject diversity and    yet widely developed beyond just a handful of key bunkering ports. Additionally, the cost
     open up the simple      of LNG-dual-fuel-capable ships is significantly higher than installing a scrubber and regular
     two-option marine       diesel engines, due to the higher cost of machinery as well as the higher costs and size of
            fuels market.    LNG fuel storage tanks.

                             The sudden shift and drop in demand for HFO post 2020 is expected to drive its price down
                             significantly. Additionally, there is still uncertainty as to whether refiners will be able to
                             position sufficient MGO in the key bunkering ports in time for 2020, which would expectedly
                             drive those prices up.

                             This upcoming major shakeup to the marine fuels market will open new opportunities for
                             investments in scrubbers, new eco ships, and other fuel efficiency technologies, as well as in
                             alternative fuels and related infrastructure, starting with LNG and, over time, shifting to other
                             candidates such as ammonia, hybrid electric and battery, hydrogen, methane, and other
                             biofuels. This is expected to create complexity in the marine fuels market, moving away from
                             a simple market of just two main fuels.

                             Implementation Factors for Carrier and Shipper
                             Consideration
                             Due to the still-uncertain price differential between HFO and MGO or ULSFO, as well as other
                             technical or regulatory considerations, carriers and ship owners have widely displayed
                             caution about big investments in scrubbers or other alternative fuels. This “wait and see”
                             approach is further exacerbated by the potential of non-availability of compliant low-sulfur
                             fuels in smaller ports on the switchover date, as well as some ports and states banning the
                             water discharge from some scrubbers. The question of how a carrier will compute and pass
                             the added fuel costs to their customers is still a big uncertainty. This is a major reason for the

8                                                                                       www.ihsmarkit.com | www.joc.com
                                                                                                                   ©2019 IHSMarkit
WHITEPAPER, March 2019
IMO 2020: What Every Shipper Needs To Know
big discrepancies in the Bunker Adjustment Factors (BAF) that we see in the announcements
carriers are making.
Of the three main compliance methods, the alternative fuels option is likely to have the
smallest uptake in the first few years post implementation, and we will therefore not focus on
this option in this paper. However, some carriers, such as CMA CGM and Hapag Lloyd, are on
the path to LNG and other alternative fuel use on some ships.
Switching to MGO
Of the compliance options, switching to MGO is the most straight-forward solution,
requiring the least upfront capital investment, and the least technical changes. Ships are
already used to using this fuel within ECAs, with crews able to accommodate this switch fairly Scrubbers are air
easily. pollution control
However, MGO is also the highest cost option, by a high margin. It also increases the lube oil devices installed on
costs. MGO has a higher caloric content than HFO, thus consuming about 5 percent less by ships that remove most
weight compared to HFO, slightly lowering the price gap. sulfur and particulate
matter from the
Consumers should expect that at least for the first period post 2020, most of their containers exhaust and allow
will be on ships using MGO. lower-cost HFO use,
removing more harmful
ULSFO is a cheaper option to MGO, however due to the lower availability, and fuel stability
issues risking total engine failure, we do not expect that this fuel will be used too broadly at pollutants at sea than
first. This may eventually replace more of the MGO, which should help lower the BAF that can be removed at the
shippers are asked to pay. refinery stage.
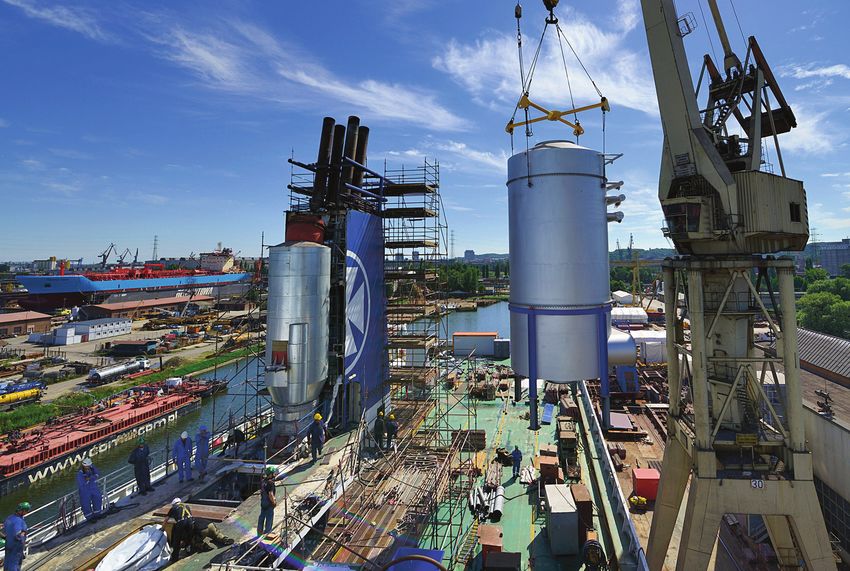
Switching to Scrubbers
Scrubbers are air pollution control devices that remove most sulfur and particulate matter
from the exhaust. Scrubbers have been used widely on land at power plants and are
therefore not considered a new technology. However, the harsh marine environment does
pose some difficulties when designing the systems for use on ships. Scrubbers allow a ship to
continue burning lower-cost HFO, removing the harmful substances on the ship as opposed
to at the refinery stage.
Although this may seem worse for the environment, scrubbed HFO is actually cleaner than
ULSFO or MGO because of the lower particulate matter content, removed by the scrubbers.
In addition, although it would seem intuitively better to remove the sulfur at the refinery
level in terms of total emissions and energy use, the extra shipping of crude oil to refineries
capable of hydrocracking the fuel, and then back to the supply locations around the world,
counterbalances most or all of the CO2 emitted from the extra energy consumed in building,
installing, and using a scrubber on a ship. Using a scrubber results in an increased fuel
consumption of about 1.5 percent-2 percent. Simply put, there is no free ride to reducing
emissions, since reducing sulfur increases the CO2 emitted, both for scrubbers and for MGO.
The 2020 regulation is solely an air pollution control regulation and is not related to climate
change.
There are various types of scrubbers, with the main used on ships being “wet scrubbers.” In a
www.ihsmarkit.com | www.joc.com 9
©2019 IHSMarkitWHITEPAPER, March 2019
IMO 2020: What Every Shipper Needs To Know
wet scrubber, water is sprayed on the exhaust gasses in order to neutralize the sulfur oxides
and remove most of the particulate matters. The method of treatment of the water then sub-
categorizes scrubbers into three main groups:
• Open Loop
• Hybrid
• Closed Loop
These designations refer to how the used wash water is treated.
Currently, the most widely used is Open Loop, which releases the diluted water back into the
sea, and is the lowest cost to install and operate. The water is treated to remove heavy metals
and other particulate matter, and then is released into the sea. This method is only safe in
high alkaline waters, which includes any open sea. There is a big debate lately about the
safety of the water released back into the sea. Properly designed open-loop scrubber systems
have been shown not to release harmful substances back into the sea. However, as more
scrubber manufacturers enter the market, some systems are being shown to be less effective
at removing the chemicals and heavy metals from the water, potentially not meeting the
The 2020 regulation is required standards. The IMO is likely to consider closer requirements on approvals of scrubber
solely for air polution manufacturers, as it has done on other technology regulations. Some ports and countries are
and is not related to unilaterally banning the discharge of scrubber wash water in their port or territorial waters,
climate change. such as Singapore and Fujairah, with Chinese ports expected to follow suit. Such bans are
expected to be implemented by more ports in the near future, while more discussions are held
at the IMO level and with independent scientific reports. Such bans will have limited impact on
the financials of an open loop scrubber on a containership.
For waterways like rivers and lakes with lower alkalinity, a Closed Loop is preferable. This
method uses fresh water with special additives in order to treat the exhaust, and then the
used water is treated, and the waste kept on board to dispose of on land. Closed loop
scrubbers are the least utilized and are the most expensive.
As the name implies, a hybrid scrubber can work in an open loop as well as a closed loop
setting, offering maximum flexibility. The current debate about Open Loop scrubbers might
lead to hybrid systems gaining more traction, however, the design of Open Loop systems as
“Hybrid-ready,” able to easily convert to hybrid systems with an extra future investment, is an
opportunity for the two options to converge.
How much does it cost, and how is it installed?
Scrubber costs can vary greatly, depending on manufacturer, type of scrubber, and size of
ship and engine configuration. Presently prices vary between $1.0 million and up to $6.0
million for the largest ships with complex engine setups. Installation costs are also a major
factor when retrofitting ships with scrubbers. For small to mid-size ships, the installation
costs are approximately equal to, or even higher than, the cost of the scrubber itself,
bringing total costs to around $2 million-$8 million per ship. As shipyards and engineering
companies become more experiences in installing scrubbers, the costs and time to retrofit
are coming down.
10 www.ihsmarkit.com | www.joc.com
©2019 IHSMarkitWHITEPAPER, March 2019
IMO 2020: What Every Shipper Needs To Know
Most scrubbers are several stories tall and take up a significant part of the engine room.
Their installation is a major shipyard engineering task. If it’s during a regularly scheduled
maintenance drydock and the planning is properly managed in advance, then time loss is
minimal. In a time crunch, and if the ship-owner decides to retrofit the scrubber outside
of the planned maintenance cycle, the ship would be out of service for at least 3-4 weeks,
including the time in repositioning the ship to the shipyard and back to the regular trade-
route.
Due to the recent rush in scrubber orders, many manufacturers are out of available delivery
slots prior to 2020. Consumers should therefore expect that most ships, even in cases where
scrubbers are planned to be installed, will be consuming MGO or ULSFO at the start of 2020.
Similarly, shipyard capacity is expected to pose an issue in global installation capacity.
Around 2,000 scrubbers are expected to be installed on the global fleet of around 90,000
ships prior to 2020. Typically, any containership under 15 years old is a candidate for a
scrubber. The younger the ship, the more attractive the financial return.
Retrofitting a scrubber
How much will a scrubber ship save in fuel costs? outside of planned
maintenance could
With all time and costs included, including potentially hiring a substitute ship in the route, place a ship out of
the fuel consumed during repositioning and testing, all engineering work, etc., based on the
service for 3-4 weeks.
current HFO and MGO price projections, the payback time for an Open Loop scrubber is less
than 2-3 years, and around 3-3.5 years for a hybrid scrubber.
This payback time also accounts for the added operating costs for the scrubber (upwards of
$80,000 per annum for an 8,500-TEU ship), and the extra 1.5 percent-2 percent of fuel consumed
when operating the scrubber.
All-in estimated cost for an 8,500-TEU ship would conservatively be around $5 million. For an
8,500-TEU ship, assuming a 5-year amortization on a hybrid scrubber, approximately 95 tons daily
fuel consumption at 17-18 knots, 12 tons of fuel per day while in port, around 275 days sailing per
year, the savings of a scrubber compared to using MGO are at least $4.2 million per year.
These savings are higher for larger ships due to economies of scale, and change depending on the
price differential. The breakeven for a scrubber would be less than $45 per ton, easily justifying the
decision to install one purely from an economics perspective.
It is important to note that a large percentage of ships operated by the main carriers are chartered
long-term from shipowners, rather than owned outright by the carriers. In that case, the full
savings will not be actualized by the carriers themselves and will have to be shared with the ship
owners making the investment. Typical figures are around 25 percent-50 percent of the total
savings being kept by the carriers. This adds further complexity to BAF formula calculations.
Given the many unknowns, including various ship sizes and types, chartered percentage of the
fleet, and more, the path forward post-2020 is not straightforward. These factors also explain the
uncertainty around carriers’ drafting of bunker adjustment factors. This paper aims to clarify the
metrics behind these calculations to help shippers and consumers better understand what to
expect from each carrier’s 2020 strategy and fleet mix.
www.ihsmarkit.com | www.joc.com 11
©2019 IHSMarkitWHITEPAPER, March 2019
IMO 2020: What Every Shipper Needs To Know
Fuel Surcharge 101: What Goes Into the Calculator
For shippers and carriers, a clear understanding of the methodology for the creation of a fuel
surcharge is paramount. While each carrier, and each loop they operate, will have its own
unique characteristics shaping its aggregated fuel spend, fuel surcharge computation — both
before and after Jan. 1, 2020 — follows the basic formula of:
Prior to the June 2017 cessation of TSA fuel formula publication, the methodology used to
determine surcharge components was clearly explained. With the disbandment of the TSA
and the introduction of IMO 2020, carriers now have to create their own methodologies
for their specific trade factors. Lack of clarity around these details have created a genuine
To avoid calls for a shipper distrust of the appropriateness of carrier fuel surcharges. To avoid calls for a return
return to all-in pricing, to the days of all-in pricing, carriers need to clearly define the factors that comprise their
carriers need to clearly specific trade factor. A clear understanding on the assumption for some of the key variables
define the factors that noted below is imperative to understanding the potential effects fuel price changes will have
comprise their specific on overall cost.
trade factor.
Trade Factors for Consideration
• Voyage Length: Time to complete a round-trip voyage.
• Ship size: Average ship operating on the trade or loop.
• Sea Days: Number of total days of voyage spent at sea.
• Port Days: Number of total days of voyage spent in port.
• ECA Days: Number of days operating in Emission Control Area waters.
• Speed: Average speed used to calculate fuel consumption per day. Fuel
consumption increases at a cubed ratio to speed, therefore an increase of even 3-4
knots can double fuel consumption.
• Fuel Consumption: Tons of IFO 380 (per Jan. 1, 2020) 0.5 percent m/m and 0.1
percent m/m low-sulfur fuel used based on average time and ship speed.
• Basic Cost Embedment: In the past, some formulas have had a basis assumption
of a standard cost per ton included in the basis ocean freight whereby bunker
would only be assessed when prices go above the embedded price.
• Asset Utilization: Capacity of ship assumed to be used. Can be based on carrier-
specific or industrial load factors.
• Imbalance factor: What percent of costs are being attributed to the backhaul (in
the trans-Pacific, westbound cargo).
12 www.ihsmarkit.com | www.joc.com
©2019 IHSMarkitWHITEPAPER, March 2019
IMO 2020: What Every Shipper Needs To Know
Fuel Price Factors for Consideration
• Bunker Location: Bunker costs vary by port. Carriers will reference the prices of specific
ports to monitor fuel prices.
• Reporting period: Carriers can monitor bunker prices several ways, including taking
simple averages of prices of a week, month, or quarter, or they can use brackets or
triggers that affect changes when a price in a period rises or falls by a specific amount.
• Fuel Surcharge Timing: The timing of a 2020 BAF implementation is also a
factor, and it is not just a random choice by carriers. In order to properly
comply with the emissions requirements on Jan. 1, 2020, a vessel’s fuel tanks will need
to be fully cleaned and flushed of any HFO, so that none of the high-sulfur remnants
are mixed into the MGO. This process needs to start a few months prior to regulation
implementation date. Although the IMO and Port States are likely to show some
leniency in the first few months, carriers are unlikely to risk reputational damage and Jan. 1 compliance
will start the switching process early. will require fuel tanks
be fully cleaned and
A Model for Fuel Surcharges in 2020 flushed of any HFO
Overall assumptions so that no high-sulfur
remnants are mixed
Seabury Maritime, in cooperation with Gemini Shippers Group, has developed a model for into the MGO .
calculating the added fuel costs per container for any global route. The model can be tailored
to take into account all the factors impacting a carrier’s BAF calculations to help demystify the
process for shippers. In some cases it will highlight problematic fuel-factor calculations, but in
others it will educate shippers on the reasons a rate is what it is for a specific carrier or route.
For this paper, the results are tailored for the Asia to US West Coast routes. As this is meant to
show a more generic analysis for an average ship and route, the assumptions used for each
factor are based on generic ships. The assumptions are purposely conservative, given the
many unknowns when attempting to provide an average viewpoint.
Primary assumptions
• 42 days round-trip voyage, of which 32 days are at sea, and 10 in port.
• 15 percent of sailing time within ECA, and 40 percent within ECA within port.
• 90 percent utilization for the head haul.
• 40 percent utilization for the back haul.
• 21 days “off hire” for scrubber installation.
• 12 percent finance cost for scrubber investment.
• 5-year amortization for scrubber.
• 95 percent MGO consumption compared to HFO.
• 1.5 percent extra HFO consumption with scrubber installed.
• Average ship in the trans-Pacific West Coast route is 8,121 TEU as of Q4 2018.
www.ihsmarkit.com | www.joc.com 13
©2019 IHSMarkitWHITEPAPER, March 2019
IMO 2020: What Every Shipper Needs To Know
The base case vessel used is an 8,500-TEU ship. The model will also show how a smaller and
larger vessel, and slower or faster speeds, would impact the BAF calculation.
Fig. 7: Assumed Data (8,500 TEU) For Surcharge Model
8,500 TEU
$20,000 charter rate (for “off hire” calculation)
$5 million scrubber capex
$50,000 extra lube oil used annually if switching to MGO
$90,000 extra annual operating expense for a scrubber
12 tons per day consumed while in port
95 tons per day slow steaming (base case)
160 tons per day when slow steaming at 21-22kn (for comparison)
250 tons per day when full speed at 24kn (for comparison)
Fig. 8: Assumed Data (4,500 TEU & 13,100 TEU) For Model Comparison
4,500 TEU 13,100 TEU
$15,000 charter rate (for “off hire” calculation) $30,000 charter rate (for “off hire” calculation)
$3 million scrubber capex $6 million scrubber capex
$40,000 extra lube oil used annually if switching to MGO $60,000 extra lube oil used annually if switching to MGO
$50,000 extra annual operating expense for a scrubber $110,000 extra annual operating expense for a scrubber
8 tons per day consumed while in port 14 tons per day consumed while in port
55 tons per day slow steaming (base case) 110 tons per day slow steaming (base case)
Each carrier may have 95 tons per day when slow steaming at 21-22kn (for comparison) 190 tons per day when slow steaming at 21-22kn (for comparison)
their own base fuel cost 165 tons per day when full speed at 24kn (for comparison) 270 tons per day when full speed at 24kn (for comparison)
included in their base
rate. The assumptions in this model about fuel consumption and scrubber costs can very
drastically. Ships with the same carrying capacity can have in excess of 20 percent fuel-
consumption differences, especially at the slower speeds for the newer ships designed
specifically for performance at those speeds. The data shown here is meant to represent a
typical ship.
The largest ships regularly operating in the trans-Pacific West Coast trade are 15,300 TEU.
Findings
The results portrayed in this paper are for the expected increase in fuel surcharge for 2020,
and do not aim to examine the BAF as a whole. Insofar, the results shown are for the low
sulfur to HFO fuel differential. This is because each carrier may have their own base fuel cost
included in their base rate.
Below are the tabulated results from this model based on the 8,500-TEU vessel, assuming
100 percent of the factor is passed to the head haul/eastbound only:
14 www.ihsmarkit.com | www.joc.com
©2019 IHSMarkitWHITEPAPER, March 2019
IMO 2020: What Every Shipper Needs To Know
Fig. 9: Fuel Surcharge Model Findings (8,500 TEU, MGO With Slow Steaming, 17-18kn)
HFO-MGO price differential $/ton Annual Fuel Increase Added Cost Per TEU, HH
100 $2,212,419.69 $33.28
150 $3,293,629.53 $49.54
200 $4,374,839.38 $65.80
250 $5,456,049.22 $82.07
300 $6,537,259.06 $98.33
350 $7,618,468.91 $114.59
400 $8,699,678.75 $130.86
500 $10,862,098.44 $163.38
Source: Gemini / Seabury Maritime Analysis
For the expected $200/ton of fuel price differential, the added cost per TEU would be in the
range of $66/TEU for an eastbound container.
Head haul versus back haul ratio
Carriers have been releasing vastly different ratios for head haul to back haul splits, with APL Size of the ship in the
at full head haul, Maersk at 70/30 percent, and Hapag Lloyd at 50/50 percent. This report is route can affect the
assuming 100 percent for the head haul, to highlight the total added fuel cost per container. fuel surcharge, with
This can then be tailored for each carrier’s split as needed. bigger ships offering
significant economies
Additionally, it is important to note that given the 90 percent versus 40 percent utilization of scale.
rate for head haul and back haul respectively, assuming an equal surcharge both ways still
means that the head haul containers end up paying for the majority of the total added cost.
Backhaul shippers in the Pacific trade have historically not paid their share of ship operating
costs.
Some carrier loops do slightly slow down on the back haul westbound, which when
combined with less cargo carried, highlights that the fuel consumption westbound is slightly
less. In that case, an equal surcharge both ways is likely not to be implemented by most
carriers, especially when considering the lower base rates on the back haul.
Ship size impact
For comparison, the figures for the 4,500-TEU and 13,100-TEU ships highlight how the size
of the ship in the route can affect the fuel surcharge, with bigger ships offering significant
economies of scale.
Fig. 10: Fuel Surcharge Model Comparison By TEU
4,500 TEU 13,100 TEU
HFO-MGO price differential $/MT Annual Fuel Increase Added Cost Per TEU, HH Annual Fuel Increase Added Cost Per TEU, HH
100 $1,297,402.19 $36.86 $2,564,401.88 $25.03
150 $1,926,103.28 $54.72 $3,816,602.81 $37.25
200 $2,554,804.38 $72.59 $5,068,803.75 $49.47
250 $3,183,505.47 $90.45 $6,321,004.69 $61.69
300 $3,812,206.56 $108.31 $7,573,205.63 $73.91
350 $4,440,907.66 $126.17 $8,825,406.56 $86.13
400 $5,069,608.75 $144.04 $10,077,607.50 $98.36
500 $6,327,010.94 $179.76 $12,582,009.38 $122.80
Source: Gemini / Seabury Maritime Analysis
www.ihsmarkit.com | www.joc.com 15
©2019 IHSMarkitWHITEPAPER, March 2019
IMO 2020: What Every Shipper Needs To Know
Impact of Changing Speeds
Similarly, for the 8,500-TEU ship, when comparing to the faster speeds, the fuel surcharge can
dramatically increase from the current 17-18kn norm. It would be a similar effect if simply
comparing a less efficient to a more efficient ship at the same speeds. This impact is likely to
incentivize carriers to operate more fuel-efficient vessels, and to likely maintain the current
slower speeds to prevent the surcharges from skyrocketing.
Fig. 11: Slow Steaming Impact on Fuel Price
MGO with slow steaming, 17-18kn MGO with slow steaming, 21-22kn MGO with full speed, 24-25kn
HFO-MGO Added Added Added
price Cost Per Cost Per Cost Per
differential Annual Fuel Annual Fuel Annual Fuel
$/ton Increase TEU, HH Increase TEU, HH Increase TEU, HH
100 $2,212,419.69 $33.28 $3,649,265.00 $54.89 $5,638,743.13 $84.82
150 $3,293,629.53 $49.54 $5,448,897.50 $81.96 $8,433,114.69 $126.85
200 $4,374,839.38 $65.80 $7,248,530.00 $109.03 $11,227,486.25 $168.88
250 $5,456,049.22 $82.07 $9,048,162.50 $136.10 $14,021,857.81 $210.91
300 $6,537,259.06 $98.33 $10,847,795.00 $163.17 $16,816,229.38 $252.94
350 $7,618,468.91 $114.59 $12,647,427.50 $190.24 $19,610,600.94 $294.98
The impact of speed 400 $8,699,678.75 $130.86 $14,447,060.00 $217.31 $22,404,972.50 $337.01
500 $10,862,098.44 $163.38 $18,046,325.00 $271.45 $27,993,715.63 $421.07
on surcharge amount
Source: Gemini / Seabury Maritime Analysis
is likely to incentivize
carriers to operate
What if a scrubber is installed?
more fuel-efficient
vessels. If a carrier owns the vessel and decides to install a scrubber, the savings are quite drastic.
In this case, a linear increase on the fuel surcharge based on the MGO pricing would not
be equitable for the shippers. However, considering that not all ships in a route will have
scrubbers at the same time, and not all ships will be owned by the carriers, we expect the
surcharges to remain based on the MGO price, at least for the short- to mid-term.
For these three ships, a comparison of base annual cost per TEU (assuming a $400 HFO/$600
MGO price and for head haul only) would break down as follows:
Fig. 12: Comparison of scrubber option cost by ship size
Added Annualized Cost per TEU, HH only – Cost per TEU, HH only –
Ship Size Scrubber Cost with Scrubber with MGO
8,500 TEU $1.756 million $26.41 $65.80
4,500 TEU $1.079 million $61.31 $72.59
13,100 TEU $2.118 million $30.66 $49.47
Source: Gemini / Seabury Maritime Analysis
In the future, as entire routes have scrubbers deployed on all ships, we expect that pressure
will be put on carriers to adjust their surcharges downward for those routes. Rather than the
linear increase compared to fuel prices starting from 0 for a 0 fuel price, it would instead be
a fuel surcharge with a base factor at 0 fuel price, for the capitalized cost of the scrubber per
TEU, and then a linear surcharge above that and based on HFO instead of MGO prices. This
means that for very low fuel-price differentials, the surcharge for the MGO and the scrubber
routes would be similar, but as the HFO-MGO differential increases, the increase to the
scrubber route would be at a much slower rate compared to MGO use.
16 www.ihsmarkit.com | www.joc.com
©2019 IHSMarkitWHITEPAPER, March 2019
IMO 2020: What Every Shipper Needs To Know
Below is a sample total fuel surcharge comparison of scrubber versus MGO:
Fig. 13 Fuel Surcharge Comparison, Scrubber Use vs. MGO (8,500 TEU)
As fuel compatibility
issues are slowly
overcome and use of
ultra-low-sulfur fuel
oil (ULSFO) becomes
more prevalent, its fuel
Source: Source: Gemini / Seabury Maritime Analysis surcharge will become
lower than MGO.
Savings from using a
As fuel compatibility issues are slowly overcome and use of ultra-low-sulfur fuel oil (ULSFO) scrubber would then be
becomes more prevalent, its fuel surcharge will become lower than MGO. The smaller fuel price even lower.
differential means savings from using a scrubber would be even lower. Similarly, for a chartered
vessel the scrubber fuel surcharge would be higher than for a vessel owned by the carrier.
From an academic standpoint, we have illustrated the need for complete transparency by the
carriers. As each carrier undertakes this process independently the potential for a significant
spread in surcharges among carriers is possible. Further, many shippers and industry
consultants will pressure test carrier assumptions and, to ensure the acceptance of
surcharges, it is imperative they mirror actual operational costs. Philip Damas, Drewry’s
head of supply chain advisors, noted that the “BAF formulae of the major carriers are
substantially above bunker costs” and “BAF levels of carriers on the same trade lane vary by a
factor of 3.6, which cannot plausibly be explained by different cost levels between carriers.”
Impact to the shipper
With trans-Pacific contracting season quickly approaching, many shippers continue to
press carriers to explain how IMO 2020 bunker costs will be reflected in contract rates and
surcharges. Given the standard May 1 to April 30 cycle of trans-Pacific contracting, shippers
negotiating rates this spring must take the increased fuel costs into account for the period
from Jan. 1, 2020 thru the end of their 2019-2020 contract.
Many shippers and industry consultants have criticized the lack of transparency and
uniformity in carriers’ recent BAF announcements. Industry consultants from Alphaliner
stated in a Loadstar article, “A longstanding criticism from shippers is that the carriers’
methods of calculating BAF remain non-transparent, lack uniformity, and could involve an
www.ihsmarkit.com | www.joc.com 17
©2019 IHSMarkitWHITEPAPER, March 2019
IMO 2020: What Every Shipper Needs To Know
“A longstanding
criticism ... is that the
carriers’ methods of
calculating BAF remain
element of revenue generation, rather than serving only to recoup actual bunker costs and
non-transparent, lack
help carriers cope with unexpected fuel price fluctuations.” For shippers, the need to project
uniformity, and could costs for budgeting purposes across a range of carriers and trade lanes is hampered by a lack
involve an element of of a standard bunker surcharge that considers the new low sulfur requirements.
revenue generation...”
Issues related to lack of standardization
Historically, fuel surcharges in the trans-Pacific were standardized under the Transpacific
Stabilization Agreement. Started in 1989, the TSA published a detailed accounting of its fuel
surcharge, including the methodology for computation and a scale for surcharges based
on ranges of input costs. The TSA went on to adjust surcharges with the introduction of
the first low-sulfur mandate and the introduction of ECAs. TSA leadership has frequently
contributed to IHS Markit’s TPM Conference, and in 2013, they presented a detailed view of
surcharges, including the introduction of the low-sulfur component in 2011 and the inland
component added in 2013. While many shippers contested parts of the methodology,
shippers and carriers alike enjoyed the effects of a standardized output across carriers for a
given underlying commodity price. This standardization allowed shippers to make apples-
to-apples comparisons across a range of carriers throughout the contract year.
In June 2017, the TSA abandoned the publication of a fuel surcharge citing, “rapidly
changing market conditions, sailing characteristics, and cost structures made it impractical
to continue publishing a single TSA recommended guideline formula.” The TSA went on to
disband operations in February 2018, leaving each carrier to determine its own method
to track and publish surcharges.
The lack of standardization of fuel surcharge methodology could lead to fuel surcharges
becoming a competitive factor in liner shipping pricing as opposed to the intended purpose;
a surcharge that reflects the underlying movement of commodity prices. This spring, carriers
18 www.ihsmarkit.com | www.joc.com
©2019 IHSMarkitWHITEPAPER, March 2019
IMO 2020: What Every Shipper Needs To Know
and shippers will begin their annual process of quoting rates for the upcoming contract year.
In most cases, shippers will request an all-in price at time of quotation and then, at the time
of contract filing, have the bunker broken out into a formula of ocean freight plus bunker.
Looking at 10 of the largest carriers operating on the Pacific trade, a rate of $1,400 would be
reflected in contracts as follows, based on their current fuel surcharges for the trans-Pacific
eastbound trade:
Fig 14: Contracting Base + Bunker Sample
Lack of standardization
of methodology
could lead to fuel
surcharges becoming
a competitive factor in
liner shipping pricing.
Source: Gemini / Seabury Maritime Analysis
This basic difference in bunker formulas has the potential to create significant disparity in all-
in pricing over time, depending on the sensitivity and rate of change of fuel surcharges based
on input commodity prices. In the above example, even assuming a constant percentage
increase across all carriers would lead to a 3 percent difference in all in rates based on 20
percent increase in fuel surcharges. In a modeled example using this data, and assuming
carriers have a deviation of sensitivity of 10 percent, we noted that all-in rates could vary by up
to 12 percent across the carriers, assuming a constant fuel-cost price. This potentially leads to
the risk for all parties that a carrier’s rate attractiveness might be determined not on its quoted
price but by the rate of change of its fuel surcharge formula. This lack of clarity is diametrically
opposed to the initial carrier goal of introducing floating fuel surcharges. “We know that
ocean carriers have announced new BAF formulae and tables ahead of the introduction of
the IMO 2020 fuel rule and are telling BCOs that they now are against all-in rates that do not
have floating charges. Carriers are keen to ensure that they are compensated fairly for the
additional costs caused by this regulation, but they have, so far, failed to provide evidence
of the actual vessel fuel consumption on which their BAF formulae are based. Without being
transparent, carriers will find it hard to convince shippers to pay up without asking questions,”
Damas said.
This quest for rate transparency benefits carriers equally with shippers. Carriers have worked
tirelessly for the past decade to convince shippers to share the risks of fluctuating fuel
costs. Without transparency carriers risk backlash from shippers to accept future floating
surcharges. “I don’t believe any shipper takes issue with floating fuel surcharges as long as
www.ihsmarkit.com | www.joc.com 19
©2019 IHSMarkitWHITEPAPER, March 2019
IMO 2020: What Every Shipper Needs To Know
they are transparent and correlate to a measurable change in commodity input prices and the
underlying cost basis of voyage economics,” Gemini Shippers Groups’ Ken O’Brien said. “For
carriers, there is no reason not to fully explain these costs to their customers and to ask them
to share in that underlying uncertainty.”
This lack of standardization also plays a role in confusion on rating of carriers’ bills of lading
noted by Bill Aldridge, president of Allport Cargo Services. “Lack of BAF standardization will
require increased focus and attention by the BCO and their logistics providers to ensure
timely, accurate communication and application of these charges. Technology will likely
be the key enabler to managing these changes given the fluidity and complexity in this new
environment,” he said.
The Path Forward: Managing the Fuel Component of
trans-Pacific 2019-2020 Contracting Cycle
Seabury Maritime As the trans-Pacific contracting period quickly approaches, it is vital that shippers integrate
urges carriers to open IMO 2020 regulations and BAF into their thinking. While the underlying price of low-sulfur
up their books a bit fuel will not be known until next year, shippers can seek further clarity on the components
more ... to help move of trade factors in the new formula. “Seabury Maritime agrees with Gemini Shippers Group,
the issue to a fact- that transparency is key to creating trust that the carriers are truly just passing these new
based discussion with costs in an equitable way. Most fuel data may seem like an important trade secret, but more
detailed fuel or cost transparency can actually lead to deeper relationships and less pushback from rightfully
data to support it. suspicious customers, while better highlighting carriers’ efforts to improved fuel efficiency
and lower costs as a result. Lack of clarity can even cause undue blowback to carriers in
some cases, simply because of the lack of understanding of the metrics, a self-inflicted
wound for carriers. Seabury Maritime can help both shippers and carriers in creating mutual
trust by analyzing the data from an independent advisor’s vantage point”, Nikos Petrakakos,
Seabury Maritime’s vice president and head of environmental innovation, said.
Shippers should be prepared to share in the risk of changing fuel prices thru the assessment
of reasonable and transparent fuel-surcharge calculations. According to Gemini Shippers
Group, “Carriers who offer a clear, transparent, and reflective formula should be rewarded
with commitments by their customers. If carriers cannot explain or justify their formulas,
then shippers should be wary.”
Key steps needed
• Request a detailed explanation of how your carriers’ trade factors are calculated.
• Be able to validate the assumptions including ship size, speed, and industrial
utilization against industry benchmarks.
• Understand the timing for your carriers’ implementation of the new fuel formula.
Will it go into effect in January 2020 or sooner?
• Understand the impact for each carriers’ all-in rate (ocean plus bunker) based on
future changes in the fuel price, both up and down.
• Ensure contracts address failure to come to agreement on how future
20 www.ihsmarkit.com | www.joc.com
©2019 IHSMarkitWHITEPAPER, March 2019
IMO 2020: What Every Shipper Needs To Know
fuel surcharges will be dealt with as well as protections in place for space
commitments and price from time of implementation until the end of contract.
• Be prepared to offer your own fuel formula to carriers where there is a lack of
clarity.
• Ensure your own formula is fair for both sides.
• Engage industry experts where needed to provide analytical support for validation
and negotiation.
• Reward carriers that offer clarity and transparency with commitments for cargo.
Conclusion
All parties benefit when there is a clear understanding of the underlying costs for carriers A transparent method
to provide their services to shippers. Shippers rely on carriers to maintain the integrity of to calculate fuel
their transportation network to move their good to market. Both parties share in the risk surcharges and the
of the movement of underlying commodity prices. A transparent method to calculate fuel impact of low-sulfur
surcharges and the impact of low-sulfur fuel is imperative to securing the financial health of fuel is imperative to
carriers and shippers supply chains. securing the financial
health of carriers and
shippers supply chains.
www.ihsmarkit.com | www.joc.com 21
©2019 IHSMarkitWHITEPAPER, March 2019
IMO 2020: What Every Shipper Needs To Know
About IHS Markit
IHS Markit (Nasdaq: INFO) is a world leader in critical information, analytics and solutions for the major industries and markets
that drive economies worldwide. The company delivers next-generation information, analytics and solutions to customers www.ihsmarkit.com
in business, finance and government, improving their operational efficiency and providing deep insights that lead to well-
informed, confident decisions. IHS Markit has more than 50,000 key business and government customers, including 85 percent
of the Fortune Global 500 and the world’s leading financial institutions. Headquartered in London, IHS Markit is committed to
sustainable, profitable growth.
IHS Markit is a registered trademark of IHS Markit Ltd. All other company and product names may be trademarks of their
respective owners © 2019 IHS Markit Ltd. All rights reserved.
About The JOC
The leading information and marketing services provider for the domestic and international containerized cargo community,
the JOC delivers high-quality intelligence and expertise to help customers make better business decisions — in print, online www.joc.com
and face-to-face at leading industry events. In addition, the JOC provides best-in-breed marketing channels to help companies
reach their target audience. JOC.com is the foremost industry website covering international and domestic logistics issues on a
daily basis, and The Journal of Commerce is, and has been since 1827, the source for authoritative editorial content relied on by
international logistics executives around the world. The JOC organizes several leading industry events each year, including its
flagship TPM Conference in Long Beach; the JOC Gulf Shipping Conference in Houston; the Container Trade Europe Conference
in Hamburg, Germany; TPM Asia in Shenzhen, China; JOC Inland Distribution Conference in the US Southeast; and the JOC Port
Performance North America Conference in New Jersey.
JOC is part of IHS Markit.
About Gemini Shippers Group
Gemini Shippers Group is a Shippers Association changing the way companies procure transportation. As a not-for-profit
organization, Gemini has become a leading logistics player by serving its members for nearly 100 years. Gemini offers members
access to competitive global ocean freight contracts, long term rates, and space allocation with a wide variety of top tier ocean
carriers by utilizing collective bargaining power and complete cost transparency. Gemini goes beyond the role of a typical
shippers association and aims to streamline the process between quote request and shipment arrival by providing members
with rate search, tracking & tracing, rate audit, and data analytics tools. Our mission is to aid companies, regardless of size and
experience, in navigating the complex environment of transportation procurement. Our team of transportation and supply www.geminishippers.com
chain executives is focused on providing our members with neutral competitive intelligence built on delivering measurable
service and cost improvement.
About Seabury Maritime
Seabury Maritime is a subsidiary of Seabury Capital Group LLC (“Seabury Capital”), which operates a number of specialty
finance, investment banking, technology, and software companies with a core focus anchored in aviation, aerospace & defense,
maritime, and financial services & technology. Seabury Maritime is focused on global trade and transportation. Our team has
developed a thorough understanding of the underlying competitive economics that drive strategic investments and decision- www.seaburymaritime.com
making, while assisting companies operationally to adapt for success and maintain sustained competitive advantage.
Seabury Maritime is a leader in the Maritime Environmental and Fuel Efficiency field, offering a commercial perspective as related
to IMO 2020, GHG Emissions, and beyond. Our team navigates customers through the impact that environmental regulations
and associated risks can have on their business, while helping them take advantage of the commercial opportunities that
these changes offer. Since its founding in 1995, Seabury Capital has taken ownership stakes in software and asset management
businesses servicing the aviation and travel industries. Within the last few years, Seabury Capital has expanded its portfolio
by investing in early stage startup companies within the financial technology industry and structured investment products. In
addition, Seabury Capital owns and operates FINRA and FCA regulated investment banking services firms in the U.S. and U.K.,
respectively, serving external clients as well as assisting the companies in which Seabury Capital has invested. Seabury Capital has
operations in New York, Amsterdam, Berlin, Chicago, Cordoba, Dallas, Dublin, Durban, Edison (NJ), Hong Kong, Houston, Jersey
City, London, Los Angeles, Manila, Minneapolis, Singapore, Summit (NJ), Stamford (CT), and Tokyo. www.seaburycapital.com
www.ihsmarkit.com | www.joc.com
©2019 IHSMarkitYou can also read