GIFT CONTAGION IN ONLINE GROUPS: EVIDENCE FROM WECHAT RED PACKETS
←
→
Page content transcription
If your browser does not render page correctly, please read the page content below
GIFT CONTAGION IN ONLINE GROUPS:
                                                       EVIDENCE FROM WECHAT RED PACKETS

                                                                    Yuan Yuan∗, Tracy Xiao Liu†, Chenhao Tan‡,
                                                                    Qian Chen§, Alex ‘Sandy’ Pentland¶, Jie Tangk
arXiv:1906.09698v3 [econ.GN] 6 Sep 2020

                                                                                           Abstract

                                                 Our study seeks to identify the social contagion of in-group gifts: if gifts trigger their
                                              recipients to send more gifts subsequently, the actual impact of a gift on group dynamics
                                              would be greatly amplified. Causal identification of contagion is always challenging in
                                              observational data; To identify gift contagion, we leverage a natural experiment using a
                                              large sample of 36 million online red packets sent within 174,131 chat groups on WeChat,
                                              one of the largest social network services worldwide. Our natural experiment is enabled
                                              by WeChat’s random gift amount algorithm, with which the amount that a user receives
                                              does not depend on her own attributes. We find that, on average, receiving one more
                                              dollar causes a recipient to send 18 cents back to the group within the subsequent 24
                                              hours. Moreover, this effect is much stronger for “luckiest draw” recipients or those who
                                              receive the largest share from a red packet, suggesting a group norm according to which
                                              the luckiest draw recipients should send the first subsequent red packets. Additionally,
                                              we find that gift contagion is affected by in-group friendship network properties, such
                                              as the number of in-group friends and the local clustering coefficient.

                                          ∗
                                            Institute for Data, Systems, and Society, Massachusetts Institute of Technology
                                          †
                                            Department of Economics, Tsinghua University
                                          ‡
                                            Department of Computer Science, University of Colorado Boulder
                                          §
                                            Tencent, Inc.
                                          ¶
                                            Media Lab, Massachusetts Institute of Technology
                                          k
                                            Department of Computer Science, Tsinghua University

                                                                                                1
1        Introduction

Individuals belong to many social groups. People may have their kinship groups, friend groups, work
groups or organizations, and interest groups. Groups provide their members with social identity
(Tajfel et al., 1979; Chen and Li, 2009). Groups also deeply influence and shape the behavior of
their members (Cialdini and Goldstein, 2004; Christakis and Fowler, 2007; Bond et al., 2012; Aral
and Walker, 2012).
        Nowadays, many daily activities have heavily relied on digital platforms. Many social network
platforms, including Google Hangout, Facebook Messenger, WhatsApp, and WeChat, provide group
chat features. The focus of our study is user behavior on WeChat, the largest Chinese social network
platform with more than one billion users. In China, people use WeChat groups for a variety of
purposes, including relationship maintenance, opinion and information exchange, and event planning
(Qiu et al., 2016). China Daily, a Chinese mainstream media site, reported that WeChat workgroups
have greatly increased work efficiency and enabled long-distance coordination.1
        Although the prior literature has focused on gift exchange between individuals (Sherry Jr, 1983;
Joy, 2001; Mauss, 2002), few studies have shed light on the role of the gifts distributed within a
group. Gifts can be physical or cash: for example, many East and Southeast Asian countries have
a tradition of monetary gifts referred to as “red packets” (Luo, 2008; Li, 2011). Gifts are widely
exchanged between family members, friends, and people who intend to create interpersonal bonds
or express appreciation (Mauss, 2002). In organizations or workplaces, after receiving gifts from
group leaders, group members would reciprocate with higher levels of work efforts (Akerlof, 1984;
Kube et al., 2012).
        Gifts can also be distributed within a group, without recipients specified (Yamagishi and Cook,
1993). For example, a person who travels abroad may bring back candies or snacks to her work
group. In China or other East Asian countries, if certain “lucky things” happen to a person, such
as getting a job promotion, being admitted into a top university, receiving a bonus from their
organizations, or even winning a lottery, she would host and pay for a dinner party to spread her
fortune to other group members. The dinner party is also regarded as a type of in-group gift.
Although in-group gifts are pervasive, their impact on group dynamics is not well studied in the
prior literature.
        Our study seeks to identify the contagious effect of in-group gifts: whether sending gifts would
    1
        http://africa.chinadaily.com.cn/a/201905/17/WS5cddf9cda3104842260bc278.html

                                                     2
trigger the recipients to do likewise in the future. If the contagious effect exists, the actual impact
of a gift will be much greater than its nominal value. The contagious nature of in-group gifts might
thus tighten in-group relationships as effectively as, for instance, team building activities do (Klein
et al., 2009).
      Using a large-scale dataset of 3.4 million WeChat users, we provide evidence of the contagion
of in-group gifts on this online platform. Specifically, we study the flying transmission of online red
packets within WeChat groups. In 2014, WeChat introduced its online red packet feature and it
swiftly became extremely popular (Cai et al., 2017; Wu and Ma, 2017). For example, more than 700
million people engaged in sending or receiving red packets during a week in 2019.2 Our preliminary
data observations show that conditional on the emergence of a group red packet, there is a 16-fold
increase in the likelihood of another red packet being sent within ten minutes. This observation
suggests the contagious nature of online red packets, which was described as “red packet rain” by
the media.3 In our study, gift contagion means that the larger amount a recipient obtains, the larger
amount she will be triggered to send to the group.
      Identifying social contagion is notoriously challenging for observational studies (Christakis and
Fowler, 2007; Fowler and Christakis, 2008; Aral and Walker, 2012; Bond et al., 2012; Kramer et
al., 2014; Aral and Nicolaides, 2017; Kizilcec et al., 2018). First, even if we observe group members
send many gifts within a short timeframe, they may do so spontaneously to celebrate a festival or
an event without mutual influence (Aral et al., 2009). The “temporal clustering” effect is thus an
important confounding factor. In addition, homophily, the phenomenon that individuals tend to
befriend similar others, may explain away the correlation between the gift amount that one receives
and the amount that one sends later; for example, wealthy people tend to cluster in a social group
and distribute large amount gifts (McPherson et al., 2001; Shalizi and Thomas, 2011). By contrast,
in our WeChat setting, the gift amount received is determined by the platform’s random assignment
algorithm. This algorithm provides us with a golden opportunity to study the causal relationship
between the cash amount received and subsequent gifting behavior. In other words, we are able
to treat this random amount allocation as a natural experiment and overcome the identification
problems with observational data.
      In an attempt to uncover the underlying mechanisms, we further identify a group norm that may
primarily drive the contagion (Feldman, 1984; Krupka and Weber, 2013; Krupka et al., 2016). Our
  2
      http://www.xinhuanet.com/fortune/2019-02/11/c_1124097290.htm
  3
      https://www.scmp.com/comment/insight-opinion/article/1720683/xinhua-two-minds-over-virtual-red-packet-craze

                                                    3
analysis suggests that the luckiest draw recipients might abide by an implicit group norm and send
the first subsequent red packet. Luckiest draw recipients are those who receive the largest share
of a red packet, highlighted in the user interface of the recipient list. They may thus attract more
attention and experience more reputational concerns. Our additional analysis further suggests that
the strength of the norm is tied to the gap of received amounts between the luckiest draw recipients
and others.
        Moreover, we examine how a group member’s in-group social network position impacts the gift
contagion (Backstrom et al., 2006; Jackson, 2010; Aral and Walker, 2012; Banerjee et al., 2013;
Breza and Chandrasekhar, 2019). Since our data contains information about WeChat friendships,
we construct a WeChat friendship network in which an edge represents that two users are WeChat
contacts (“friends”).4 Our results suggest that the effect of the amount received is intensified by the
network degree, i.e., the number of in-group friends, while it is alleviated by the network clustering
coefficient, i.e., the extent to which an individual’s friends know each other.

2        Background

WeChat is the largest Chinese social network platform, with more than one billion monthly active
users as of 2018. The platform allows users to designate private contacts (we use the term “friends”
in the context of our study). Users can also create group chats by inviting friends, who in turn
can invite their friends (Qiu et al., 2016). WeChat groups can be created for a wide variety of
purposes, ranging from family groups to company groups and special interest groups. The number
of group members ranges between 3 and 500. We study the online gifting of “red packets,” which
is a traditional way of expressing gratitude or wishes for good fortune in East and Southeast Asia.
In 2014, WeChat introduced its online red packet feature, allowing users to send monetary gifts
to either a friend or a group chat. WeChat red packets have become so popular that 55% of the
Chinese population sent and received red packets on a single day. The extent of red packet giving
behavior on WeChat provides us with a sampled dataset of 3,450,540 users and 36 million red
packets cumulatively worth 160 million CNY (Chinese yuan, roughly 22.5 million USD).
        In particular, we focus on the most popular type of online red packet – the random-amount,
group-designated red packet, as depicted in Figure 1.5 In this example, Panel (a) provides the
    4
     It is worth noting that the network of interest differs from the potential sender-recipient relationship network,
which is essentially a clique (fully connected network) in an online group.
   5
     Senders can also choose to split red packets equally, although this type of red packets is much less popular than
random-amount red packets.

                                                          4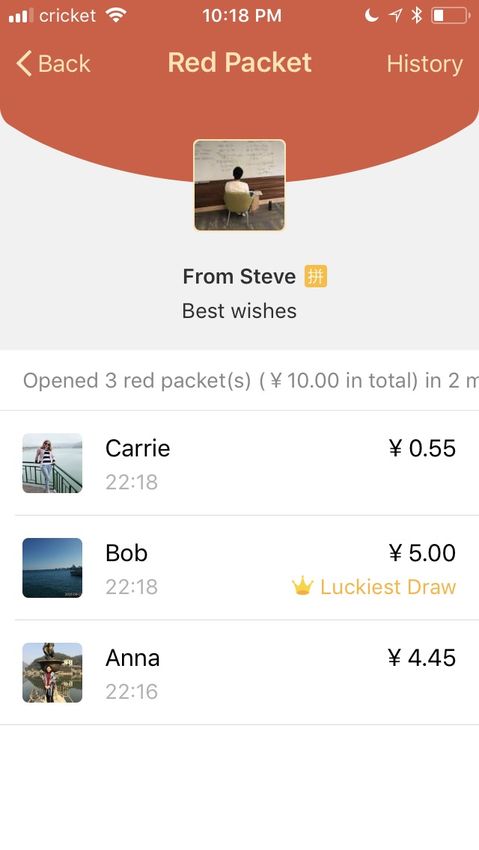
(a)                             (b)                                (c)
                                                                                sent amount

                                                                                     quantity

(d)                      (e1)                    (e2)              (f)

                                                                   order=3, rank=3

                                                                   order=2, rank=1
                            when some            when all shares
                           shares are left        are received     order=1, rank=2
                                                                           received amount
                                                                                  (random)

      Figure 1: The illustration of group red packet with random amounts received.

                                             5
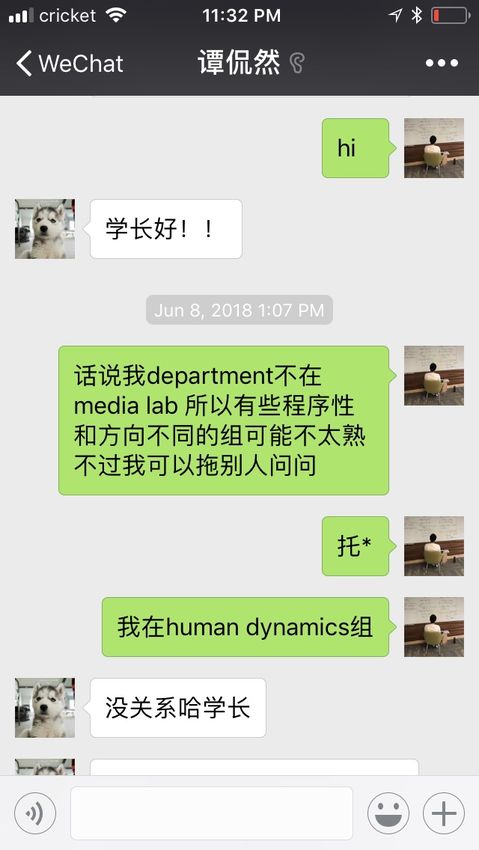
basic information about the group, the name of which is “Party!”, with five group members in total.
Panel (b) presents the user interface of this group chat, with which a group member can click the
“Red Packet” button to send a red packet. Panel (c) shows that a group member (Steve in this
example) can choose both the total amount of the red packet that he would like to send (“Total”=10
CNY) and the number of recipients (“Quantity”=3). Panel (d) is the interface for the red packet
notification, with which a user can click the orange button to choose to receive the packet. Panel
(e1) pops up when some shares of the red packet remain. In this example, only the first three
users who click the “Open” button can receive a share of this red packet. Panel (e2) pops up
when all shares of the red packet have been received by group members. Finally, Panel (f) shows
the recipient list, which can be viewed by clicking “View details” in Panel (e). All of the group
members, including senders, recipients, and non-recipients, can view the recipient list and see the
amount obtained by each recipient. We define the order of receiving time as the group members’
order at the time when they receive the red packet. In the above setting, the amount that each user
receives is randomly assigned by the platform, as a function of the total amount of the red packet,
the number of recipients, and the order of receiving time. Moreover, the platform designates which
user receives the largest amount of a red packet with a “Luckiest Draw” icon and the corresponding
yellow text. All group members can observe who is the luckiest draw recipient.

3        Data

WeChat provided us with randomly sampled WeChat groups with red packet activity from October
1, 2015, to February 29, 2016. To protect user privacy, the users’ identities were anonymized before
we accessed the data. To avoid data sparsity, we restricted our analysis to WeChat groups in which
the number of red packets sent is at least three times the number of group members. We also filtered
out groups that might be used for online gambling based on the following criteria: (1) a number
of red packets greater than 50 times the number of group members; (2) a name that suggests a
gambling focus (containing words such as 元/块(Chinese yuan), 发(send), 红(red), 包(packet), 最
佳(luckiest), 抢(grad), 赌(gamble), 钱(money), 福利(welfare), and 接龙(chain) and Arabic numerals
(which indicate the default packet amount set for gambling); or (3) no designated group name, which
could also be created for gambling temporarily.6 In total, this selection process resulted in 174,131
groups with 3,466,928 group members (3,450,540 unique users).
    6
        We show that groups identified as gambling groups appear to exhibit more gift contagion(Appendix A.3.1).

                                                           6
In our main analyses, we include: (1) the characteristics of 174,131 WeChat groups, including
the number of group members, the total number of red packets, and the total cash value of the red
packets; (2) 3,450,540 unique users in these WeChat groups with their characteristics, such as the
number of in-group friends are also retrieved; and (3) the attributes of each red packet, including
the cash amount and the corresponding recipients and the opening time. In total, our sample
comprises 36,608,864 red packets. We focus on “spontaneous red packets.” Prior to this type of red
packet, no group red packet was sent in the previous 24 hours.7 In total, we identified 1,549,720
spontaneous red packets sent to 7,266,446 recipients.8 We treat a user’s received red packet as one
observation so that we have 7,266,446 observations in total. Appendix A.1 presents a more detailed
data description. Our study was approved by MIT IRB.

4        Estimation Strategy

4.1       Random assignment algorithm on WeChat

Here we illustrate the random assignment algorithm for red packet amounts on WeChat. First, the
sender determines the total amount of the red packet (a > 0) and the number of recipients who will
share the red packet (n ≥ 1).9 Then group members choose to open the red packet on a first-come,
first-served basis. They do not know the values of a and n until they open the red packet. Let o
denote the order of receiving time (o = 1, 2, ..., n). The amount received by the recipient with order
o, denoted by Vo , is determined by the following algorithm:

     1. When o = 1 and o < n: The amount obtained by the first recipient (order = 1) follows a
                                         2a
          uniform distribution on (0,    n ].   Then the expected amount is10

                                                           1       2a  a
                                                E[V1 ] =     × (0 + ) = .
                                                           2       n   n

                                                                                                  2(a−V1 −...−Vo−1 )
     2. When 1 < o < n: The amount received follows a uniform distribution on (0,                      n−o+1         )].
    7
       We conduct robustness checks by varying the time window; our main results remain (Appendix A.3.1).
    8
       We exclude observations in which the sender clicks the red packet and receives a share of her own red packet.
     9
       In practice, the amount received is rounded to the nearest cent, and is set at least 0.01 CNY.
    10
       When o = n = 1, the amount received is a because the only recipient should take the whole amount.

                                                            7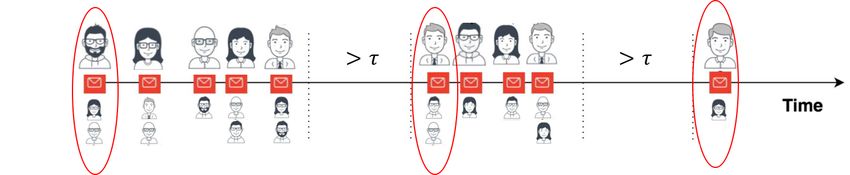
We have
                                                h                       i
                                    E[Vo ] = E E[Vo |V1 , ..., Vo−1 ]

                                                 1         2(a − V1 − ... − Vo−1 )
                                            =E × 0+
                                                 2                n−o+1
                                              a − E[V1 ] − ... − E[Vo−1 ]
                                            =                             .
                                                     n−o+1

        We show that     E[Vo ] =   a
                                    n   by induction:

        First, we have already shown that        E[V1 ] = na .
                                                                                                   a         (o−1)a
        Second, assuming we have E[Vo0 ] =              for all o0 < o, we have E[Vo ] =
                                                    a                                      a−(o−1) n       a− n
                                                    n                                       n−o+1      =    n−o+1     = na .

  3. When o = n: Vo = a − V1 − ... − Vo−1 , indicating that the last recipient takes the surplus.
        Then we have     E[Vo ] = a − E[V1 ] − ... − E[Vo−1 ] = na .

                                                                                  a
      Therefore, the expectation of the received amount is the same:              n.   However, the variance in the
amounts is not always the same. For example, when n > 2,11

                                    1      2a            a2
                        Var(V1 ) =     × ( − 0)2 = 2 ;
                                   12      n            3n
                                     h             i
                        Var(V2 ) = E Var(V2 |V1 ) + Var E[V2 |V1 ]
                                     h1       2(a − V1 ) 2 i       a − V
                                 =E
                                                                          1
                                          ×                   + Var
                                       12        n−1                 n−1
                                     h (a − V )2 i        1
                                 =E
                                              1
                                                    +           Var(V1 )
                                       3(n − 1)2      (n − 1)2
                                    (a − 2a )3           a3         n      a2
                                               n
                                 = −                +              ×     +
                                        9(n − 1)2 9(n − 1)2          2a 3(n − 1)2 n2
                                    a2           4a2
                                 = 2+                    > Var(V1 ).
                                   3n      9(n − 1)2 n2

In addition, we provide the more general proof for variance differences in Appendix A.2.
      To show that WeChat’s random assignment algorithm actually functions as described above, we
use Figure 2 to compare empirical distributions of received amounts from our data (red bars) and
the simulation results generated by the algorithm (blue bars). The figure presents two examples
that make up large proportions of our sample. One example refers to observations in which the
total amount is 10 CNY and the number of recipients is 5 (108,560 observations), and the second
is observations in which the total amount is 5 CNY and the number of recipients is 3 (38,523
 11
      See Appendix A.2 for the case in which n = 2.

                                                              8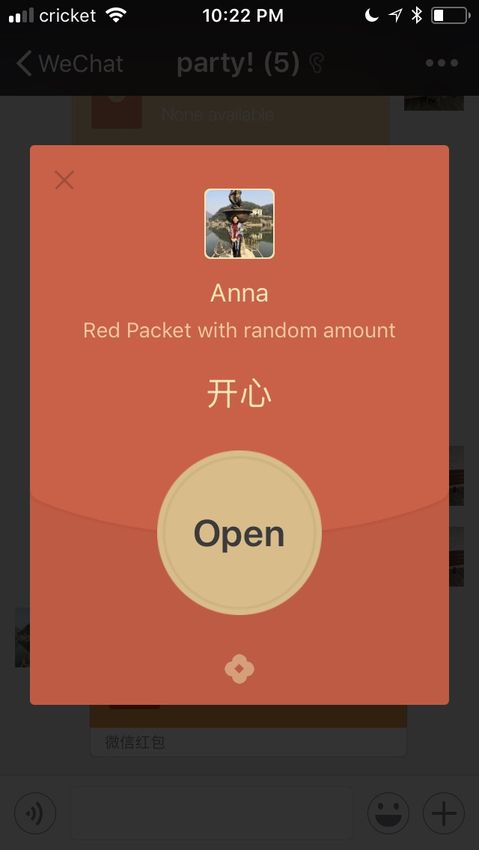
(10, 5, 1)                                         (10, 5, 2)                    (10, 5, 3)                        (10, 5, 4)                   (10, 5, 5)
  probablity (data)     0.03

                        0.02

                        0.01

                            0.0 0          5                                10    0           5         10       0           5           10   0               5            10   0          5          10
                                       (10, 5, 1)                                         (10, 5, 2)                    (10, 5, 3)                        (10, 5, 4)                   (10, 5, 5)
                        0.03
  probablity (simulation)

                        0.02

                        0.01

                            0.0 0          5                                10    0           5         10       0           5           10   0               5            10   0          5          10
                                    received amount                                   received amount                received amount              received amount                   received amount

                                                                                      (5, 3, 1)                          (5, 3, 2)                             (5, 3, 3)
                                               probablity (data)

                                                                     0.06

                                                                     0.04

                                                                     0.02

                                                                     0.00 0           2           4          0           2           4            0               2         4
                                                                                      (5, 3, 1)                          (5, 3, 2)                             (5, 3, 3)
                                               probablity (simulation)

                                                                     0.06

                                                                     0.04

                                                                     0.02

                                                                     0.00 0           2           4          0           2           4            0               2         4
                                                                                 received amount                     received amount                      received amount

Figure 2: Distributions of received amount in our dataset (red) and simulation (blue). The upper
two rows are those with a sent amount of 10 CNY and 5 recipients; The lower two rows are those
with a sent amount of 5 CNY and 3 recipients. A title with (a, n, o) represents that the total amount
is a CNY, the number of recipients is n, and the order of receiving time is o.

observations). We do not find significant differences between these two distributions (p = 0.30 and
0.36 for the two cases, respectively, two-sided Kolmogorov-Smirnov tests). Additionally, consistent
with the random assignment algorithm, the expectation of the amount received is solely determined
by the total amount and the number of recipients ( 10
                                                   5 = 2 and
                                                                                                                                                      5
                                                                                                                                                      3   for the two cases, respectively).
We also examine the remaining strata and the results hold.
           Furthermore, we conduct randomization check (Appendix A.2). The results suggest that condi-

                                                                                                                        9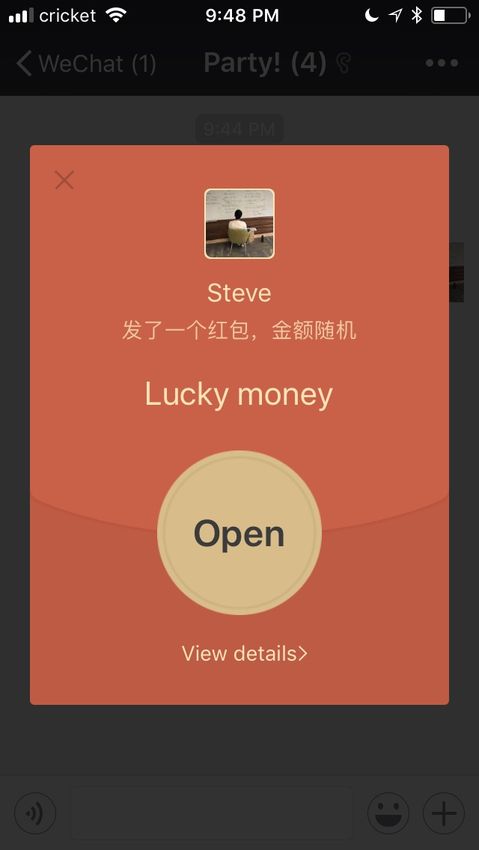
tional on the total amount of the red packet, the number of recipients, and the order of receiving
time, the amount received are uncorrelated with individual characteristics and historical behaviors.
Altogether, these analyses confirm that the amount that a recipient obtains is solely determined by
the following three variables: (1) the total amount of the red packet; (2) the number of recipients;
and (3) the order of receiving time.

4.2   Empirical strategy

We next specify our empirical strategy, which is used to quantify the impact of the amount received
on the recipient’s subsequent gifting behavior. We consider the random assignment of received
amounts as a stratified randomized experiment (Kernan et al., 1999; Imai et al., 2008; Imbens and
Rubin, 2015; Athey and Imbens, 2017), where a stratum is uniquely determined by the total amount
of the red packet, the number of recipients, and the order of receiving time. We apply the empirical
strategy of stratified randomized experiments in Imbens and Rubin (2015) and conduct the following
regression analyses:

                                              X
                             Ygir = βTgir +       γs Bs (Ar , Nr , Oir ) + gir .                   (1)
                                              s

   In Eq. (1), g denotes a WeChat group, and i denotes a unique user who receives a share of red
packet r. The dependent variable Ygir is the amount sent by the recipient i in the time interval after
receiving a red packet. The selected time intervals are 10 min, 1 h, 3 h, 6 h, 12 h, and 24 h. The
main independent variable Tgir is the cash amount received by user i from red packet r. Ar , Nr ,
and Oir refer to the total amount of the red packet r, its number of recipients, and user i’s order
of receiving time, respectively. Bs (Ar , Nr , Oir ) is a dummy variable indicating whether the value of
Xgir = (Ar , Nr , Oir ) belongs to the sth stratum. gir is the random noise. In total, we have 180,578
strata.
   We address data interdependence on the group and user level. Since only 3.1% of users in our
sample belong to more than one groups, data interdependence on the group level is the primary
concern. To consider data interdependence on the group and user levels at the same time, we do the
following: If two groups happen to contain the same user, our bootstrap considers these two groups
as the same “group.” Then we use the Poisson bootstrap at the “group” level for 100 replicates to
estimate the robust standard errors.
   We use Pearl’s directed acyclic graphs (DAGs) to visualize the causal relationships for a better

                                                    10
Amount received
① Total amount,
Confounding factors
② # of recipients
(e.g., group-level,
③ Order of receiving time
individual-level, or
time effects)
Amount sent in the future
Figure 3: The illustration of the directed acyclic graph of the variables.
understanding of our empirical strategy (Pearl, 2009). As shown in Figure 3, controlling for X
blocks all of the “backdoor” paths from T to Y , which satisfies the backdoor criterion and allows
us to identify the causal impact of T on Y . In this way, confounding factors, such as homophily,
would not bias our estimation.
We use this empirical strategy for two reasons. First, it enables us to fully control for the stratum
fixed effect, without requiring a specific functional form for the impact of X. For example, a linear
specification, i.e., adding Ar , Nr , and Oir into the regression, leads to an overestimated treatment
effect (Appendix A.3.2.1). Second, we realize that if most strata have few observations, we may fail
to measure such within-stratum effects. Fortunately, our sample size is sufficiently large so that we
have a sufficient number of observations within each stratum.
5 Results
5.1 Identifying gift contagion in WeChat groups
Before applying our empirical strategy, we use a simplistic, non-parametric approach to shed light on
the potential causal effect of the amount received on the probability of sending the first subsequent
red packet. We calculate this probability of sending the first subsequent red packet for the recipients
of a given red packet and present the results in Figure 4.12 We find a generally decreasing trend with
the rank of received amounts: those who receive the largest amount have the greatest probability
of sending the first subsequent red packet. Moreover, the largest probability difference lies between
12
Here we leverage that rationale that the expected amount received is the same for all recipients of a red packet
but omit the impact of variance.
11Figure 4: The recipients’ probability of sending the first subsequent red packet. “Num” is the number
of recipients of red packets. The x-axis indicates the rank of received amounts among recipients.
For example, “1st” refers the user who received the largest amount, or the luckiest draw recipient.
“>5th” refers to the average probability among recipients whose rank is below the 5th position. The
dashed gray line represents the average probability that a non-recipient sends the first subsequent
red packet. The error bars, i.e., the 95% CIs, are much smaller than the markers, and so become
invisible.
those who received the largest amount and those who received the second largest amount, while the
differences between other recipients are much smaller.
Next, we apply the empirical strategy described in Section 4 to further quantify the marginal
effect of the amount received. Figure 5 presents the regression results for different time intervals.
The left panel shows that on average, a recipient sends 18.16% [95%CI=11.48%, 24.84%] of the
amount that she receives within a 24-hour time frame. Moreover, we find that the marginal effect
grows in the first three hours after receiving a red packet and then stabilizes, suggesting that the
effect of receiving red packets lasts for approximately three hours.
(1) (2) (1)
We further separate Ygir in Eq. (1) into two components: Ygir and Ygir . Ygir is the amount
(2)
sent to the original sender (the sender of red packet r) and Ygir is the amount sent to other group
members.13 As shown in the right panel of Figure 5, on average, the marginal effect on the amount
sent to the original sender is 3.07% [95%CI=1.90%, 4.25%] in the next 24 hours. In contrast, the
marginal effect on the amount sent to other group members is much larger: 10.24% [95%CI=6.14%,
(1)
14.32%]. One possible motivation for gifting behavior is reciprocity; i.e., Ygir could be a proxy for
13 (1) (2)
Note that a small proportion of the total amount does not belong to either Ygir or Ygir because the sender can
also receive a share of her own red packets.
12marginal effect of amount received
marginal effect of amount received
0.30 0.30 amount sent to other group members
total amount sent amount sent to original senders
0.25 0.25
0.20 0.20
0.15 0.15
0.10 0.10
0.05 0.05
0.00 0.00
10m 1h 3h 6h 12h 24h 10m 1h 3h 6h 12h 24h
time interval since receiving time interval since receiving
Figure 5: Estimation results from Eq. (1). The x-axis represents the time interval since receiving a
red packet. The y-axis represents the marginal effect of receiving red packets on the amount sent
in the future. Error bars are the 95% CIs robust to group-level clustering.
(2)
direct reciprocity and Ygir could refer to indirect reciprocity. Therefore, our analyses here suggest
that direct reciprocity to the original sender may not be the main mechanism for the observed
contagion. Recipients may consider the group as a whole and repay the gift that they obtain, which
was defined as group-generalized exchange by Yamagishi and Cook (1993).
Additionally, we observe several interesting heterogeneous treatment effects (Appendix A.3.2.2).
First, male recipients tend to send more subsequent red packets than female recipients. Second,
older recipients are more likely to send subsequent red packets than younger recipients. Finally, the
original senders’ demographics may also affect contagion. For example, when the original sender
is female, recipients are slightly more likely to send subsequent red packets than when the original
sender is male.
5.2 Contagion stabilized by a group norm for “luckiest draw”
Group norms are effective for reducing coordination failure and facilitating cooperation within
groups (Feldman, 1984; Gächter et al., 2013). Recall that the WeChat user interface highlights who
is the luckiest draw recipient, and this information is observed by all group members. We posit
that this feature may promote certain norms for luckiest draw recipients’ behaviors. To investigate
the underlying group norms, we start by comparing the behavior differences between luckiest draw
recipients and non-luckiest draw recipients.
To examine the behavioral difference between luckiest and non-luckiest draw recipients, we run
13marginal effect of amount received
marginal effect of amount received
1.0 1.0 0.12
luckiest non-luckiest luckiest
probability of sending next
0.8 0.8 0.10 matched non-luckiest
0.6 0.6 0.08
0.4 0.4 0.06
0.04
0.2 0.2
0.02
0.0 0.0
0.00
10m 1h 3h 6h 12h 24h 10m 1h 3h 6h 12h 24h first second
time interval since receiving time interval since receiving subsequent subsequent
Figure 6: The left and middle two panels present regression estimates (Eq. (1)) for luckiest draw
recipients and non-luckiest draw recipients, respectively. The right panel represents the probability
that a “luckiest draw” recipient (versus their matched “non-luckiest draw” recipients) sends the first
(or second) subsequent red packet within 24 hours Error bars are the 95% CIs robust to group-level
clustering.
the regressions specified in Eq. (1) for these two subgroups, respectively. The left and middle
panels of Figure 6 report the marginal effects for “luckiest draw” and “non-luckiest draw” recipients
separately. We observe a large difference between these two subgroups: Within the next 10 minutes,
for instance, the marginal effect for non-luckiest draw recipients is 9.61% [95%CI=3.21%, 16.00%],
while the effect is 32.64% for luckiest draw recipients [95%CI=16.83%, 48.44%] — a more than
three-fold increase compared to non-luckiest draw recipients.
To further derive the causal effect of being a luckiest draw recipient on subsequent gifting
behavior, we implement the following matching procedure. We match each luckiest draw recipient
with non-luckiest draw recipients by holding the following variables constant: the total amount
of the red packet, the number of recipients of that red packet, order of receiving time, and the
amount received by the corresponding recipient. Matching on the first three variables allows us to
control for the effect of unobserved variables; matching on the received amount allows us to control
for the income effect. We then examine the difference in the probability of sending the first or
second subsequent red packet.14 Our matching procedure yields 668,936 luckiest draw recipients
and 1,658,283 non-luckiest draw recipients, representing successful matching of 33.7% of our luckiest
draw recipients. Again, we use group-level bootstrapping to construct the 95% confidence intervals
to address group-level interdependence. As shown in the right panel of Figure 6, when matching
a luckiest draw recipient with a non-luckiest draw recipient, we observe a 2.28% [95%CI=2.10%,
14
To utilize the largest possible number of observations, our matching is based on one-to-many instead of one-to-one
matching (Stuart, 2010).
142.42%] increase in the probability that the luckiest draw recipient would send the first subsequent
red packet. This result suggests that being the luckiest draw recipient alone promotes the observed
contagion. In contrast, for the second subsequent red packets, we find a much smaller increase
(0.29% [95%CI=0.17%, 0.41%]) in the probability of sending the second subsequent red packet.
This outcome suggests that being the luckiest draw recipient only affects recipients’ behaviors for
the first subsequent red packet in an economically sizable manner but not necessarily for the second
subsequent red packet.15 Altogether, these results support our conjecture of the existence of a group
norm according to which luckiest draw recipients should send the first subsequent red packet.
Moreover, we find that the strength of such a group norm is contingent on the discrepancy
between the amount received by the luckiest draw recipient and other recipients. Specifically, we
focus our analysis on the cash amount difference between the luckiest draw recipient and the second
largest recipient. We then run the following regression on luckiest draw recipients:
X
Ygir = βTgir + β 0 Tgir
0
+ αratio Zgir + γs Bs (Ar , Nr , Oir ) + gir . (2)
s
0 and Z . T 0 is the second-largest
Compared to Eq. (1), here we add two independent variables Tgir gir gir
0
Tgir
amount received from the same red packet; Zgir = Tgir represents the ratio of the second-largest
amount to the largest amount.
Our regression results show that the ratio of the second-largest to the largest amount has a
negative impact on the amount sent: for example, for the next 24 hours, we have α̂ratio = −0.452
(p = 0.01). This result suggests that, when the cash amount received by the luckiest-draw recipient
is much higher than others, she may feel more obligated to send red packets to the group. Thus,
the gift exchange contagion of luckiest draw recipients can also be possibly driven by individuals’
other-regarding preferences, such as inequality aversion (Bolton and Ockenfels, 2000, 2006).
5.3 Contagion affected by network positions
Finally, we apply network analysis to understand how the network position in an online group affects
recipients’ subsequent sending behaviors. Since group members may or may not be private contacts
on WeChat (“friends”), we can construct a relationship network between group members, with each
edge indicating that two group members are WeChat contacts.
We apply two measurements for a group member’s network position. The first is network degree
15
No significant difference is detected for the third and subsequent red packets.
15Table 1: Regression results for the effects of network positions.
Dependent Variable 10 minutes 24 hours 10 minutes 24 hours
Amount received 0.1544*** 0.1710 0.3973*** 0.7885***
(0.058) (0.130) (0.098) (0.243)
Normalized degree 1.0891*** 2.4792*** 1.0349*** 2.2915***
(0.072) (0.167) (0.075) (0.170)
Clustering coef. -0.1049* -0.4484***
(0.059) (0.129)
Normalized degree × Amount received 0.0016 0.0223 0.0404 0.1283
(0.094) (0.223) (0.095) (0.220)
Clustering coef. × Amount received -0.3305*** -0.8496***
(0.083) (0.185)
Group size fixed effect Y Y Y Y
Stratum fixed effect Y Y Y Y
No. of observations 7,266,446 7,266,446 7,266,446 7,266,446
No. of effective observations 7,180,759 7,180,759 7,093,474 7,093,474
Adjusted R2 0.0188 0.0159 0.0188 0.0159
*: p < 0.1, **: p < 0.05, ***: p < 0.01.
Group size fixed effect refers to a four-term polynomial of group size.
(Newman et al., 2006), which measures the number of friends in a WeChat group. Furthermore,
degree(i)
we use the normalized degree in our analysis: No. of group members , with a range of [0, 1]. The second
measurement is the clustering coefficient (Holland and Leinhardt, 1971; Watts and Strogatz, 1998),
or the extent to which a user’s friends are connected, which is defined below:
1[k ∈ Nj ]
P P
j∈Ni k∈Ni ,k6=j
clustering coefficient(i) = . (3)
|Ni |(|Ni | − 1)
Its value ranges in [0, 1]; 0 indicates that none of i’s friends are connected and 1 indicates that all
of i’s friends are connected in a WeChat group. We denote the set of a group member i’s friends
by Ni .
We add the normalized degree and clustering coefficient as independent variables into Eq. (1).
As shown in Table 1, having more friends in the group increases the amount that a recipient
sends subsequently, though the interaction effect between degree and the amount received is not
significant. Moreover, the clustering coefficient has a significant and negative impact on the amount
sent subsequently; its interaction effect with the amount received is significant. This result suggests
that the effect of amount received is stronger for those with lower clustering coefficients, i.e., whose
friends are less connected with each other.
16To explain these result, we posit two interpretations. The first plausible mechanism is social
bonding (Bowlby, 2012). Those with more in-group friends have more incentives to use red packets
to create social bonds with other group members. Moreover, people with low clustering coefficients
may feel obligated to send more red packets to promote interactions between their friends, who may
not know each other well. The second plausible motivation is indirect (downstream) reciprocity
(Nowak and Sigmund, 2005; Gong and Yang, 2019). Those with high degrees and low clustering
coefficients may be at the center of the in-group friendship networks. Therefore, they may have
more reputational concerns than other group members (Charness et al., 2011; Li and Xiao, 2014).
This reputational concern may give rise in more gifting behavior after receiving red packets.
6 Discussion
Using the random nature of the process of splitting online red packets, we leverage a natural ex-
periment to identify the causal effect of receiving gifts on the future gift exchange behavior within
WeChat groups. Furthermore, we reveal a group norm that the “luckiest draw” recipients should
take the lead in sending the first subsequent red packet. Additionally, we examine the effect of
network positions on the contagion.
We emphasize the importance of group contexts for triggering the contagion of prosocial be-
haviors, such as gift giving. Compared to prior studies that created artificial groups in the lab
(Yamagishi and Cook, 1993; Chen and Li, 2009), we present field evidence to show that prosocial
behavior within groups is greatly encouraged and stabilized. Our results also appeal for more future
field studies in relatively small, closed, online groups as a complement to the majority of studies
focused on online large-scale social networks (Backstrom et al., 2006; Bakshy et al., 2012; Aral and
Walker, 2012).
Our study has important managerial implications. First, from the perspective of organizational
behavior, the identified gift contagion implies how in-group gifts could promote group activity and
trust by engaging more group members in gifting behavior. Importantly, different from most gift
exchange studies in labor economics, the gifts in our study are not necessarily sent by the leaders of
social organizations. The design may help understand how to encourage group members to promote
group solidarity spontaneously. Second, from the perspective of business strategy, WeChat red
packets are a successful example of promoting mobile payments using social incentives. The social
contagion of group red packets partially explains why more than 200 million users attach their bank
17accounts to WeChat payment during 2015 when red packets were popularized.
We admit that our study has limitations. First, we focus on a subsample of WeChat groups.
Although our group selection process does not impact the internal validity of our conclusions, the
results should not be overgeneralized to the groups that are not examined in our study. For example,
we do not consider WeChat groups in which one or no red packets are sent and our estimated
marginal effects should not be generalized to these inactive groups. Second, it would be interesting
to examine the effect of receiving red packets on other user behaviors, such as group communication
and liking others’ feeds. Finally, we have not fully understood the role of the random feature of
online red packets in promoting gift contagion. We conjecture that “feeling lucky” and “spreading
the luck” may have an important moderating effect on the contagion of sending online group red
packets, as well as some other types of in-group gifts, such as dinner parties. All these could be
interesting future directions.
References
Akerlof, George A, “Gift exchange and efficiency-wage theory: Four views,” The American Eco-
nomic Review, 1984, 74 (2), 79–83.
Aral, Sinan and Christos Nicolaides, “Exercise contagion in a global social network,” Nature
Communications, 2017, 8, 14753.
and Dylan Walker, “Identifying influential and susceptible members of social networks,” Sci-
ence, 2012, 337, 337–341.
, Lev Muchnik, and Arun Sundararajan, “Distinguishing influence-based contagion from
homophily-driven diffusion in dynamic networks,” Proceedings of the National Academy of Sci-
ences of the United States of America, 2009, 106 (51), 21544–21549.
Athey, Susan and Guido W Imbens, “The econometrics of randomized experiments,” in “Hand-
book of Economic Field Experiments,” Vol. 1, Elsevier, 2017, pp. 73–140.
Backstrom, Lars, Dan Huttenlocher, Jon Kleinberg, and Xiangyang Lan, “Group forma-
tion in large social networks: membership, growth, and evolution,” in “Proceedings of the 12th
ACM SIGKDD International Conference on Knowledge Discovery and Data Mining” ACM 2006,
pp. 44–54.
18Bakshy, Eytan, Itamar Rosenn, Cameron Marlow, and Lada Adamic, “The role of social
networks in information diffusion,” in “Proceedings of the 21st International Conference on World
Wide Web” ACM 2012, pp. 519–528.
Banerjee, Abhijit, Arun G Chandrasekhar, Esther Duflo, and Matthew O Jackson, “The
diffusion of microfinance,” Science, 2013, 341 (6144), 1236498.
Bolton, Gary E and Axel Ockenfels, “ERC: A theory of equity, reciprocity, and competition,”
American Economic Review, 2000, 90 (1), 166–193.
and , “Inequality aversion, efficiency, and maximin preferences in simple distribution experi-
ments: comment,” American Economic Review, 2006, 96 (5), 1906–1911.
Bond, Robert M, Christopher J Fariss, Jason J Jones, Adam DI Kramer, Cameron
Marlow, Jaime E Settle, and James H Fowler, “A 61-million-person experiment in social
influence and political mobilization,” Nature, 2012, 489 (7415), 295.
Bowlby, John, The making and breaking of affectional bonds, Routledge, 2012.
Breza, Emily and Arun G Chandrasekhar, “Social networks, reputation, and commitment:
Evidence from a savings monitors experiment,” Econometrica, 2019, 87 (1), 175–216.
Cai, Chen, Hongyan Shang, and Tansiny Lertsiriworapong, “A study of motivation factors
of “grab red envelopes” phenomenon: A case study of Wechat,” in “4th International Conference
on Management Science, Innovation, and Technology” 2017.
Charness, Gary, Ninghua Du, and Chun-Lei Yang, “Trust and trustworthiness reputations
in an investment game,” Games and Economic Behavior, 2011, 72 (2), 361–375.
Chen, Yan and Sherry Xin Li, “Group identity and social preferences,” American Economic
Review, 2009, 99 (1), 431–57.
Christakis, Nicholas A and James H Fowler, “The spread of obesity in a large social network
over 32 years,” New England Journal of Medicine, 2007, 357 (4), 370–379.
Cialdini, Robert B and Noah J Goldstein, “Social influence: Compliance and conformity,”
Annual Review of Psychology, 2004, 55, 591–621.
19Feldman, Daniel C, “The development and enforcement of group norms,” Academy of Management
Review, 1984, 9 (1), 47–53.
Fowler, James H and Nicholas A Christakis, “Dynamic spread of happiness in a large social
network: longitudinal analysis over 20 years in the Framingham Heart Study,” British Medical
Journal, 2008, 337, a2338.
Gächter, Simon, Daniele Nosenzo, and Martin Sefton, “Peer effects in pro-social behavior:
Social norms or social preferences?,” Journal of the European Economic Association, 2013, 11 (3),
548–573.
Gong, Binglin and Chun-Lei Yang, “Cooperation through indirect reciprocity: The impact of
higher-order history,” Games and Economic Behavior, 2019.
Holland, Paul W and Samuel Leinhardt, “Transitivity in structural models of small groups,”
Comparative Group Studies, 1971, 2 (2), 107–124.
Imai, Kosuke, Gary King, and Elizabeth A Stuart, “Misunderstandings between experi-
mentalists and observationalists about causal inference,” Journal of the Royal Statistical Society:
Series A, 2008, 171 (2), 481–502.
Imbens, Guido W and Donald B Rubin, Causal inference in statistics, social, and biomedical
sciences, Cambridge University Press, 2015.
Jackson, Matthew O, Social and economic networks, Princeton university press, 2010.
Joy, Annamma, “Gift giving in Hong Kong and the continuum of social ties,” Journal of Consumer
Research, 2001, 28 (2), 239–256.
Jr, John F Sherry, “Gift giving in anthropological perspective,” Journal of Consumer Research,
1983, 10 (2), 157–168.
Kernan, Walter N, Catherine M Viscoli, Robert W Makuch, Lawrence M Brass, and
Ralph I Horwitz, “Stratified randomization for clinical trials,” Journal of Clinical Epidemiology,
1999, 52 (1), 19–26.
Kizilcec, René F, Eytan Bakshy, Dean Eckles, and Moira Burke, “Social influence and
reciprocity in online gift giving,” in “Proceedings of the 2018 CHI Conference on Human Factors
in Computing Systems” ACM 2018, p. 126.
20Klein, Cameron, Deborah DiazGranados, Eduardo Salas, Huy Le, C Shawn Burke,
Rebecca Lyons, and Gerald F Goodwin, “Does team building work?,” Small Group Research,
2009, 40 (2), 181–222.
Kramer, Adam DI, Jamie E Guillory, and Jeffrey T Hancock, “Experimental evidence of
massive-scale emotional contagion through social networks,” Proceedings of the National Academy
of Sciences of the United States of America, 2014, 111 (24), 8788–8790.
Krupka, Erin L and Roberto A Weber, “Identifying social norms using coordination games:
Why does dictator game sharing vary?,” Journal of the European Economic Association, 2013,
11 (3), 495–524.
, Stephen Leider, and Ming Jiang, “A meeting of the minds: Informal agreements and social
norms,” Management Science, 2016, 63 (6), 1708–1729.
Kube, Sebastian, Michel André Maréchal, and Clemens Puppe, “The currency of reci-
procity: Gift exchange in the workplace,” American Economic Review, 2012, 102 (4), 1644–62.
Li, Ling, “Performing bribery in China: Guanxi-practice, corruption with a human face,” Journal
of Contemporary China, 2011, 20 (68), 1–20.
Li, Lingfang Ivy and Erte Xiao, “Money talks: Rebate mechanisms in reputation system design,”
Management Science, 2014, 60 (8), 2054–2072.
Luo, Yadong, “The changing Chinese culture and business behavior: The perspective of intertwine-
ment between guanxi and corruption,” International Business Review, 2008, 17 (2), 188–193.
Mauss, Marcel, The gift: The form and reason for exchange in archaic societies, Routledge, 2002.
McPherson, Miller, Lynn Smith-Lovin, and James M Cook, “Birds of a feather: Homophily
in social networks,” Annual Review of Sociology, 2001, 27 (1), 415–444.
Newman, Mark, Albert-Laszlo Barabasi, and Duncan J Watts, The structure and dynamics
of networks, Princeton university press, 2006.
Nowak, Martin A and Karl Sigmund, “Evolution of indirect reciprocity,” Nature, 2005, 437
(7063), 1291.
Pearl, Judea, Causality, Cambridge university press, 2009.
21Qiu, Jiezhong, Yixuan Li, Jie Tang, Zheng Lu, Hao Ye, Bo Chen, Qiang Yang, and
John E Hopcroft, “The lifecycle and cascade of wechat social messaging groups,” in “Proceedings
of the 25th International Conference on World Wide Web” ACM 2016, pp. 311–320.
Shalizi, Cosma Rohilla and Andrew C Thomas, “Homophily and contagion are generically
confounded in observational social network studies,” Sociological Methods & Research, 2011, 40
(2), 211–239.
Stuart, Elizabeth A, “Matching methods for causal inference: A review and a look forward,”
Statistical Science, 2010, 25 (1), 1.
Tajfel, Henri, John C Turner, William G Austin, and Stephen Worchel, “An integrative
theory of intergroup conflict,” Organizational identity: A reader, 1979, pp. 56–65.
Watts, Duncan J and Steven H Strogatz, “Collective dynamics of ‘small-world’ networks,”
Nature, 1998, 393 (6684), 440.
Wu, Ziming and Xiaojuan Ma, “Money as a social currency to manage group dynamics: Red
packet gifting in Chinese online communities,” in “Proceedings of the 2017 CHI Conference Ex-
tended Abstracts on Human Factors in Computing Systems” ACM 2017, pp. 2240–2247.
Yamagishi, Toshio and Karen S Cook, “Generalized exchange and social dilemmas,” Social
Psychology Quarterly, 1993, pp. 235–248.
22Online Appendix
A.1 Sample Description
Our sample includes 3,450,540 unique users in 174,131 WeChat groups. For each user, we obtain
their demographic information listed below. For variables that are updated monthly, we use the
information retrieved in February 2016 for our analysis. Moreover, we identify friendships, i.e.,
whether users are WeChat contacts, between users in our dataset. We summarize our data below:
• Group
– Group size: the number of group members in a group.
• Group members
– Gender: self-reported by users.
– Age: provided by WeChat.
– Number of groups that a user joins.
– Number of private contacts (“friends”) that a user has on WeChat.
– Within-group degree: Number of private contacts (or “friends”) that a user has in one
Wechat group. Note that it is possible that members of the same group may not be
“friends.”
– Clustering coefficient: the extent to which a user’s friends are connected in the group. It
has been defined in the main text.
• Red packet sending variables
– Sending time.
– Sender id.
– Total cash amount of the red packet, determined by the sender.
– The number of recipients, determined by the sender.
• Red packet receiving variables
– Recipients id.
23– Receiving time. The time interval between a red packet being sent and being received
by the current recipient. A WeChat red packet would expire 24 hours after being sent.
We use the receiving time to infer the order of receiving time given a red packet r.
– The cash amount received.
We report the summary statistics for group size, the total number of red packets, and the total
cash amount of red packets for each group in Table A.1. We also present summary statistics for users’
gender and age in Table A.2. Those between the ages of 20 and 30 represent a large proportion of
our sample. In Table A.3, we further report information for within-group degree (how many private
contacts, or “friends” that a user has in a group), the number of private contacts on WeChat, and
the number of groups that she joins on WeChat.
Last, we summarize information for red packets (Table A.4), including the cash amount, the
number of recipients, the time interval between two successive red packets in a group, and the total
completion time. We find that most red packets contain relatively small amounts (75% of them do
not exceed 5 CNY). In addition, the time intervals between two successive red packets are generally
small, with all of the money of a red packet often received within minutes.
A.2 Randomization Check
Conditional on the three variables that determine our stratification, we show that the received
amount (T ) is independent of the following variables: (1) whether the user is female; (2) the user’s
age; (3) within-group degree, or the number of “friends”; (4) the number of friends on WeChat (de-
noted by fricnt); (5) the number of groups that the user joins (denoted by joincnt); (6) the total
amount of red packets that the user has sent in the group (denoted by history_sendamt); (7) the to-
tal number of red packets that the user has sent in the group (denoted by history_sendcnt); (8) the
total amount of red packets that the user has received in the group (denoted by history_recvamt);
(9) the total number of red packets that the user has received in the group (denoted by history_recvcnt);
(10) the total amount of red packets sent in the group by all group members historically (denoted
by groupamt); and (11) the total number of red packets sent in the group by all group members
historically (denoted by groupnum).
Specifically, we run simple OLS regressions for each stratum in which the dependent variable is
one of the aforementioned variables, and the independent variable is the cash amount received by
a user. We present the corresponding coefficients and the adjusted p-values after False Discovery
24Control16 for the two representative cases in Tables A.5 and A.6, respectively. In summary, no
significant correlation is found. We also check other combinations for the sent amount and the
number of recipients, and no significance is found. Altogether, our data pass the randomization
check.
Calculation of the variance of the amount received
Here we provide a complete calculation for the variance of the amount received by the oth recipient.
Although the expected amount is the same for different recipients, we show that their variance is
generally different. Specifically, we show a non-decreasing trend for the variance with o. Let So
denote the summation of the first o recipients’ amounts received (So = V1 + V2 + ...Vo ). Recall that
a is the total amount of the red packet, n is the number of recipients, and Vo is the amount received
by the oth recipient.
We first consider the case in which o < n:
a − So i 4 h (a − So )2 i
h
E[So+1
2
] = E (So + Vo+1 )2 = E[So2 ] + 2E So × + E
n−o 3 (n − o)2
4 a2
2 4 1 2a 8 a
= E[So ] 1 −
2
+ + E [S o ] − + (4)
n − o 3 (n − o)2 n − o 3 (n − o)2 3 (n − o)2
2 4 1 2o 8o 4
= E[So2 ] 1 − + + a2
− + .
n − o 3 (n − o)2 (n − o)n 3(n − o)2 n 3(n − o)2
Note that E[So ] = E[V1 ] + ... + E[Vo ] = ao
n.
We next relate Vo , the amount received by the oth recipient, to So :
h1 (2(a − S( o − 1)))2 i 1 h (a − So−1 )2 i
Var(Vo ) = E × = E ;
12 (n − o + 1)2 3 (n − o + 1)2
h1 (2(a − S( o − 2)))2 i 1 h (a − So−2 )2 i
Var(Vo−1 ) = E × = E .
12 (n − o + 2)2 3 (n − o + 2)2
Dividing the first equation by the second, we obtain
Var(Vo ) (n − o + 2)2 E[(a − So−1 )2 ]
= × .
Var(Vo−1 ) (n − o + 1)2 E[(a − So−2 )2 ]
16
We use the Benejamini-Hochberg procedure with α = 0.1 because it is more conservative and generates smaller
adjusted p values than methods such as Bonferroni correction.
25Then,
Var(Vo ) Var(Vo ) Var(Vo−1 ) Var(V2 )
= × × ... × =
Var(V1 ) Var(Vo−1 ) Var(Vo−2 ) Var(V1 )
(n − o + 2)2 (n − o + 3)2 n2
= × ... ×
(n − o + 1)2 (n − o + 2)2 (n − 1)2
E[(a − So−1 )2 ] E[(a − So−2 )2 ] E[(a − S1 )2 ]
× × × ... ×
E[(a − So−2 )2 ] E[(a − So−3 )2 ] a2
n2 E[(a − So−1 )2 ]
= .
(n − o + 1)2 a2
Since Var[V1 ] = a2
3n2
, and E[So−1 ] = a(o−1)
n , we obtain
a2 2(o − 1) 1
Var(Vo ) = 2
1 − + E[So−1
2
]. (5)
3(n − o + 1) n 3(n − o + 1)2
Combining Equations 4 and 5, we have
1
Var(Vo+1 ) = 1 + Var(Vo ).
3(n − o)2
Therefore, we know 1 < o < n:
o−1 o−1
Y 1 a2 Y 1
Var(Vo ) = Var(V1 ) 1+ = 1 + . (6)
3(n − k)2 3n2 3(n − k)2
k=1 k=1
For o = n, because the last two recipients split the surplus uniformly at random, Vn−1 and Vn
are identically distributed. Therefore,
n−2
a2 Y 1
Var(Vn ) = Var(Vn−1 ) = 1 + .
3n2 3(n − k)2
k=1
In summary,
0 n = 1 and o = n
Var(Vo ) = a2 Qo−1 1 (7)
3n2 k=1 1 + 3(n−k)2 n > 1 and o < n
a22 Qn−2 1 +
1
n > 1 and o = n
3n k=1 3(n−k)2
Furthermore, the variance increases with o when o < n.
26A.3 Additional Analyses
A.3.1 Sample selection
Threshold selection
First, we illustrate the selection process of a spontaneous red packet (circled in Figure A.1). If the
interval of two consecutive red packets is greater than τ , we divide these two red packets into two
“sessions.” Therefore, in each session, the time interval between any two consecutive red packets is
less than τ .
We use 24 hours for our timeframe in the main analyses because a red packet expires within
24 hours after being sent. To examine the sensitivity of our results to the selection of a 24-hour
window, we also select 6, 12, and 48 hours and re-run our analyses; their respective treatment effects
are shown in Figure A.2. We find similar results for a 48-hour time window, and a slightly smaller
treatment effect for a 6- or 12-hour time windows.
Gambling and unnamed groups
To explore the impact of our filtering process on our results, we re-run regressions focusing on
gambling groups, in which group names indicate red packet games or gambling, and unnamed
groups with funtions that are unclear. The results in Figure A.3 show that the filtered groups
appear to have a higher marginal effect. These results suggest that filtering out these gambling
groups may have helped us obtain a more accurate understanding of gift contagion.
A.3.2 Additional results
A.3.2.1 Alternatives for the econometric model
Linear specifications in regressions
If we apply a linear specification for the effect of the three-dimensional vector — the total amount
of the red packet (Ar ), the number of recipients (Nr ), and the order of receiving time (Oir ). We
have the following regression:
Ygir = βTgir + γ1 Ar + γ2 Nr + γ3 Oir + gir . (8)
As shown in Figure A.4, the regression results suggest a much larger marginal effect than the
27You can also read