PLAY COMMUNICATIONS CAPITAL MARKETS DAY 2018 - SUSTAINABLE EBITDA GROWTH THROUGH MOBILE-CENTRIC CONVERGENCE

Page created by Nancy Burton
 
CONTINUE READING
PLAY COMMUNICATIONS CAPITAL MARKETS DAY 2018 - SUSTAINABLE EBITDA GROWTH THROUGH MOBILE-CENTRIC CONVERGENCE
PLAY COMMUNICATIONS
     SUSTAINABLE EBITDA GROWTH THROUGH
            MOBILE-CENTRIC CONVERGENCE

              CAPITAL MARKETS DAY 2018

                                         1
PLAY COMMUNICATIONS CAPITAL MARKETS DAY 2018 - SUSTAINABLE EBITDA GROWTH THROUGH MOBILE-CENTRIC CONVERGENCE
This presentation has been prepared by PLAY Communications S.A.’s and its subsidiaries                      Forward Looking Statements
    (together the “PLAY Group”). The information contained in this presentation is for information              This presentation contains forward looking statements. Examples of these forward
    purposes only. This presentation does not constitute or form part of and should not be construed            looking statements include, but are not limited to statements of plans, objectives or goals
    as an offer to sell or issue or the solicitation of an offer to buy or acquire interests or securities of   and statements of assumptions underlying those statements. Words such as “may”,
    PLAY Group companies or affiliates in any jurisdiction or an inducement to enter into investment            “will”, “expect”, “intend”, “plan”, “estimate”, “anticipate”, “believe”, “continue”, “probability”,
    activity. No part of this presentation, nor the fact of its distribution, should form the basis of, or      “risk” and other similar words are intended to identify forward looking statements but are
    be relied on in connection with, any contract or commitment or investment decision whatsoever.              not the exclusive means of identifying those statements. By their very nature, forward
                                                                                                                looking statements involve inherent risks and uncertainties, both general and specific,
    Certain financial data included in the presentation are “non-IFRS financial measures.” These non-           and risks exist that such predictions, forecasts, projections and other forward looking
    IFRS financial measures may not be comparable to similarly titled measures presented by other               statements will not be achieved. A number of important factors could cause our actual
    entities, nor should they be construed as an alternative to other financial measures determined in          results to differ materially from the plans, objectives, expectations, estimates and
    accordance with International Financial Reporting Standards. Although PLAY Group believes                   intentions expressed in such forward looking statements. Past performance of PLAY
    these non-IFRS financial measures provide useful information to users in measuring the financial            Group cannot be relied on as a guide to future performance. Forward looking statements
    performance and condition of its business, users are cautioned not to place undue reliance on               speak only as at the date of this presentation. PLAY Group expressly disclaims any
    any non-IFRS financial measures and ratios included in this presentation. Financial data are                obligations or undertaking to release any update of, or revisions to, any forward looking
    presented in zloty rounded to the nearest thousand. Therefore, discrepancies in the tables                  statements in this presentation, except as required by applicable law or regulation. No
    between totals and the sums of the amounts listed may occur due to such rounding. The figures               statement in this presentation is intended to be a profit forecast. As such, undue reliance
    included in this press release are unaudited.                                                               should not be placed on any forward looking statement.

2
PLAY COMMUNICATIONS CAPITAL MARKETS DAY 2018 - SUSTAINABLE EBITDA GROWTH THROUGH MOBILE-CENTRIC CONVERGENCE
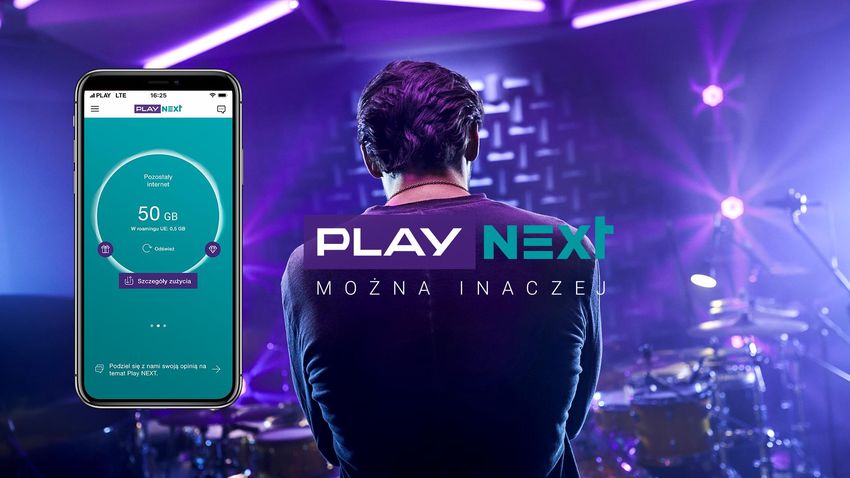
PLAY capital markets day agenda

      Time    Topic                                                                              Presenter

      12:30   PLAY TODAY: Leader with a challenger mindset
      13:00   PLAY 2022 AMBITION: Sustainable EBITDA growth through mobile-centric convergence   Jean-Marc Harion
      13:20   MARKET CONTEXT: Favourable conditions
      14:00   PLAY STRATEGIC PLAN: Three pillars for sustainable EBITDA growth
                   • Leading in mobile-centric convergence                                       Michał Sobolewski
                   • First in digital                                                            Michał Wawrzynowicz
                   • Lean and 5G-ready network                                                   Wojciech Danieluk
                                                                                                 Michał Ziółkowski

      14:45   FINANCIAL OUTLOOK: Sustainable EBITDA growth & shareholder distribution            Holger Püchert
      15:00   PLAY 2022: Summary                                                                 Jean-Marc Harion
      15:10   Q&A Session
      15:40   Demos of new product launches & reception

3
PLAY COMMUNICATIONS CAPITAL MARKETS DAY 2018 - SUSTAINABLE EBITDA GROWTH THROUGH MOBILE-CENTRIC CONVERGENCE
PLAY TODAY:
    Leader with
    a challenger mindset

    Jean-Marc Harion
    Chief Executive Officer

4
PLAY COMMUNICATIONS CAPITAL MARKETS DAY 2018 - SUSTAINABLE EBITDA GROWTH THROUGH MOBILE-CENTRIC CONVERGENCE
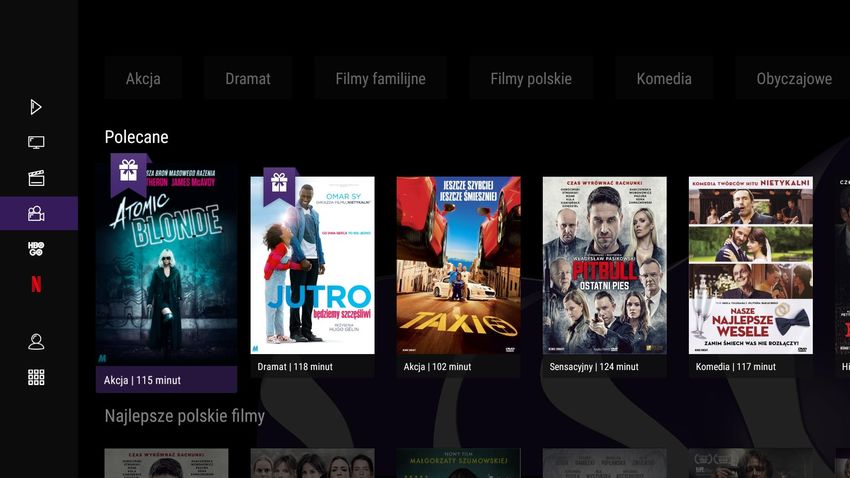
What we want for PLAY in 2019-2022

     Consolidate PLAY into a strong,
                                                                                  EBITDA GROWTH
     digital and efficient mobile-centric
     telco leader for families and small
                                                                                CASH CONVERSION
     businesses.

                                                                               CASH CAPEX / REVENUE
     Pave the way to 5G by launching
     new generation broadband Internet
                                                                                 NET DEBT / EBITDA
     and TV services.

    Note: Above guidance does not account for extraordinary spectrum outlays

5
PLAY COMMUNICATIONS CAPITAL MARKETS DAY 2018 - SUSTAINABLE EBITDA GROWTH THROUGH MOBILE-CENTRIC CONVERGENCE
PLAY team today

       Jacek            Michał             Michał          Jean-Marc           Holger            Michał             Wojciech
    Niewęgłowski     Wawrzynowicz        Sobolewski          Harion            Püchert         Ziółkowski           Danieluk

    Chief Strategy   Chief Commercial   Chief Marketing   Chief Executive   Chief Financial   Chief Technical    Chief Information
       Officer             Officer          Officer           Officer           Officer           Officer       and Transformation
                                                                                                                      Officer

6
PLAY COMMUNICATIONS CAPITAL MARKETS DAY 2018 - SUSTAINABLE EBITDA GROWTH THROUGH MOBILE-CENTRIC CONVERGENCE
CEO VIEW: PLAY’s 3Cs

              CHALLENGER
               MINDSET                      CUSTOMER-
                                             OBSESSED                                 COST-
        • Exceptional success story                                                 CONSCIOUS
          in European telecoms
                                      • High customer service satisfaction
        • Entrepreneurial Spirit:
          self-starters making        • NPS-linked bonus schemes             • One technology platform,
          agile decisions               for every employee                     continuous improvement
                                                                               of processes & offers

                                                                             • Highly automated and
                                                                               streamlined business

7
PLAY COMMUNICATIONS CAPITAL MARKETS DAY 2018 - SUSTAINABLE EBITDA GROWTH THROUGH MOBILE-CENTRIC CONVERGENCE
PLAY is in a position of strength

                           #1                                                                                   #1                                                                                 #1
               COST-EFFICIENT                                                                         POLAND’S                                                                             COMMERCIAL
              OPERATING MODEL                                                                      MOBILE OPERATOR                                                                         EXCELLENCE

      •     IT Spend (OPEX+CAPEX)                                              •    Largest share of the mobile market (by customers) 2
                                                                                                                                                                              •     Most extensive operator
            /Revenue below 2%1                                                                                                                                                      controlled shop network 5
                                                                                        •     >30% of market share in B2C postpaid
      •     CAPEX / Revenue at 10%1,                                                                                                                                          •     Most online visitors 6
            below telecom peers                                                         •     ~40% of businesses 3
                                                                                                                                                                              •     The most recognised brand
                                                                               •    Highest Net Promoter Score among telecom
                                                                                                                                                                                    in its category in Poland 7
                                                                                    operators in Poland 4

    Source: 1 – PLAY Communications Annual Report’ 2017; 2 – Operators & internal segment estimates; 3 – Share of businesses which have purchased at least 1 service from PLAY, market research commissioned by PLAY
    4 - NPS study,Q3'18 n=4750; 5 – Operators’ websites Sep’18; 6 - SimilarWeb Sep’18; 7 - Brand Image Tracking Study Q3'18, n=850;

8
PLAY COMMUNICATIONS CAPITAL MARKETS DAY 2018 - SUSTAINABLE EBITDA GROWTH THROUGH MOBILE-CENTRIC CONVERGENCE
Lean by design operating model                                                                                                                   Relevant European benchmarks 2

                                     STRICT COST DISCIPLINE &
                                                                                                                                 EFFECTIVE TECHNOLOGY ADOPTION
                                     OPERATIONAL EFFICIENCY
                                            Adj. EBITDA margin (%)                                                                    Cash CAPEX1 / Revenue (%)
                                                                                                                                                                           Peer median
                                                                                                                                                                           13% 2
                                        33%           33%           34%           32%                                          10%                      10%        10%
                          31%
                                                                                             Peer median                              8%       8%
                                                                                             30% 2

                          2014          2015          2016          2017        Q3 YTD                                         2014   2015    2016      2017      Q3 YTD
                                                                                 2018                                                                              2018

                                                                          A leader in operational efficiency among peers

    1 – CAPEX excl. cash outflows in relation to frequency reservation acquisition
    2 – Median for five European peers: Elisa, Illiad, Vodafone, Tele2, Telefonica Deutschland in 2017 based on Company Data

    Source: PLAY, Operators

9
PLAY COMMUNICATIONS CAPITAL MARKETS DAY 2018 - SUSTAINABLE EBITDA GROWTH THROUGH MOBILE-CENTRIC CONVERGENCE
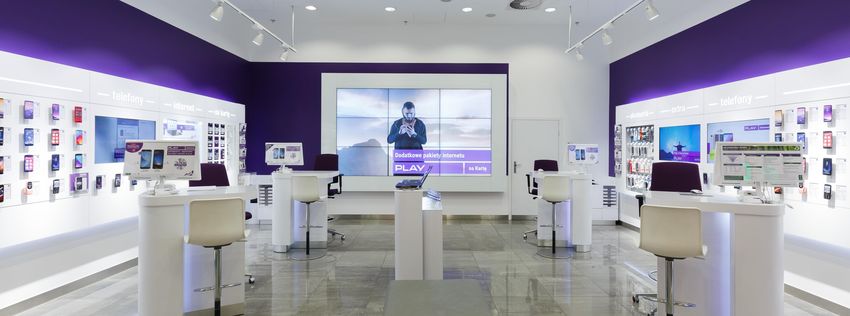
Commercial excellence in distribution

                                             WIDEST FOOTPRINT …                             … AND ONLINE PRESENCE

                           Shops owned or controlled by the operator (Q3’18) 1               Total website visits (M, Sep’18) 2

                            805                                                      19.7
                                              ~740              ~720     ~655                   14.6          14.1          15.3

                           PLAY             Orange               Plus   T-Mobile     PLAY      Orange         Plus        T-Mobile
                                                                 (CP)                                         (CP)

                   Evidenced by the most mobile number transfers from other operators and the largest number of mobile customers

     Source: 1 – Operators’ websites Sep’18; 2 - SimilarWeb Sep’18

10
Well-recognised and established brand
                                                                                                                                  MOST IMPACTFUL MARKETING CAMPAIGNS WITH
                    MOST RECOGNISED & VALUABLE TELECOM BRAND 2                                                                  EFFICIENT SPEND & LOW GRPS COMPARED TO PEERS 2,7

                                  Top-of-mind brand (% respondents, Q3’18)                                                       Top-of-mind (most recalled) advertising (% respondents, Q3’18)

                                                                                                                                             39
                               33
                                                  23                                                                                                                               20
                                                                     19
                                                                                       14                                                                       12                                    10

                             PLAY              Orange              Plus            T-Mobile                                                PLAY              Orange               Plus           T-Mobile
                                                                   (CP)                                                                                                           (CP)

                • Most valuable telecom brand 3                                                                               • Highest social media following (Facebook, Instagram, YouTube) 5
                • Favourite telecom brand 4                                                                                   • Top in influencer marketing (incl. 15 influencers with >1M followers) 6

                                                                                 Making Play the mobile operator of choice

     Source: 2 - Brand Image Tracking Study Q3'18, n=850; 3 - Rzeczpospolita ranking for the most valuable brands, Feb 2018, PLAY also ranked #4 most valuable brand in Poland; 4 – Index composed from a direct question
     “which brand is your favourite” and results on 6 different image components, Brand Image Tracking Study Q3'18, n=850; 5 – Operators’ social media channels; 6 – influencers’ reach measured by number of subscribers on
     YouTube channels; 7 – Gross Rating Points, GRP estimates by Kantar Media

11
Top brand with best value for money
                                                           WHICH BRAND IN YOUR VIEW OFFERS THE BEST VALUE FOR MONEY?

                                                   More content                               More data for the                                         Best price guarantee
              50                                 for the same price                             same price                                               of select handsets

              45
              40
              35
              30
              25
              20
              15
              10
               5
               0
                Q1’15                                                Q1’16                                                Q1’17                 Q1’18          Q3’18

                                                                                          Orange            Plus         Play        T-Mobile

     Source: Brand Image Tracking Studies, change of methodology since Q1’2018. Half of the sample conducted on-line since Q1’2018

12
2022 AMBITION:
     Sustainable EBITDA growth
     thanks to mobile-centric
     convergence

     Jean-Marc Harion
     Chief Executive Officer

13
A new chapter of the PLAY growth story

                               NEW ENTRANT                     CONTENDER                #1              LEADER

            STRATEGIC            Build scale            Focus on ‘families’ offer          Mobile-centric convergence:
               FOCUS                                                                     Grow value around ‘families’ offer

               MARKET
             SHARE, % 1      0% -15%                    15% – 28%                                    >28%
                YEARS            2007-2011                         2012-2017                          From 2018

             OFFER
      DEVELOPMENT
                            24h MNP      Unlimited    Unlimited      Family    Duet          Generation Unlimited Unlimited
                                          on-net     on-&off-net      offers   offers          offers    OTT TV Broadband

     Source: 1- GUS, PLAY

14
Mobile-centric convergence

               FIXED MOBILE CONVERGENCE (FMC):
               SEVERAL TECHNOLOGY PLATFORMS                                                                                                                                      CONVENIENCE
                                                                                                                                                       FMC: Household-centric services
                                                                                                                                                       MCC: Services available anytime & anywhere for
             Internet:              TV:              Mobile              Fixed
               xDSL,           IP, DOCSIS,            voice:             voice:                                                                        individual and household needs
            FTTH, HFC              DTH               2G-LTE           ISDN/PSTN
                                                                                                                                                                                  AVAILABILITY
                                                                                                                                                       FMC: Only ~55% of households covered by FMC
                                             VS.                                                                                                       infrastructure in Poland 2
            MOBILE-CENTRIC CONVERGENCE (MCC):                                                                                                          MCC: ~100% of households
                   ONE MOBILE PLATFORM                                                                                                                 & individuals have access to MCC offers

                                                                                                                                                                            BUNDLE DISCOUNTS
             Internet:            TV:                Mobile               Fixed
                                Network-              voice:             voice: 1                                                                      FMC: Typically 30-40% discount to drive uptake;
                LTE             agnostic             2G-LTE              2G-LTE                                                                        Low prices in Poland give little space for discounts 3
                                                                                                                                                       MCC: A la carte offers requiring lower discounting

     Note/source: 1 – Service offered as Fixed-Mobile Substitution (FMS); 2 - UKE, 2017; 3 – Combined fixed + mobile ARPU as % of real expenditure per capita: Poland 1%, EU average 1.6%, Analysis Mason, Ovum, Eurostat, ADL

15
Mobile bundles straddle all product lines

                                                     Mobile Telephony                                         Fixed-line     Internet Access        Bundled Services        Total telecom
                                                      (Smartphone)                                            Telephony       (Mobile, Fixed)      (Mobile, Fixed, TV)         market

                  Market
               Revenue,                                         15.0                                               2.3              4.7                    4.7                26.7 bn
            2017, bn PLN

                                                                                                               Including
                                                                                                                 fixed-
                                                                                                                mobile
                                                                                                              substitution
                                                         100% penetration                                                                            60% share of pure
                                                                                                                                 51% share          mobile-voice & mobile
                                                                                                                              of mobile internet      Internet bundles

                                                                                        MOBILE-CENTRIC CONVERGENCE

                                                              Mobile-centric convergence is the way forward for value creation

     Note: PayTV not included, pie charts show dominant technology / combination of technologies in volume terms
     Source: UKE-Report on the state of the telecommunications market in Poland 2017

16                                                                                                                                                                                          16
PLAY: sustainable EBITDA growth through mobile-centric convergence
                                                         SUSTAINABLE EBITDA GROWTH & SHAREHOLDER RETURN

                      FIRST IN DIGITAL                           LEADING IN MOBILE-CENTRIC CONVERGENCE               LEAN & 5G-READY NETWORK

                Superior customer service                                                                                Own efficient network
             & efficient back-office processes               Individuals              Families & small businesses     designed for high capacity...

                                                              More-for-more           Mobile service penetration
                   Excellent cross-channel
                                                              Devices1                Internet service provider     ….ready for future 5G roll-out
                    customer experience
                                                              Value-added services    PLAY Now TV

                                                              COST-EFFICIENT                    COMMERCIAL
                                                             OPERATING MODEL                    EXCELLENCE
     1 – with related services and dedicated financing

17
Nine objectives to deliver PLAY 2019-22 ambition
                                                         SUSTAINABLE EBITDA GROWTH & SHAREHOLDER RETURN

                      FIRST IN DIGITAL                           LEADING IN MOBILE-CENTRIC CONVERGENCE                     LEAN & 5G-READY NETWORK
                                                                                  More-for-more
                                                              Individuals                   Families & small businesses
          • Shops productivity improved                      • Drive usage revenue         • Become #3 Internet           • Switch-off National Roaming
              and calls reduced by 20%                         consistently                   service provider (ISP)        in 2022

          • 30% remote retentions                            • Sell >2M devices            • Bring next generation        • Cash CAPEX / revenue
          • 70% Play24 users in postpaid                       a year                         TV to the Big Screen          back to
MARKET CONTEXT:
     Favourable conditions

     Jean-Marc Harion
     Chief Executive Officer

19                             19
Favourable macro environment for PLAY

                                                                     ONE OF THE TOP 5 BEST PERFORMING OECD ECONOMIES 1

            POLAND upgraded to a                                Record low                               Strong household      GDP         Moderate
                 developed                                    unemployment                                 consumption        growth       inflation
               market status 2
                                                                5.7%                                       +4.9%            +5.1%          2.0%
                                                                   in Sep’18                                 YOY in Q2’18   YOY in Q2’18   in Q3’18

     Note/source: 1 – Poland ranked #5 in real GDP growth over 2014-17, OECD; 2 – FTSE Russell, Other data: GUS

20                                                                                                                                                     20
Families are central to Polish society
                                                  NUMBER OF HOUSEHOLDS                                           INCOMES ON THE RISE
                                                         IS GROWING 1                                         (ESP. FOR LARGE FAMILIES’) 3
                                                  Polish households, millions                                       Disposable income
                                                                                                                per capita per month, PLN

                                                         Not accounting for additional                                                   2136
                                                         1-2m families of immigrants2                             2049        2078

                                                                                                                                         1549
                                                                                                                              1368
                                                                                         15.0                     1267                   1194
                                                 13.6                    14.1
                                                                                                                              1051
                                                                                                                  839

                                            2011                        2016             2025E                    2015        2016       2017

                                                                    Very favourable conditions for PLAY as a leading family brand
     Source: 1 – GUS; 2- According to money.pl and Eurostat; 3 - GUS, Polityka Insight

21                                                                                                                                              21
SMEs drive economic growth in Poland
                                         ENTERPRISE GROWTH IS FUELLED                                                            MOST EMPLOYEES WORK FOR SMEs
                                             BY SMALL BUSINESSES 1
                                           Active enterprises, thousands
                                               Micro          Small           Medium

                                                                              2050

                                                          1914                1973
                                                                                                  2074
                                                                                                                                                 ~70%
                                      1843                1838                                                                          employed by SMEs, 2016 2
                                      1765
                                        59                  57                  57                 n.a.
                                                16                  16                  15
                                        3                   3                   4
                                      2014                2015                2016                2017

                                                          PLAY serves as a single platform for all connectivity needs of SMEs

     Source: 1- GUS, PARP, 2 –GUS, PARP: SME employees as % of total workforce employed in the enterprise sector (employment contract i.e. excluding civil code contracts)

22                                                                                                                                                                           22
Stable & healthy telecom market in Poland

                                                              STABLE MARKET SEGMENTS WITH LOW-SINGLE DIGIT GROWTH 1

                        Mobile dominates                                   Fixed market –                                      Stable pay-TV market 4                              Mobile market –
                        telecom market 2                               competition remains fierce:                                                                            low prices prevent further

                           >50%                                                   >50%                                               +1-2%                                competition as customers choose
                                                                                                                                                                            by service quality, not by price
                                                                                                                              In revenue p.a. `13-`18,
                        In revenue terms                                 households with access                               evolution of technology
                                                                              to 3+ ISPs 3                                   and consumer behaviour

     Source: 1 – Audytel forecasts telecom market growth of 0.7% in 2018, as quoted by rpkom.pl article; 2 – Analysys Mason: Mobile service revenue share in combined mobile, fixed and TV markets; 3
     - UKE/Datawise, own analysis; 4 – MSP Economic Journal after PAP, PMR, and PwC, accessed Nov 12, 2018
23                                                                                                                                                                                                             23
Mobile postpaid market has stabilised with PLAY as #1

                                                 SUBDUED SWITCHING BETWEEN OPERATORS
                                                          Number porting per operator
                                                              SIMs, thousands
                200

                150

                100                                                                                                         100 thsd / quarter

                 50
                   Q1’17        Q2’17           Q3’17               Q4’17                Q1’18         Q2’18        Q3’18

                                                   Play    Orange       Cyfrowy Polsat      T-Mobile

                                 Balanced mobile market with right conditions for the ‘more-for-more’ proposition

     Source: UKE MNP database

24
Prepaid market driven by SIM registration & increased immigration
                                                                                      STABILISED VOLUMES IN PREPAID MARKET
                                                                                                             SIMs, millions
                                                                                                         (by Analysys Mason)

                        Introduction of
                        obligatory prepaid registration                                                                            Market stabilisation

                      22.9
                                                                            19.7
                                                                                                                                 17.1                       16.8
                                                                                                                                                                                 Two balancing market forces
                                                                                                                                                                                 going forward: prepaid to postpaid
                                                                                                                                                                                 migration vs. constant influx of
                                                                                                                                                                                 immigrants (0.7 million per year 2)
                     Q4’15                                                 Q4’16                                                Q4’17                      Q2’18

                                                              PLAY’s market share has reached 32% in Q2’18 (+6% pts since Q4’15) 3

     Note/source: 1 – For the sake of comparability, Analysys Mason uses proprietary adjustments for 3 months activity. Therefore data may differ from officially reported prepaid customer databases;
     2 - Poland issued ~700k residence permits, incl. ~600k work related permits in 2017, ~60% of the EU total, Eurostat News release, 25 October 2018; 3 – Based on Analysys Mason view of prepaid market

25
The rise of mobile connected consumer in Poland supports our strategy

                                                                                                                                                                                                4.5GB
                                                                      64%                                                            60-65%                                                          data traffic
                                                                                                                                                                                                per user per month 4
                                                                                                                                     Of overall data traffic

           78%
                                                                      Smartphone                                                     is on mobile phones 3
                                                                      penetration 2

             Internet
           penetration 1

     Note: All penetration figures relate to the total population of Poland
     Source: 1 – IWS, Dec’17; 2 – Newzoo, Oct’18; 3 – StatCounter, Jun-Oct’18; 4 - Analysys Mason: Total cellular data traffic per active mobile connection (excluding M2M) per month in 2018

26                                                                                                                                                                                                                     26
Ongoing mobile data traffic growth, driven by video consumption

                           MOBILE DATA TRAFFIC GROWTH IN POLAND                                        OPPORTUNITY FOR PLAY
                                        Exabytes (EB)
                                                         x5.1
                                                                            8.9
                                                                                               1. Own network will assure fixed
                                                                      6.9                         network production costs
                                                                5.4
                                                                                               2. New monetisation opportunities:
                                                   4.0                                             • Data upsell
                                x3.1         2.8                                                   • Content monetisation
                                       1.7                                                             through PLAY NOW TV
                                1.1
                     0.6

                    2015        2016   2017 2018E 2019E 2020E 2021E 2022E

                              PLAY will capitalise on both strong data traffic growth and underlying video consumption growth trends

     Source: Analysys Mason

27
High population dispersion supports mobile-centric convergence
                                  DUE TO HIGH POPULATION DISPERSION 1 …                                                     …MOBILE BROADBAND REMAINS THE MOST
                                                                                                                              POPULAR WAY OF GETTING ONLINE2
                                             Population distribution by density                                                    Internet access by technology
                                                         %, 2014                                                                            %, 2016-2017

                                                                                                                                14.5        14.5
                                                                                                                                                       100%
                                                                                                                                9.5%        8.8%
                                                                              29%                                              17.2%        16.0%
                                                           51%                                                                  3.6%         5.2%         Access
                                       75%                                                                                     18.6%        18.9%         technology
                                                                                                                                                               Other
                                                                                              Population                                                       xDSL
                                                                              71%
                                                                                              density                          51.1%        51.2%              FTTH
                                                           49%
                                                                                                 >200                                                          CaTV
                                       25%
Mobile broadband is a preferred option for nearly half of Polish households
                                                                   ~45% OF HOUSEHOLDS HAVE NO ACCESS
                                                                OR ARE PASSED BY LOW-SPEED FIXED INTERNET
               Population (M)                  9.1                      4.7         3.6      4.6      2.1        7.8              6.6         ∑ = 38.4

               Households / HH (M)             3.7                      1.7          1.2     1.5      0.7        2.1              1.8         ∑ = 12.8
                                                      2%                      2%     3%      4%       5%         10%              11%
                                        14%                                                                                                  No internet
                                                                  21%
                                                                                    31%
                                                                                            43%      48%
                                                                                                                 64%                         Low speed
                                                                                                                                  69%
                                                                                                                                             (ADSL, radio links)
                                               84%                  77%             66%
                                                                                            53%      47%                                     High speed
                                                                                                                 26%              20%        (VDSL, FTTH, DOCSIS)
                                               City                 Large          Medium   Small Suburban       Rural           Rural
                                              centers               towns           towns   towns city areas   - wealthy         - poor
                                               MAIN AREAS FOR
                                                FIBER ROLLOUT                                                              Main target market for PLAY broadband

                                   Mobile broadband is a viable alternative in areas with poor fixed broadband connections, but not only

     Source: Datawise, UKE, 2017
29
Overcapacity in fixed broadband market in urban areas
                 AVAILABLE FIXED ISPs BY AREA TYPE (ISPS) 1                                                         NETWORK COVERAGE AND FIXED BROADBAND ROLL-OUT PLANS 2
                           % of total householdss                                                                              Households passed (million), 2017

                              3.7                  5.2               Households (million)                       Orange (FTTH)                      90%                                    5.0
                             4% 2%                          3%                                                       UPC Polska                                57%         3.3
                              12%                  10%

                                                   25%                                                               Netia (B2C)                       64%           2.5

                                                                                                                            Vectra                     62%           2.5

                               82%                                          No Internet                    Multimedia Polska                     56%     1.7
                                                   62%                      1 Operator
                                                                                                                              INEA   50%               1.5
                                                                            2 Operators
                                                                            3+ Operators                                   Nexera          0.5                  Households Connected
                                                                                                                                                                Households not-connected (% of covered)
                          City centres           Towns
                                                                                                                             TOYA    55% 0.4                    Announced roll-out plans until 2022

                   PLAY may opportunistically consider wholesale access options in mid-term to complete its mobile network locally

     Source: 1 - Datawise, UKE 2017; 2 - TeleKabel & Digital TV: Liderzy rynku kablowego w Polsce, luty 2018, Company information

30
TV and video consumption is shifting from push to pull

                                            DO YOU USE ANY OF THE FOLLOWING          HALF OF TRADITIONAL TV VIEWERS
                                                       SERVICES? 1                       ARE READY TO SWITCH 1
                                                           %                            Propensity to give up each,
                                                                                             % of respondents
                                                     Streaming      Traditional TV

                                                   96%           96%           94%

                                                                         61%
                                                                                                     24%
                                                           49%
                                           42%

                                                                                                    50%
                                              2016           2017          2018

     Sources: 1 - Nielsen Audience Media, own research

31
Poland is spending more and more time online
                                                                                                                       Digital

                                                                                                                       6%

                           LEISURE TIME SPENT                                                                                    40%
                           USING DIGIGAL AND                                          43%
                                                                     57%
                          TRADITIONAL DEVICES                                                                    54%

              4h48m 5h18m
                        2016                 2017                        Digital (PC, Smartphone, Tablet)         PC

                                     3h in Digital world                 Traditional (TV, press)                  Smartphone
                                                                                                                  Tablet

                                        PLAY smartphones, data and TV services sales benefit from these trends

     Source: Polska jest Mobi 2018

32
PLAY strategy is fully aligned with market dynamics

                       MARKET DYNAMICS                                                PLAY’S RESPONSE

          •   Growth in number of households & SMEs                  •   Attract more Families & SMEs

          •   Stable competition in the mobile market                •   Sell new services through the ‘more-for-more’ proposition

          •   Structural difficulties for fixed broadband roll-out   •   Accelerate mobile broadband push

          •   Changing video consumption patterns                    •   Introduce next generation TV

33
THREE PILLARS FOR
     SUSTAINABLE EBITDA
     GROWTH:
     Leading in mobile-centric
     convergence

     Michał Sobolewski
     Chief Marketing Officer

34                               34
PLAY bundling strategy for families & SMEs
                                    MOBILE PLATFORM FOR ALL TYPES OF BUNDLES 1                                                                                     LEADING IN BUNDLING 2
                                                                      Q3’18                                                                                      Number of bundled services
                                                                                                                                                                        2017, UKE
                                   Individuals                                   Families & Small Businesses
                 Mobile services
                                                                             Internet                                                                           PLAY                   52%

                                                                                                                                                             CP Group        13%
                    Addressing all connectivity needs
                                                                             Next generation TV                                                               Orange         12%

                                                                                                                                                                 UPC         9%
                 Value-added services                                        Fixed voice substitution
                                                                                                                                                               Vectra   5%
                 Devices                                                  Broadest selection, financing options
                                                                                                                                                             T-Mobile   2%
                  ~3.9 M BUNDLED CUSTOMERS                                     56% BUNDLED CONTRACT BASE
                        ~3.1 M individuals                                            49% individuals
                       ~0.8 M companies                                              68% companies

     Source: 1 – PLAY, 2 - UKE-Report on the state of the telecommunications market in Poland 2017; CP Group comprises Polkomtel, Cyfrowy Polsat and Netia

35                                                                                                                                                                                            35
Ongoing monetisation of data with ‘more-for-more’ services
                                    OFFER DESIGN HAS STRONG                                        FUELLED BY SUSTAINABLE
                                   MORE-FOR-MORE COMPONENTS                                           VOLUME GROWTH

                                                                                             Inflow of customers from other operators
                                                                                                   (via mobile number portability)

                          Data:10GB                           Data: 30GB
                    Content: Showmax, Tidal                Content: Showmax,                      Prepaid to postpaid migration
                                                            Tidal & HBO GO
                    SHARE OF L TARIFF
                                                                                                           New segments
                    % in acquisition, ex. data tariffs
                                                                                                (e.g., seniors and rural population)

                                                  ~ 4x
                                                                                                  PLAY NEXT for digital natives

                                  Sep’17                     Sep’18

                                              Current offers encourage customers to buy higher tier services
     Source: PLAY

36                                                                                                                                      36
Effective upselling of value-added services

                                                                    Also sold as standalone product
                                                                                                             PLAY 360° OR SCREEN PROTECTION INSURANCE
                                                                                                                  SHARE IN FIXED-TERM CONTRACTS 1
                                                                         SCREEN PROTECTION
                                                                                                                                Q3’18
                                                                         INSURANCE

              EXCEPTIONAL
                                                                         Internet protection insurance

                                                                            POPULAR APPS
                                                                                                                            ~70%
              SERVICE                                                                                        New and retained handset contracts
              Priority customer
                                                               E-book | Audiobook | Navigation
              service

                 OTHER CONTENT
                 Basic TV + packages by interest                                      Premium services
                                                                                                                 Free in                  Free-to-test
                                                                                                              the package             (then paid service)

     Source: 1 – PLAY – channels POS & Direct, terminal contracts eligible for PLAY360 / Screen Protection

37                                                                                                                                                          37
Grow PLAY’s share in the device sales market

                      SMARTPHONE SALES 1                                                               AMBITION                                                        PLAY WINNING FACTORS
                         M units, 2017
                             8.8

                                                                                                                                                          • Broadest device portfolio
                            ~4.4
                                               Operator                            Maintain leadership in handset sales                                   • Superior customer service
                                               market                                 to grow profit per customer
                                                                                                                                                          • Largest handset distribution network

                                              Open                                          SIM-free handset sales                                        • Market prices
                            ~4.4                                                         to drive POS traffic, generate                                     & best price guarantee
                                              market                                    gross adds and higher margins                                     • Well-recognised retailer
                                                                                                                                                          • Best customer advice
                           2017

                                                 Leading in handset sales with the target of >2M sold annually from 2019

     Source: 1 – IDC reports total smartphones sales at 8.8M and mobile phone sales at 10.3M; the difference is made up by feature-phones; sales structure estimated by PLAY

38                                                                                                                                                                                                 38
To become a TOP 3 ISP in Poland with PLAY own nationwide network
                   TOP INTERNET SERVICE PROVIDERS IN 2017 1                                             MOBILE BROADBAND                                 NETBOX
                                   M RGUs                                                                INDOOR coverage                             OUTDOOR coverage

                                       Orange                                          4.6

                                  CP + Netia                                 3.2

                      Strong #3 in 2022                                                                 Convenient & often better                  Best connectivity in areas
                                                                                                          alternative to xDSL                    with poor fixed network quality
                                           UPC               1.1

                                     T-Mobile                1.0

                      #5                   Play              1.0                                                    Selective targeting based on:
                                                                                                                    • Network coverage and congestion
                                                         0.6                                                        • Propensity to buy
                                        Vectra
                                                                                                                    Cross-selling to current ‘families’ offer customers
                                 Multimedia            0.4                                                          following the network roll-out

     Source: 1 - UKE-Report on the state of the telecommunications market in Poland 2017, PLAY target

39                                                                                                                                                                                 39
PLAY NOW TV INTERFACE – MOODBOARD

     Source: PLAY
40                                        40
Driving value by bringing next generation TV to the Big Screen
                        BEST OF BOTH OTT TV                           …TO CREATE                                        CONTENT
                         & TRADITIONAL TV                          NEXT GENERATION TV
                                                                                                             ADD AS YOU GO: SVOD SERVICES

                    OTT TV                                     Designed for OTT TV first
                      • A la carte SVOD menu
                                                               Voice control
                                                                                                             ADD AS YOU GO: TV PACKAGES
                    Linear TV                                  Network-agnostic
                                                                                                             KIDS        SPORT       EXTRA
                      • ~27 DVB-T channels
                      • PLAY NOW has the most                  Easy to install
                        popular channels                                                                     PLAY NOW BOX: BASIC PACKAGE
                                                               Android platform expandable
                                                                                                              MOST POPULAR CHANNELS
                    Single monthly rental payment              to new platforms & services
                                                                                                                      DVBT CHANNELS

                                                                                                                      ~27 CHANNELS

                                         Free trials started with households moving to the next generation TV offer
                                                   at the time of their Cable/DTH pay-TV contract renewal
     Source: PLAY

41                                                                                                                                           41
PLAY NEXT

     Source: PLAY
42                  42
PLAY NEXT – fully digital, subscription-based offer

              for   45       ZŁ/month
                                             No contract                     JOIN VIA APP and get
                                                                            a SIM Card by courier or
                    Unlimited voice          Recurring payment                  in a PLAY shop
                    Unlimited text and MMS   Account managed via app               Available in:

                    50 GB                    24/7 customer service

                    EU package               Future-proof (eSIM-friendly)

                        THE ONLY MOBILE OPERATOR PROVIDING SERVICES VIA MOBILE APP

     Source: PLAY

43                                                                                                     43
THREE PILLARS FOR
     SUSTAINABLE EBITDA
     GROWTH:
     First in digital

     Michał Wawrzynowicz
     Chief Commercial Officer

     Wojciech Danieluk
     Chief Information
     and Transformation Officer

44                                44
Digital transformation of PLAY will boost distribution & back-office efficiency
                                                        Higher shop productivity
                                                       and lower number of calls

                                                                20%

                        Customers using
                                                                                               Acquisitions
                              e-invoices   80%                                         20%     via remote channels
                          & e-payments
                                                           PLAY
                                                           2022
                                                          DIGITAL
                                                         AMBITIONS
                      Contract customers                                                       Retentions
                                           70%                                        30%      via remote channels
                   using PLAY24 platform

                                                                50%
                                           Customer service transactions via remote channels

45                                                                                                                   45
Shops will increase productivity through digitization & new services

                                                                                            E-SIGNATURES in most
                                        Customer servicing through TABLETS                   contracts & customer                   HIGHER PRODUCTIVITY will allow to sell
                                          for an engaged sales experience                  services to reduce paper                 new product lines at stable cost per shop
                                                                                                     usage

                                                      Attracting ADDITIONAL TRAFFIC WITH
                                                                                                    ADVANCED IN-STORE TRAFFIC MONITORING
                                                   SIM-FREE HANDSETS OFFER with first in the
                                                                                                     for better customer service and efficiency
                                                         market 100% E-CREDIT PROCESS
      THE BROADEST DEVICE
     PORTFOLIO among Polish
       telecom operators 1

      Source: 1 - Operator websites, PLAY

46                                                                                                                                                                              46
Online sales for a smooth customer experience

                               MODERN E-COMMERCE                                  THE MOST VISITED WEBSITE 1
                                   PLATFORM                                         among telecoms networks
                                  Hybris by SAP                                    and electronic goods stores

                                    AI BASED FEATURES:                                               VARIOUS PICK-UP OPTIONS
                                                                 RETENTION PROCESSES
                               Personalized Content, Business                                   (e.g., shops, home, collection points)
                                                                   THROUGH E-SHOP
                              Event Prediction, Chatbot engine
     Source: 1 - SimilarWeb as of Sep’18

47                                                                                                                                       47
PLAY24 – mobile platform for online sales & service transactions

                                         3.4 M PLAY24 ACTIVE ACCOUNTS
                                         (website & app) – 70% of contract
                                            customers to use it by 2022
                                                                                     COMPREHENSIVE ACCOUNT MANAGEMENT
                                                                                     (e.g., payments & billing, top-ups, packages)

                     HIGHEST AWARENESS AND USAGE
                      of mobile app among telecoms1                                  NEW FEATURES: SALES & SERVICE

                                                                             •   Seamless retention with 1-click purchase options
                                                                             •   New e-contracts
                                                                             •   New handset recommendations
                                                                             •   Upselling driven by real-time marketing
                                                                             •   Recurring payments
                                                                             •   1-click adjustment of all offer features
                                                                             •   ...and many more

     Source: 1 - Segmentation study H1'18, n=1300

48                                                                                                                                   48
Moving customer requests from offline to online

                                                                INCOMING CALLS VS. P24 ACTIVE ACCOUNTS
                                                                              Q3’18 LTM

                                                                                                                             PLAY24 active accounts
                                                                                                                             +23% since Q3’17

                                                                                                                             Incoming call centre calls
                                                                                                                             -19% since Q3’17

                    Q3’17                           Q4’17                 Q1’18                 Q2’18                Q3’18

                                                            The tangible benefits of digitalisation are already visible

     Source: 1 - Segmentation study H1'18, n=1300

49                                                                                                                                                        49
Simplicity at the heart of PLAY since its inception

                                                           SIMPLICITY OF PLAY BUSINESS MODEL AND STREAMLINED OPERATIONS

                                               We are a ‘Smart follower’ when entering new segments

                                               Simple IT architecture based on single stack

                                               In-house CRM developed with local Polish software developers enabling cost effectiveness & agility

                                               We Simplify before we Digitise – meaning that total IT spending is efficient at 2%1 of revenue

                                                    Smoother digitalisation thanks to PLAY’s excellent execution track record

     Source: 1 - PLAY Communications Annual Report’ 2017

50                                                                                                                                                  50
Key focus areas for further PLAY digitalisation in 2019-21
                                             2019-21 DIGITALISATION ROADMAP

                    Online retention and customer service – prepare IT systems for transition

                    E-signature – wide adoption across most PLAY shops

                    Automated e-payments as default option for each signed contract

                    Real-Time Marketing to address real-time customers needs, drive upsell and improve retention

                    Big Data and Machine Learning models as source of insight for Real-Time Marketing

                    Selective launch of Robotic Process Automation (currently being piloted), chatbots

51                                                                                                                 51
THREE PILLARS FOR
     SUSTAINABLE EBITDA
     GROWTH:
     Lean and 5G-ready network

     Michał Ziółkowski
     Chief Technical Officer

52                               52
Ongoing roll-out of a highly efficient nationwide network

                                                          NATIONWIDE NETWORK ROLLOUT AND ITS IMPACT ON NATIONAL ROAMING
                                                                             Number of own sites on air

                                                                                                                               From 2022
                         % of data traffic
                         on own network 1 90%                   93%           94%          96%           97%          99%         100%
                                                                                                                                                    • Network grid optimized for
                                                                                                                                                      data services, not only for
                                                                                                                      9500                            voice coverage
                                                                                                        9000
                                                                                           8000
                                                                              7000
                                                   5137
                                                                 5746                                                                               • Modular site design with the
                                                                                                                                                      smallest footprint in Poland

                                                                                                                                                    • Highly efficient rollout factory
                                                   2016          2017         2018         2019         2020          2021

                                                                   Currently putting on air 1 new site every 4 hours (Oct’18)
     1 – As of end of period, only data on devices (e.g. smartphones), does not include PLAY Internet services which run 100% on PLAY own network
     Source: PLAY

53
Triple efficiency: in CAPEX, OPEX and utilisation
                    EFFICIENT CAPEX                                EFFICIENT OPEX                           EFFICIENT UTILISATION

        • Lightweight tower with capacity load         • Fenced sites                              • Antennas on light aluminium brackets
              – Cost-efficient civil engineering             – Optimal land lease & maintenance          – Efficient use of the capacity load

        • Typical tower height of 60m                  • Small cabinet                             • Passive site sharing with other MNOs
              – Efficient for low-band frequencies          – Low electricity cost (esp. AirCon)         – High tenancy ratio in some locations
              – Capacity for future network upgrades                                                     – 17.3% of shared sites in Nov. 2018

     Source: PLAY

54
PLAY own network speed has improved the most

                                                                  SPEED TEST RESULTS
                                                       Average mobile downlink speed of own network,
                                                                    Mbps, October 2018

                        change yoy    14%                     4%                      38%                   20%

                                      19.5                   19.4                      19.2
                                                                                                             16.6

                                     Orange                T-Mobile                   PLAY                   Plus
                                                                                                             (CP)

                            Faster speeds have been possible due to the accelerated roll-out of a modern nationwide network

     Source: Speedtest.pl

55
Aiming to switch off national roaming in 2022
                                                                   SWITCHING OFF NATIONAL ROAMING

                                                                                          • Play is set to reduce its dependency on
                                                                                            National Roaming with the Poznan area
                                                                                            first to be switched off

                                                                                          • PLAY will gradually switch from the
                                                                                            National Roaming variable cost model to its
                                                                                            own network fixed model, with significant
                                                                                            cost savings from 2020 onwards

                    Photo: Poznan area National Roaming switch off press release

                                                        Lower productions costs per GB will be achieved
     Source: PLAY

56
Reduced production costs per GB

                                                                          OPERATING COST PER GB CONSUMED IN THE NETWORK1
                                                                        PLN / GB, excludes Depreciation of infrastructure or spectrum

                                                                                                                    -74%

                                         GB cost

                                                          2017                   2018                   2019                   2020                    2021                   2022

                        PLAY will increase cost-efficiency by using its fully-owned network & maintaining network OPEX discipline

     1 – Including network related operating costs (esp. site rental costs, maintenance costs, overhead costs) and National Roaming costs, data traffic forecast in line with the market
     Source: PLAY
57
A pathway to 5G in Poland is emerging

                                              2018            2019              2020              2021              2022             2023              2024

                                       3GPP Release 15         3GPP Release 16         Spectrum refarming & reshuffling    5G spectrum auction
                                       “Level 1” standards     “Level 2” standards
            Technology                                                                 700 MHz    3.4 – 3.8 GHz 26GHz
            & spectrum                                                                                                                            5G commercial
             roadmap                                         First commercial        First mainstream            Emergence of Low Latency /           roll-out
                                                             trials                  5G smartphones              Massive IoT business models
                                                                                                                                                  Smart & efficient
             Regulatory                EMF harmonization to ICNIRP / WHO guidelines                                                              followers of global
                                                                                                                                                      operators
              roadmap

     Source: NOKIA, Ericsson, Huawei, Own analysis

58
Requirements for 5G: power density limits & spectrum availability

                                           ROADBLOCKS TO BE REMOVED TO MAKE 5G HAPPEN FOR ALL MOBILE OPERATORS IN POLAND

                                                       •      For full 5G each operator will need to use continuous 80-100MHz spectrum blocks
                      Spectrum                                  – 700 MHz                       – Allocated and occupied until 2025, with unresolved interference issues with Russia
                                                                – 3.4-3.8 GHz                   – Mostly allocated & occupied until 2020-25, highly fragmented (i.e. >1000 licenses)
                      Availability
                                                                – 26 GHz                        – Currently used for Micro Wave links, partially occupied by Ministry of Defence

                                                       •      Polish Power Density Limits (PDL) are a 100 times below established European standards (i.e. ICNIRP guidelines)
                         Power                         •      Under current PDLs it will be not possible to meet 5G requirements:
                         Density                               – Data growth                    - possible capacity crunch (esp. in urban areas)
                         Limits                                – Spectrum                       - cannot not be fully deployed already (esp. dense urban areas)
                                                               – 5G innovations                 - will be impossible (e.g. small cells, beamforming, massive MIMO)

                                  Legislative and regulatory changes are necessary for commercial 5G deployment in Poland

     Source: 5G Strategy for Poland by Ministry of Digitization

59
Mobile broadband may match FTTH on speed & beat on availability

                                                                               Today                                         2022+

                                                                                             4G                                            5G
                                                                  VDSL2                                        FTTH
                                                                                        LTE-Advanced                                    3500 MHz

                          Typical use rate                     20 – 100 Mbps            20 – 100 Mbps     100 – 1000+ Mbps           100 – 1000 Mbps

                       Maximum capacity 1                       >1TB/month             100-500 GB/month      1TB/month                 1TB/month

                                                                Copper line              Three-carrier                                 3.4-3.8 GHz
                       Deployment solution                                                                    Fibre line
4G LTE is fully capable of supporting PLAY 2022 goals
                               SIGNIFICANT FREE NETWORK CAPACITY                                     OUR NETWORK IS 5G-READY IN MANY RESPECTS
                                      TO GROW OUR SERVICES

                                                                     • >80% of PLAY sites                                     OPPORTUNISTIC LOCAL USE IN
                                                                       have capacity to
                                                                                                                              CASE OF CAPACITY CRUNCH
                                                                       support further traffic

                                                                     • Network capacity will      • We can roll-out 5G equipment on a ‘per site’ basis
                                                                       be further expanded
                                                                       with the ongoing roll-     • ~70% of existing sites have 5G-ready transmission (1+Gbps)
                                                                       out
                                                                                                  • All new Ericsson sites will be 5G-ready whilst Huawei sites
                                                                     • PLAY network grid was        are being gradually upgraded
                                                                       originally optimised for
                                                                       LTE and data (no           • First operator to fulfil 5G synchronisation requirements
                                                                       legacy inefficiencies)
                    Existing sites with significant spare capacity

                                   PLAY will implement 5G features opportunistically where it makes a difference for customers

     Source: PLAY

61
FINANCIAL OUTLOOK:
     Sustainable EBITDA growth
     & shareholder distribution

     Holger Püchert
     Chief Financial Officer

62                                62
2018 guidance status

                              9M 2018 Execution                                    FY 2018 Guidance                       Status
                                                                                                                               Confirmed
                                                                                                                   
                                  +2.1% growth                                       2 – 3% growth
         Revenue growth                                                                                                         ~2% yoy,
                            Driven by service revenue growth                    Driven by service revenue growth
                                                                                                                       driven by service revenue

                                    PLN 1.6bn
           Adj. EBITDA
                             74-77% of FY guidance range
                                                                            PLN 2.1bn – PLN 2.2bn
                                                                                                                   ✓            Confirmed

                                    PLN 510m
          Cash CAPEX
                               64% of FY guidance limit
                                                                                   Up to PLN 800 m
                                                                                                                   ✓            Confirmed

                                    PLN 603m
              FCFE1
                             75-80% of FY guidance range
                                                                            PLN 750m – PLN 800m
                                                                                                                   ✓            Confirmed

          Distribution to
          Shareholders
                                                               40-50% of FCFE
                                                                                                                   ✓            Confirmed

63                                                                                                                                                 63
Network Capex have peaked in 2018, expected to decline going forward

                                                                  ILLUSTRATIVE CASH NETWORK COSTS, 2017-22

                                                                                                             Potential national roaming costs
                                                                                                             if network rollout didn’t take place
                                                                                                             Network cash cost profile
                             2019-20:
                            2018 is thehigh
                                        yearCAPEX
                                             of peakspend is
                                                     network
                              offset&by
                            CAPEX       declining
                                      national    NR costs
                                               roaming costs
                                                                                                             Network cash CAPEX
                                                                                                             Network-related OPEX
                                                                                                             Network-related lease payments

        2017                        2018                       2019        2020        2021        2022      Expected decline in national
                                                                                                             roaming costs due to roll-out

                                                    Resulting in cash CAPEX / Revenue ratio
PLAY ambition for 2019-2022
                                                                                                        EBITDA GROWTH
                                                                                         Sustainable EBITDA growth until 2022

                                                                                                        CASH CONVERSION
                                                                      High cash conversion rate compared to European telecoms

                                                                                                   CASH CAPEX / REVENUE
                                                                              11-13% until 20201, returning below 10% from 2021

                                                                                                  EOY NET DEBT / EBITDA
                                                                                              Gradually declining towards 2.5x

                                                                                             SHAREHOLDER DISTRIBUTION
                                                                                                             40-50% of FCFE

     1 – Driven by nationwide network rollout, increased equipment purchase due to launch of new product lines and IT spend related to digitisation
     Note: Above ambition does not account for extraordinary spectrum outlays
65                                                                                                                                                    65
PLAY 2022:
     Summary

     Jean-Marc Harion
     Chief Executive Officer

66                             66
PLAY 2019-2022: consolidate leadership and improve profitability

             LEADERSHIP IN MOBILE-CENTRIC CONVERGENCE

             • Revenue growth mostly from current customer base
             • Commercial excellence online and offline
             • Top-of-mind brand
                                                                          SUSTAINABLE EBITDA GROWTH
                   TECHNOLOGY-DRIVEN PROFITABILITY                        and
                                                                          CASH CAPEX / REVENUE
PLAY 2019-2022: grow value through mobile-centric convergence

                         >4m FAMILY & SME ACCOUNTS
                          MBB ISP, OTT TV, Fixed Voice
                                      ARPU

                                      OWNER

                                                                           LEADERSHIP IN MOBILE
                         >15m PLAY MOBILE CUSTOMERS                        to drive
                          Data, VAS, Content, Handsets                     SERVICE REVENUE GROWTH

        ARPU   ARPU          ARPU     ARPU       ARPU    ARPU   ARPU

               DIGITAL
                                                                       +

68
PLAY 2019-2022: prepare for 5G

                           5G-READY NETWORK

            • Network designed for data,
            •   >70% of high capacity sites
            • Sites supporting 5G equipment, open to other operators

                                                                       ONE MOBILE PLATFORM
            NEW GENERATION OF MOBILE-CENTRIC SERVICES                  AVAILABLE TO 100% OF POPULATION
            • PLAY NEXT
            • PLAY 4G LTE advanced Internet
            • PLAY Now TV

69
„The value of seeming fair should be especially
      high for firms that plan to be in business selling
      to the same customers for a long time”.
                                                                                 Richard Thaler,
                                                                                 2017 Nobel Prize of
                                                                                 Economics

     Source: R. Thaler, Misbehaving: The Making of Behavioral Economics (2017)

70
Q&A Session

71
Glossary
                ADSL        Asymmetric digital subscriber line
                ARPU        Average revenue per user
                CRM         Customer relationship management
                DOCSIS      Data Over Cable Service Interface Specification
                FCFE        Free cash flow to equity
                FMC         Fixed-mobile convergence
                FTTH        Fibre-to-the-home
                HH          Households
                HP          Home Passed
                ISP         Internet service provider
                MCC         Mobile-centric convergence
                MNO         Mobile network operator
                MNP         Mobile number portability
                Mobile BB   Mobile broadband
                NPS         Net Promoter Score
                OTT TV      ‘Over-the-top’ TV
                POS         Point of sale
                RGU         Revenue generating unit
                SVOD        Subscription video on demand
                VDSL        Very High Bitrate Digital Subscriber Line
                xDSL        x Digital subscriber line

72
Low fixed broadband penetration also allows for mobile-centric convergence

                                                                                NGA BROADBAND PENETRATION 1                                        Fixed-mobile convergence (FMC)
                                                                                % Households, H1’2017                                              services are limited to ~55%
            LOW FIXED BROADBAND                                                                               79                                   of households
            PENETRATION                                                                    53
            (DUE TO HIGH ROLL-OUT                                                                                                                  Mobile-centric convergence services
            COSTS IN SPARSELY                                                                                                                      are available to ~100% of households
            POPULATED AREAS)                                                               PL               EU28

                                                                             NORMALISED FIXED + MOBILE ARPU 2                                      Limited scope for FMC discounts
                                                                             %, 2016                                                               – a prerequisite to drive consumer
                                                                                                              1.6
            PRICES AND ARPU                                                               1.0                                                      uptake of FMC offers
            ARE ALREADY VERY LOW
                                                                                                                                                   Mobile broadband is already used by
                                                                                           PL                 EU                                   ~50% of households 3

                                                                     Mobile-centric convergence is best-suited to Poland

     Note: NGA – Next-Generation Access network
     Source: 1 – European Commission, 2 – ARPU as % of real expenditure per capita, Analysis Mason, Ovum, Eurostat, ADL; 3 – Datawise, UKE, 2017

73
Customers believe PLAY is best positioned to address their digital needs

           TOP EXPECTATIONS OF MOBILE OPERATOR                                                                   MOST IMPORTANT CHARACTERISTICS OF DIGITAL SERVICES
                       Importance % surveyed customers                                                                                   Perception % surveyed customers 1

                           TAILORED CUSTOMER SERVICE                                                                                                 52%
                                                                                                                                                                     33-38%      +14-19% pts
                                                  74%
                                                                                                                                                    PLAY           Competitors

                            TECHNOLOGY & INNOVATION                                                                                                  34%             19-24%      +10-15 pps.
                                                  62%
                                                                                                                                                    PLAY           Competitors

                                             PLAY leads in customers’ expectations for technology innovation and customer service

     Source: 1 - Perception of "treats everyone individually” adn "modern, technologically advanced", segmentation study H1'18, n=1300

74
You can also read