MEDIA NATIONS: Scotland - 2018 Published 18 July 2018 - Ofcom
←
→
Page content transcription
If your browser does not render page correctly, please read the page content below

MEDIA NATIONS: Scotland
                  2018

       Published 18 July 2018
About this
                                                                    document

This is Ofcom’s first annual Media Nations: Scotland report. The report reviews key trends in the
television and audio-visual sector as well as the radio and audio industry in Scotland. It provides
context to the work Ofcom undertakes in furthering the interests of consumers and citizens in the
markets we regulate.

In addition to this Scotland report, there are separate reports for the UK as a whole, Wales, and
Northern Ireland, as well as an interactive data report.

The report provides updates on several datasets, including bespoke data collected directly from
licensed television and radio broadcasters (for output, spend and revenue), Ofcom’s proprietary
consumer research (for audience opinions), and BARB and RAJAR (for audience consumption). It
should be noted that our regulatory powers do not permit us to collect data directly from online
video-on-demand and video-sharing services (such as ITV Player, Netflix, Amazon Prime Video and
YouTube) for research purposes, and therefore we rely predominately on third-party sources for
information relating to these services.

                                                                                                      2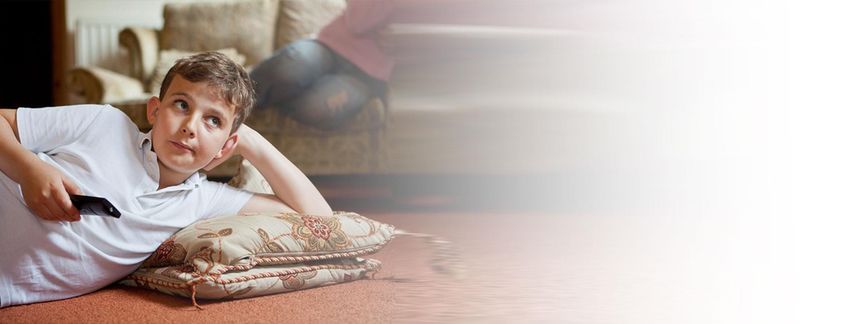
Contents
About this document ......................................................................................... 2
Key points .......................................................................................................... 4
TV services and devices...................................................................................... 7
TV and AV consumption................................................................................... 12
TV programming for viewers in Scotland ......................................................... 18
Satisfaction with and perceptions of TV ........................................................... 26
The radio listener ............................................................................................. 30

                                                                                                                          3
Key points

Despite a decline in time spent viewing broadcast TV, people in
Scotland watched more than any other UK nation in 2017
  •   In 2017, people in Scotland spent an average of 3 hours 46 minutes per day watching
      broadcast television, 9 minutes less than in 2016.
  •   As well as having the highest levels of TV consumption of the four UK nations (overtaking
      Wales for the first time since 2011), Scotland experienced the smallest decline in total
      viewing between 2016 and 2017 (down by 3.7% compared to 4.2% across the UK as a
      whole).
  •   Although people in Scotland are watching less broadcast television, they are using their TV
      set more for watching other things. Viewing of other non-broadcast services on the TV set
      (such as streaming services like Netflix and Amazon, or gaming) increased by three minutes a
      day in 2017, to 40 minutes per person per day.
  •   The semi-final of Strictly Come Dancing was the most-viewed broadcast programme on the
      TV set across Scotland in 2017, with nearly 1.2 million viewers.

There was an 8% real-terms decline in spend on new programming
for viewers in Scotland in 2017
  •   Together, the BBC, STV and ITV spent £53.9m on first-run UK-originated content specifically
      for viewers in Scotland in 2017, an 8% decrease in real terms since 2016. This decline was
      the result of lower spending by the BBC, which reduced spend by 10% year on year; STV/ITV
      spend remained broadly stable.

Scotland had the highest take-up of cable TV in the UK in Q1 2018
  •   Seventeen per cent of households in Scotland had Virgin Media’s cable TV service in the
      beginning of 2018 – a higher proportion than in Wales (10%), Northern Ireland (9%) and the
      UK average (14%).
  •   Paid satellite services – as offered by Sky – were the most common pay-TV services in
      Scotland, with 33% of homes having such a service, a 5 percentage point (pp) decline since
      2014, when it was at its highest.

                                                                                                     4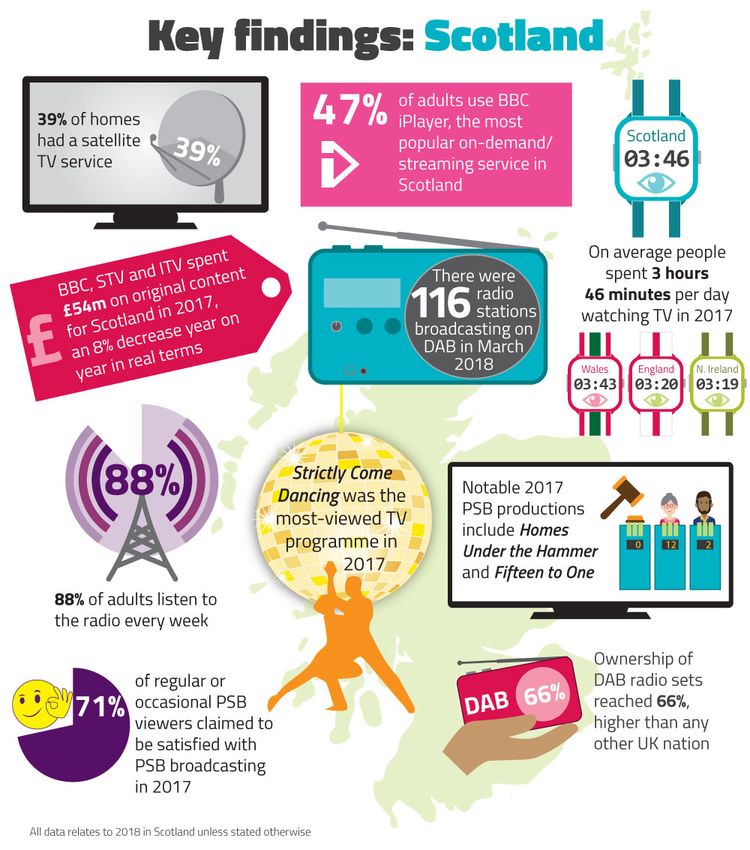
•    Almost a third of homes (32%) had a digital terrestrial TV service (Freeview) as their only TV
         platform in Q1 2018.
    •    BBC iPlayer was the most popular on-demand/streaming service among adults in Scotland in
         2018, with 47% claiming to use it. This was followed by Netflix (39%) and the STV Player
         (31%).

Viewers in Scotland continue to value public service broadcasting
content, with 71% either satisfied or very satisfied
    •    This compares to 75% for the UK average, 75% in England, 72% in Wales and 69% in
         Northern Ireland.
    •    Regular audiences of the public service broadcasters (PSBs) in Scotland rated delivery of ‘Its
         news programmes are trustworthy’ highly at 79%. This is comparable with Northern Ireland
         (74%) and significantly1 higher than the UK average, 69% and England (68%) and Wales
         (65%).
    •    Sixty-two per cent of regular/occasional PSB viewers in Scotland rated the statement ‘It
         portrays Scotland fairly to the rest of the UK’ highly. This is significantly higher than in Wales
         (47%) and Northern Ireland (48%) and is comparable to England (56%).
    •    ‘It shows different parts of the UK, including England, Northern Ireland, Scotland and Wales’
         was rated highly for delivery by 70% of Scottish regular/occasional PSB viewers. This is
         significantly higher than the score in Wales (56%) and compares with 63% in Northern
         Ireland and 66% in England.

Digital listening grows: ownership of DAB radios is higher in
Scotland than in the rest of the UK
    •    In Q1 2013, 79% of adults in Scotland listened to analogue radio; in the same period five
         years later, this has dropped to 69%. In contrast, digital listening, either online, through a
         DAB set or through the TV, has increased from 43% of the population to 57%.
    •    Listening via a digital platform accounted for 46.9% of time spent listening to the radio in Q1
         2018 (up from 41.3% in Q1 2017), lower than the UK average of 50.9% but higher than the
         digital share of listening in Wales (46.6%) and Northern Ireland (35.4%).
    •    Two-thirds of adults (66%) owned a DAB radio in Q1 2018. This was higher than in any other
         nation across the UK, with the average UK ownership figure standing at 64% in Q1 2018.
    •    Eighty-eight per cent of adults in Scotland listen to the radio each week.
    •    The BBC had a 46.3% share of the radio market in Q1 2018. Of the commercial radio groups,
         Bauer Radio had the largest proportion of the market, at 26.0%, followed by Global Radio
         with 14.9%.
    •    BBC Radio 2 was the most popular radio station across Scotland in Q1 2018.

1
 Throughout the Satisfaction with and perceptions of TV chapter of this report, ‘significantly’ has only been
used to highlight any increase or decrease in scores that show statistically significant differences at the 95%
confidence level for results compared within the current year, and at the 99% confidence level for results
compared between years. For further details, please refer to the PSB Tracker technical report on Ofcom’s
website https://www.ofcom.org.uk/research-and-data/data/statistics/stats18

                                                                                                                  5
6
TV services
                                                                      and devices

Chapter overview
TV services are available in a variety of ways in Scotland. Freeview is available on digital terrestrial
television (DTT) while Sky and Freesat offer satellite services and Virgin Media offers a cable TV
service. Set-top boxes from providers including TalkTalk and BT offer a Freeview service, alongside
pay-TV channels delivered through an internet connection (sometimes referred to as internet
protocol television or IPTV).

There is also a growing number of on-demand and streaming services available to consumers online.
These range from public service broadcaster (PSB) services like BBC iPlayer, STV Player, All4 and My5
to the subscription services offered by Netflix and Amazon.

98.7% of premises in Scotland had DTT coverage in 20182
DTT services, which are delivered through a television aerial, are provided in Scotland through a
combination of PSB and commercial (COM) multiplexes.3 Examples of services on the PSB multiplex
include BBC One, STV, Channel 4 and Channel 5, while the COM multiplexes provide access to
services such as Dave, Sky News and E4.

As of January 2018, 1.3% of premises in Scotland had no DTT coverage at all. However, this varies
across the country; the Shetland Islands (17%), Argyll and Bute (10%), Na h-Eileanan Siar (9%) and
the Highlands (7%) have significantly higher proportions of premises with no such coverage. A
further 11.9% of premises in Scotland had DTT coverage through the PSB multiplex but were unable
to receive the COM channels through their aerial4; these households would have to use satellite,
cable or the internet to watch the channels provided by the commercial multiplex.

2
  Ofcom analysis of operator data, January 2018
3
  Multiplexes are the transmission infrastructure used to distribute television services.
4
  Ofcom analysis of operator data, January 2018

                                                                                                           7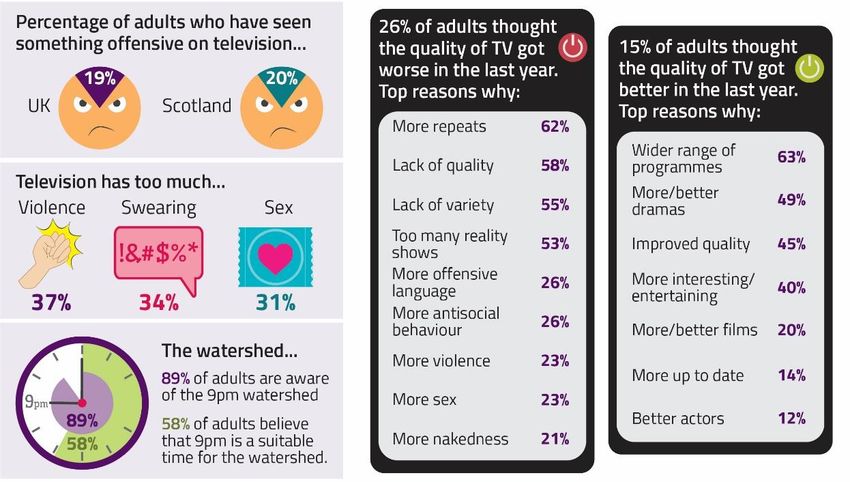
A slightly lower proportion of households in Scotland than in the UK as a whole had a TV set (94.5%
vs. 95.6%). Almost a third of homes (32.4%) had a digital terrestrial TV service through Freeview as
their only TV platform at the beginning of 2018.5

Two in five homes had a satellite TV service at the
beginning of 2018
Satellite TV services are provided by Sky and Freesat and serve about 98% of UK
premises6, with broadly the same level of availability across Scotland. Sky’s paid
satellite service was the most common pay-TV service in Scotland at the beginning of
2018, with 33.3% of homes having such a service, a 5pp decline since its peak in
2014. A further 5.8% had a free satellite service, meaning that at 39.1%, satellite TV
take-up in Scotland was higher than across the UK as a whole (37.1%) at the beginning of 2018.7

Scotland had the highest take-up of cable TV in the UK in 2018
                          Virgin Media’s cable service was available to more than a million premises
                          (38.6%) in Scotland in 2018. This is a 3pp increase on the 2016 coverage
                          figure of 35.4%; Virgin Media continues to expand its network through
                          Project Lightning.8

                          Seventeen per cent of households in Scotland had a cable TV service in 2018,
                          a higher proportion than in Wales (10%), Northern Ireland (9%), and the UK
                          as a whole (15%).9

5
  Source: BARB Establishment Survey Q1 2018
6
  Based on the availability of a line-of-sight path to the satellite. Does not include the impact of factors such as
access in multi-dwelling units where it is not feasible to install a dedicated household satellite dish and where
there is no internal wired distribution system for satellite, or the need for planning permission in some
locations
7
  Source: BARB Establishment Survey Q1 2018
8
  Ofcom analysis of operator data, January 2018
9
  Source: BARB Establishment Survey Q1 2018

                                                                                                                       8
Broadband in Scotland

A download speed of 2Mbit/s is the minimum speed required to deliver standard definition (SD)
video, and 98.5% of premises in Scotland had access to such a service in January 2018, more than
1pp up on the June 2016 figure of 97.4%. The vast majority (97.1%) of premises with PSB DTT
coverage that were unable to receive transmissions from the commercial multiplex through their
aerial had access to such a broadband service in January 2018.10

Ofcom research shows that 76% of households in Scotland had fixed internet access in the first half
of 2018, in line with the 80% across the UK.11 Superfast broadband offers download speeds of
>=30Mbit/s, and 39% of superfast lines in Scotland delivered such speeds in 2017. This was lower
than the 43% across the UK as a whole.12

Broadband take-up provides further access to TV
content
The proportion of homes that have internet protocol television (IPTV) only
(either from BT TV, TalkTalk TV, Plusnet TV, or a standalone YouView box), and
do not also have satellite, cable or other service, is growing in Scotland; 5.8% of
homes had such a service in Q1 2018, up from 2.5% in 2012.13

10
   Ofcom analysis of operator data, January 2018
11
   Source: Ofcom Technology Tracker H1 2018
12
   Ofcom analysis of operator data, published in Connected Nations 2017: Scotland, available at
https://www.ofcom.org.uk/__data/assets/pdf_file/0022/108814/scotland-connected-nations-2017.pdf
13
   Source: BARB Establishment Survey Q1 2012, Q1 2018

                                                                                                      9
Figure 1: Platform take-up in Scotland 2012-2017, households (000s)

3000

2500
                                                                                          Hybrid IPTV and digital
                                                                                          terrestrial only
2000
                                                                                          Digital terrestrial only

1500
                                                                                          Digital cable

1000
                                                                                          Free-to-view digital satellite

 500                                                                                      Pay-digital satellite

     0
      2012       2013        2014         2015         2016         2017         2018
       96.8%     94.6%        94.5%        96.6%       94.7%         97.2%        94.5%        % TV homes/all homes

Source: BARB Establishment Survey. BBC areas. Household-level data. All TV sets in the home included, so there
may be platform overlaps. Notes: Data points are based on Q4 of each year until 2018, when it is Q1. From Q4
2015 the claimed usage element was removed, leading to an increase in the TV set homes population. Digital
terrestrial only TV = receives digital TV through an aerial and not through digital satellite (DSAT) / digital cable
(DCAB) or other platforms. Hybrid IPTV digital terrestrial only = receives digital terrestrial TV through either BT
TV/TalkTalk TV/YouView/Plusnet TV and not DSAT/DCAB/other platforms.

On-demand and streaming services offer additional content and
options for consumers
BBC iPlayer was the most popular on-demand/streaming service among adults in Scotland in January
2018, with 47% claiming to ever use it. This was followed by Netflix (39%) and the STV Player (31%).
However, when looking at regular use, adults in Scotland are as likely to use Netflix as they are BBC
iPlayer; around three in ten adults in Scotland use Netflix (31%) and BBC iPlayer (28%) once a week.

The use of Netflix, in particular, is heavily skewed towards younger viewers. Thirty-one per cent of
adults in Scotland claim to use the service at least once a week, but this rises to 60% of 16-24s and
53% of 25-34s and drops to just 8% of the 65+ age group.14

14
     Source: Ofcom BBC Competition Assessment research

                                                                                                                           10
Figure 2: Use of on-demand/streaming services in Scotland
47%
39%
31% 31%
28% 27% 27%
25%
17%
15% 15%
12% 11% 12% 11%
5%
BBC iPlayer Netflix STV Player BBC Three All4 ITV Hub My5 Amazon
Ever use Use at least once a week
Source: Ofcom BBC Competition Assessment research, December 2017/January 2018. Base: All adults in
Scotland aged 16+ (1,111). Summary of TV channels or services ever watched/watched at least once a week.
A5: How often, if ever, do you watch any of the following TV channels or services – using a TV set, a computer
or tablet, or a mobile phone?
More than half of TV households in Scotland have a television
connected to the internet
In the first half of 2018 nearly half of all TV-owning households in Scotland had a smart TV (47%),
with 81% of these directly connected to the internet. But when we take other devices into account,
more than half of TV households (53%) had their TVs connected to the internet15: one in five (22%)
had used a set-top box with access to digital or cable TV broadcasts (such as Sky+, Virgin TiVo,
YouView), higher than the UK figure (14%). Eighteen per cent used a games console to connect their
TV to the internet and 12% used an internet-connected dongle or set-top box (such as NOW TV,
Roku, Google Chromecast, Amazon Fire TV stick, Amazon Fire TV or Apple TV).16
Watching TV on the go is enabled by the growth in smartphone take-up in recent years – 82% of
those with a mobile phone now use a smartphone in Scotland, in line with 85% in Northern Ireland
and 78% in Wales. Among smartphone users in Scotland, 87% have a 4G service, similar to Wales
and Northern Ireland.17 In January 2018, indoor 4G premises coverage from all mobile network
operators stood at 67% in Scotland, with geographic coverage at 30%.18
15
Source: Ofcom Technology Tracker H1 2018
16
Source: Ofcom Technology Tracker H1 2018
17
Source: Ofcom Technology Tracker H1 2018
18
Ofcom analysis of operator data, as published in Ofcom Connected Nations Update Spring 2018, available at
https://www.ofcom.org.uk/research-and-data/multi-sector-research/infrastructure-research/connected-
nations-update-spring-2018
11TV and AV
consumption
This section uses data provided by the Broadcasters’ Audience Research Board (BARB), a panel of
5,100 homes across the UK providing the official broadcast TV measurement for the industry. This
includes all viewing of broadcast TV through a television set, and via any device attached to the set
such as a computer, laptop or tablet. Unless otherwise stated, figures quoted are for seven-day
consolidated viewing. Consolidated viewing includes viewing of programmes at the time they were
broadcast on TV (live viewing) as well as recordings on digital video recorders (DVRs) and through
catch-up player services (e.g. apps on smart TVs) up to seven days after the first broadcast (time-
shifted). See the methodology annex for more information.
Despite a decline in time spent viewing broadcast TV, people in
Scotland watched more than any other UK nation in 2017
In 2017, people in Scotland spent an average of 3 hours 46 minutes per day watching television - 24
minutes more than the UK average. As well as having the highest levels of TV consumption of the
four UK nations (overtaking Wales for the first time since 2011), Scotland had the smallest decline in
total viewing between 2016 and 2017. Between these dates viewing fell by 3.8% in Scotland,
compared to an average of 4.2% across the whole of the UK.
12Figure 3: Average total TV daily viewing, by nation (in minutes): 2010-2017
270
Average minutes of viewing per day
269
250
242 Scotland
238
226 Wales
223
UK average
203
200 England
199
Northern Ireland
2010 2011 2012 2013 2014 2015 2016 2017
Source: BARB. BBC areas, all individuals (4+).
Younger viewers are driving the decline of broadcast TV viewing
As in the rest of the UK, it is the decline in viewing by children and young adults that is driving the
overall decline in TV consumption in Scotland. Viewing among the 55+ age group has remained fairly
stable in recent years, with a decline of only three minutes between 2016 and 2017. However, the
year-on-year decline in the average number of minutes of daily TV viewing was in the double digits
for all other age groups.
Figure 4: Average daily minutes spent viewing total TV, by age group in Scotland: 2010-2017
357
Average minutes of viewing per day
346 55+
286
269 All individuals (4+)
226
205 226 35-54
148 16-34
136
Children (4-15)
87
2010 2011 2012 2013 2014 2015 2016 2017
Source: BARB. BBC areas.
13The PSB channels
Public service broadcasting (PSB) is currently provided in Scotland by the BBC, Channel 4 Corporation
(C4C), STV, ITV and Channel 5. While all of the BBC TV services are PSB, only the main channels of
the other broadcasters are. In return for providing PSB services such as news and original
productions, these broadcasters receive certain benefits: access to spectrum (the radio waves that
support wireless communication) to broadcast their services; prominence on electronic programme
guides on television (EPGs); and, in the BBC’s case, the licence fee.
More than half of all broadcast TV viewing in Scotland in 2017 was
to the main five PSB channels
In 2017, the main five PSB channels accounted for a combined 52.2% share of the total broadcast TV
audience in Scotland. The PSB channels’ share in Scotland, although lower than in Wales, was higher
than in Northern Ireland and the UK average. The viewing shares of each of the main five PSB
channels in Scotland is very similar to the UK average, although BBC One and Channel 5 had slightly
larger shares of viewing in Scotland.
Figure 5: Percentage share of total TV viewing, UK nations, five main PSB channels: 2017
52.4 53.1
50.9 50.9
4.1 3.8
3.6 3.9
3.3
4.9 4.8 4.8
16.2 Channel 5
15.1 14.6
17.7
Channel 4
6.1
5.8 5.8 ITV/UTV/STV/ITV Cymru Wales
4.8
BBC Two
BBC One
22.4 23.7 21.8
20.0
Scotland Northern Ireland Wales UK
Source: BARB. BBC areas, all individuals (4+).
The semi-final of Strictly Come Dancing was the most-viewed
programme across Scotland in 2017
Two of the top 20 most-viewed programmes in 2017 were only shown in Scotland. Hogmanay staple
Only an Excuse? was the sixth most popular programme, while Hogmanay Live was 15th; both were
14on BBC One Scotland. Six of the top 20 programmes were broadcast on STV, including the first
episode of the last series of Broadchurch.
Figure 6: Top 20 most-watched programmes in Scotland, 2017
Rank Programme Title Channel Date Average 000s % TVR % Share
1 Strictly Come Dancing BBC One Scotland 09/12/2017 1,171 24.0 58.8
2 Blue Planet II BBC One Scotland 12/11/2017 1,092 22.4 45.8
3 Mrs Brown's Boys Christmas Special BBC One Scotland 01/01/2017 1,048 21.4 46.3
4 Broadchurch ITV/STV 27/02/2017 1,029 21.0 40.7
5 Strictly Come Dancing: The Results BBC One Scotland 10/12/2017 1,028 21.1 50.5
6 Only an Excuse? BBC One Scotland 31/12/2017 958 19.7 56.0
7 The Moorside BBC One Scotland 14/02/2017 945 19.3 38.4
8 I'm a Celebrity - Get Me Out of Here! ITV/STV 19/11/2017 938 19.2 44.5
9 Britain's Got Talent (Series 11) ITV/STV 22/04/2017 934 19.1 44.0
10 One Love Manchester BBC One Scotland 04/06/2017 915 18.7 45.1
11 Line of Duty BBC One Scotland 30/04/2017 896 18.3 36.3
12 Call the Midwife BBC One Scotland 19/02/2017 885 18.1 36.6
13 Strictly Come Dancing Launch Show BBC One Scotland 09/09/2017 879 18.0 47.1
14 Sherlock BBC One Scotland 01/01/2017 865 17.7 36.0
15 Hogmanay Live BBC One Scotland 31/12/2017 861 17.7 51.5
16 Coronation Street ITV/STV 11/12/2017 840 17.2 43.5
17 Emmerdale ITV/STV 11/12/2017 834 17.1 42.2
18 Doctor Foster BBC One Scotland 03/10/2017 805 16.5 37.3
19 All Round to Mrs Brown's BBC One Scotland 01/04/2017 786 16.0 40.4
20 Ant & Dec's Saturday Night Takeaway ITV/STV 18/03/2017 772 15.8 39.4
Source: BARB. BBC areas, all individuals (4+). The TVR (television rating) measures the popularity of the
programme by comparing its audience to the population as a whole. One TVR is numerically equivalent to 1%
of the target audience.
BBC One’s and STV’s early evening local news bulletins attracted a
greater share in Scotland than the UK average for the slot
Reporting Scotland, BBC One Scotland’s early evening news bulletin, attracted a 30.9% share of the
slot’s viewing in Scotland, slightly up on 2016 (30.3%). STV’s counterpart, STV News at Six, attracted
a lower share at 26.2% (25.5% in 2016) albeit higher than the Channel 3 UK average share (20.5%)
for the slot.19
19
Source: BARB. Individuals (4+). UK averages based on share of respective early evening news bulletin time
slots (using the London news schedule). BBC One’s news is based on BBC Scotland area, STV news is based on
BARB’s ITV Scotland area, and therefore excludes viewing to ITV’s News Lookaround in the BARB ITV Border
area that includes part of Scotland and part of England. ITV News Lookaround had an average share of 40.2% in
all of the BARB ITV Border area.
15Figure 7: Audience share of BBC One Scotland and STV early evening news: 2017
Source: BARB. All Individuals (4+). Note: Early evening (‘local’) news bulletin figures based on ‘regional news’
genre programmes, start time 17:55-18:35, 10mins+ duration, weekdays. UK averages based on share of
respective early evening news bulletin time slots (using the London news schedule). BBC One’s early evening
news bulletin is transmitted between 18:30-19:00 and based on BBC areas. STV early evening news bulletin is
transmitted between 18:00-18:30 and based on ITV Scotland area.
Strategic review of STV
On 16 May, STV announced a three-year growth plan “to focus the organisation on content and
digital to deliver long-term growth for shareholders”. It said it would allocate £15m for investment in
new original content and digital to help re-establish STV as a creative force.
As part of this review STV decided to close STV2, which had combined the five local TV licences for
Glasgow, Edinburgh, Aberdeen, Dundee and Ayr into a single networked service from April 2017
until June 2018. The move followed the channel’s £800,000 loss in 201720 and STV’s increased focus
on online content investment, following the strategic review.
Commercial terms have been agreed to sell STV’s local TV assets to That’s Media. Each licence’s
programming commitments for hours of local programming is available on Ofcom’s website .
20
See STV’s full year results for 2017, available at http://www.stvplc.tv/files/download/2cf4378a02da349
16Non-broadcast viewing on the TV screen continues to increase
As in the rest of the UK, although people in Scotland are watching less broadcast television, they are
spending more time watching other things on their TV set. Viewing of non-broadcast services on the
TV set (such as streaming services like Netflix and Amazon, or gaming) increased by three minutes a
day in 2017, to 40 minutes per person per day. This increase did not totally offset the overall decline
in use of the television set, which decreased from 276 minutes per day in 2016 to 271 minutes in
2017.
Figure 8: Average daily minutes, per person, of total TV screen time, Scotland
270 276 276 271
26 33 37 Total TV screen time
40
4 4 4
27 30 5 Unmatched viewing*
31 29
Time-shifted: 8-28 days
Time-shifted: up to 7 days
213 209 Live viewing
203 197
Industry standard BARB
measurement is up to 7 days
2014 2015 2016 2017
Source: BARB. BBC areas, all individuals (4+). * Note: Unmatched viewing refers to when the TV is in use, but
content cannot be audio-matched or otherwise identified. It includes gaming, viewing DVDs/box sets/archives,
subscription video-on-demand (SVoD), time-shifted viewing beyond 28 days, apps on smart TVs and navigation
around EPG guides where there is no in-picture broadcast content. Audio-matched digital radio stations are
excluded.
17TV programming
for viewers
in Scotland
Chapter overview
The BBC, STV and ITV provide programming specifically for viewers in Scotland across a range of
genres, but most notably news and current affairs output. BBC One Scotland and BBC Two Scotland
are available across the country, while STV and ITV provide bespoke news programmes for those
who live in the north of Scotland, central Scotland and the south of Scotland.21
The analysis below examines first-run UK originations, which are programmes commissioned by or
for a licensed public service channel with a view to their first showing on television in the UK in the
reference year. Spend on such content includes all costs incurred by the broadcaster associated with
making programmes. These include both direct and indirect production costs for in-house
productions, and licensing costs for commissioned programmes, but exclude costs related to
marketing and distribution. All spend figures are in real terms, which mean they are adjusted for
inflation using the consumer price index (CPI) and are listed in 2017 terms.
There was an 8% real-terms decline in spend on new programming
for viewers in Scotland in 2017
BBC, STV and ITV spent a combined £53.9m on first-run UK-originated content specifically for
viewers in Scotland in 2017, an 8% decrease in real terms since 2016. Just under half of this was on
news (£20m) and current affairs (£5.2m); the rest (£28.7m) was on other genres.
21
The STV figures in this chapter relate to content on the main STV channel only and not the local TV services
operated by STV until June 2018.
18Figure 9: First-run UK-originated spend for Scotland, by genre
Source: Ofcom/broadcasters. Note: Figures are expressed in 2017 prices.
BBC spend on new content for Scotland declined by 10% year on
year in real terms
The BBC accounts for most of the spend on first-run UK originations for Scotland, but it reduced its
spend on BBC One and BBC Two by £4.8m in 2017 to £43.6m, a 10% year-on-year decrease in real
terms (BBC Alba also spent £15m on first-run originations in 2017 – see Figure 14 below).
Investment by STV and ITV has been broadly stable in recent years, at £10.3m in both 2016 and
2017.
19Figure 10: PSB spend on non-network first-run UK originations, Scotland (£m)
Source: Ofcom/broadcasters. Note: Figures are expressed in 2017 prices.
BBC current affairs output for viewers in Scotland has reduced in
recent years
The BBC broadcast 50 hours of first-run current affairs output for Scotland in 2017, a 55% (60 hours)
year-on-year reduction, following an 89 hour (45%) decline in 2016. Since the end of 2016, BBC Two
Scotland has broadcast the weekly Timeline current affairs show, replacing Scotland 2016 that used
to be broadcast on several nights throughout the week.
20Figure 11: BBC hours of first-run UK-originated content for Scotland (BBC One and BBC Two)
Source: Ofcom/broadcasters.
BBC Scotland
In November 2017 the BBC published a public interest test proposing to launch a new channel for
Scotland. The channel would broadcast from 7pm to midnight every evening, with BBC Two
simulcasts from 12 noon to 7pm, interspersed with events such as live political coverage. There
would be a one-hour, integrated news programme broadcast each weeknight at 9pm, featuring
international, UK and national stories, told from a Scottish perspective. The channel would replace
BBC Four on the electronic programme guide on some platforms in Scotland. The BBC subsequently
updated its proposal to include an HD simulcast of the service.
Ofcom published its decision to approve the launch of the new channel in June 2018, following a
competition assessment and public consultation on the provisional decision, and the new channel is
expected to launch in February 2019. Alongside this, the BBC announced that it would invest £4m in
a new digital hub in Glasgow, creating an additional 60 jobs that will focus on developing BBC
services on voice platforms such as Amazon Echo Alexa and Google Home, on education and on
creating a common digital platform for BBC online.22
22
Further information available at http://www.bbc.co.uk/mediacentre/latestnews/2018/digital-hub-scotland
21In 2017, STV news output was at its lowest level since 2012
STV’s first-run UK-originated hours reduced in 2017, most notably across news content. At 439 hours
of news broadcast in 2017, this was a 13% reduction (68 hour) on 2016 and the lowest since 2012.
However, at 58 hours, new current affairs output in 2017 was at its highest level since 2013 on STV.
ITV broadcast 87 hours of original current affairs for viewers in the South of Scotland in 2017, an
increase on the 76 hours broadcast in 2016.
Figure 12: STV hours of first-run UK originations for viewers in Scotland
Source: Ofcom/broadcasters.
22Creative Scotland/Screen Unit
Progress has been made to establish the Screen Unit - a partnership between Creative Scotland,
Highlands and Islands Enterprise, Skills Development Scotland, Scottish Enterprise and the Scottish
Funding Council. The Unit is tasked with driving and achieving increased screen production and
business growth, with a focus on the major TV opportunities as yet untapped in Scotland.
In September 2017 the Scottish Government announced an additional £10m investment into the
film and TV sector as part of its Programme for Government, bringing its commitment to £20m per
year in screen development, production and growth. It also announced that it would maintain
investment in the Production Growth Fund, to incentivise production in Scotland.23 Since October
2015, the Scottish Government and Creative Scotland, through the National Lottery, have allocated
£3.7m through the Fund to attract film and high-end television productions to come to, or stay in,
Scotland.
More than 8% of qualifying network content across the PSB
channels were Scotland-based productions in 2017
The public service broadcasters assign programming produced across the UK based on Ofcom’s
regional production guidance.24 Of all qualifying hours in 2017, 8.5% were Scotland productions, and
accounted for 5.6% of all qualifying spend, broadly in line with 2016 levels. For context, around 8.2%
of the UK population live in Scotland.
The BBC commissioned the most Scottish productions in 2017 across the PSBs, with 16.3% of its
qualifying network hours and 9.1% of its spend attributed to Scotland. This spanned high-volume
network productions like the BBC’s snooker coverage and Homes under the Hammer as well as
dramas set in Scotland such as Trust Me and Clique, the latter of which premiered online on BBC
Three before being broadcast on BBC One.
Channel 4 increased both spend and hours of Scotland productions in 2017 compared to 2016, with
8.7% of hours and 6.8% of spend attributed to Scotland, up from 6.3% and 5.2% respectively. Its
programming covered network formats including Fifteen to One. The vast majority of ITV’s (99.7%)
23
See https://news.gov.scot/news/record-spend-on-film-and-tv-production
24
The main purpose of the PSBs’ regional production requirements, measured against their out-of-London
quotas, is to support and strengthen the TV production sector and the creative economies in the nations and
regions of the UK. Ofcom is currently reviewing the guidance, and published a call for evidence in March 2018:
https://www.ofcom.org.uk/consultations-and-statements/category-2/regional-production-programming-
guidance-review.
23and Channel 5’s (98.8%) qualifying network productions continued to be produced in England in
2017.
Figure 13: Expenditure on, and hours of, originated network productions outside London: 2010-
2017
Spend Hours
London London
61.8% 57% 55.4% 51.9% 51.7% 54.4% 56.8% 56.6% 60.8% 58.5% 54.7% 49.3% 49% 50.8% 49.4% 51.2%
0.9% 0.8% 1.1%
1.4% 1.4% 1.8% 0.9% 2.5%
2.3% 1.2% 2.7% 0.9%
1.1% 1.5% 2.4%
1.2%
0.8% 3.3% 3.2% 0.9% 0.9% 8.4% 7.5%
1.0% 3.5% 1.5% 2.0% 1.7% 8.6%
2.8% 3.5% 1.5% 1.2% Other 0.8% 7.2% 8.5%
5.2% 1.6%
0.4% 5.9% 4.3% 3.2% 3.4% 1.4% 7.2% 5.1%
2.6% 4.9% 4.4% 1.6% Northern Ireland 6.1%
2.1% 1.1% 4.6% 6.8% 5.5% 6.7%
2.6% 5.7% 5.6% 6.0%
4.6% 2.5% Wales
1.9% 1.5% 6.3%
2.8% 13.3% 8.3% 11.1%
14.0% Scotland 7.7% 12.1%
12.1% 13.6% 10.4% 8.0%
7.8% 9.7% Midlands & East 10.4%
14.7% 10.1%
12.6%
Southern England 10.9%
12.9%
Northern England
22.5% 24.1% 21.8% 23.1%
20.0% 19.9% 20.3% 21.5% 20.2% 21.1% 19.7%
16.7% 18.2%
15.1% 13.4%
11.6%
2010 2011 2012 2013 2014 2015 2016 2017 2010 2011 2012 2013 2014 2015 2016 2017
Source: Ofcom/broadcasters. Note: Figures do not include network news production. The category ‘other’ refers
to programmes made by producers based within the M25 which qualify as regional productions on the grounds
that 70% of total spend and 50% of off-screen talent spend was outside the M25, but not all in one macro-
region, and therefore cannot be attributed to a single region. See
www.ofcom.org.uk/__data/assets/pdf_file/0019/87040/Regional-production-and-regional-programme-
definitions.pdf on Ofcom website for further details.
Glasgow shortlisted for Channel 4’s National HQ and Creative Hubs
Glasgow has moved onto the shortlist of cities under consideration for the new national HQ and the
two Creative Hubs that Channel 4 will be opening from 2019 onwards. The decision will be made in
October 2018; Glasgow faces competition from six cities for the National HQ and 12 cities for the
two Creative Hubs.25
BBC Alba spent £15.4m on first-run UK- originated content in 2018
There were 648 hours of first-run UK originations broadcast on BBC Alba in 2017, a 58-hour
reduction on 2016 and the lowest figure since 2013. There was also an 8% year-on-year decline in
real-terms spend on first-run UK originations in 2017. However, at £15.4m, this was the third highest
annual spend on first-run UK originations since the channel launched in 2008.
25
http://www.channel4.com/info/press/news/channel-4-reveals-shortlist-for-new-national-hq-and-creative-
hubs
24Figure 14: BBC Alba spend on first-run UK originations
Source: Ofcom/Broadcasters. Note: Figures are expressed in 2017 prices.
In April 2018, it was announced that the Gaelic media service, MG Alba, had secured programmes
worth £5.2m for the BBC Alba channel in a series of international deals. The channel's suppliers will
team up with production companies in Germany, Denmark, Iceland, France, Norway and Canada.
25Satisfaction with and
perceptions of TV
Chapter overview
This chapter examines TV audiences’ overall satisfaction with PSB channels in Scotland, and their
opinions on the importance and delivery of a range of purposes and characteristics.26 The data are
drawn from Ofcom’s 2017 PSB tracker survey.27 The chapter then goes on to consider audience
satisfaction with broadcasting standards, using data from Ofcom’s 2017 cross-platform media
tracker survey.
Viewers in Scotland continue to value PSB content
Seventy-one per cent of regular or occasional PSB viewers in Scotland who watch any PSB channel
(BBC One, BBC Two, STV, Channel 4 or Channel 5) were very, or quite, satisfied with PSB
broadcasting. This compares to 75% for the UK, 75% in England, 72% in Wales and 69% in Northern
Ireland.28
Looking at news provision in particular, audiences in Scotland rated delivery of ‘Its news
programmes are trustworthy’ highly, at 79%. This is comparable with Northern Ireland (74%) and
significantly29 higher than the UK average (69%), England (68%) and Wales (65%).
26
The statutory purposes and objectives of public service broadcasting are set out in Section 264 of the
Communications Act 2003. In Ofcom’s first PSB Review, we built on these, following extensive research and
consultation, creating a framework of PSB purposes and characteristics.
27
For details on the methodology and questionnaire, please refer to the PSB tracker technical report on
Ofcom’s website https://www.ofcom.org.uk/research-and-data/data/statistics/stats18
28
Ofcom PSB tracker 2017. For details on the methodology and questionnaire, please refer to the PSB tracker
technical report on Ofcom’s website https://www.ofcom.org.uk/research-and-data/data/statistics/stats18
29
Throughout the Satisfaction with and perceptions of TV chapter of this report, ‘significantly’ has only been
used to highlight any increase or decrease in scores that show statistically significant differences at the 95%
confidence level for results compared within the current year, and at the 99% confidence level for results
compared between years. For further details, please refer to the PSB tracker technical report on Ofcom’s
website: https://www.ofcom.org.uk/research-and-data/data/statistics/stats18
26The range of high-quality news output is rated highly by PSB
viewers in Scotland
Figure 15 shows ratings for the delivery of the statement ‘regional news programmes provide a wide
range of good quality news about my area’ for BBC One, the Channel 3 licence holders and all
channels combined by nation. Four in five regular viewers in Scotland rated BBC One’s wide range of
quality news highly (78%). This compares with 75% for both the UK average and England; 79% in
Northern Ireland and 70% in Wales.
STV was also highly rated (85%) - significantly higher than the UK average (75%), England (74%) and
Wales (70%) and comparable with Northern Ireland (80%).
Figure 15: Delivery of regional news programmes providing a wide range of good quality
programmes, by nation: 2017
% Rating as 7-10 out of 10 for delivery
85%
78% 79% 80%
75% 75% 75% 74% 76%
70% 70% 70% 70% 69% 71%
BBC One ITV/ STV/ ITV Wales/ UTV All channels combined
UK England Scotland Wales NI
UK England Scotland Wales NI
Shows significant differences between nations for BBC One/ITV/All channels combined at 95% level
Source: Ofcom PSB tracker 2017. Q15 How would you rate each channel individually on this statement, on a
scale of 1 to 10, where 10 is the highest score and 1 is the lowest? Q16 How would you rate BBC One and ITV
combined on this statement? Base for individual channels: Self-reported regular viewers of each in each nation
(BBC One = 2207, 1384, 351, 292, 180; ITV1 = 1884, 1183, 286, 246 ,169). Base for ‘All channels combined’: All
respondents who ever watch any PSB channels in each nation (3098, 1957, 502, 400, 239)
27Viewers in Scotland feel more strongly than viewers in the rest of
the UK that the PSBs portray the nations effectively
Sixty-two per cent of regular/occasional PSB viewers in Scotland rated the statement ‘It portrays
Scotland fairly to the rest of the UK’ highly. This is significantly higher than in Wales (47%) and
Northern Ireland (48%) and is comparable to England (56%).
The statement ‘It shows different parts of the UK, including England, Northern Ireland, Scotland and
Wales’ was rated highly for delivery by 70% of Scottish regular/occasional PSB viewers. This is
significantly higher than the score in Wales (56%) and compares with 63% in Northern Ireland and
66% in England.
Seventy-one per cent of regular/occasional PSB viewers in Scotland highly rated highly the
statement ‘Its programmes show different kinds of cultures within the UK’. This is significantly higher
than in Wales (62%) and compares with 65% in Northern Ireland and 66% in England.
Figure 16: Reflecting identity/representing diversity in the nations, by nation: 2017
% Rating as 7-10 out of 10 for delivery
70% 71%
66% 66% 65%
62% 63% 62%
56% 56%
47% 48%
It portrays my It shows different parts of the UK, Its programmes show different
region/Scotland/Northern including England, Northern kinds of cultures within the UK
Ireland/Wales fairly to the rest of Ireland, Scotland and Wales
the UK
England Scotland Wales NI
UK England Scotland Wales NI
Shows significant differences between nations for BBC One/ITV/all channels combined at 95% level
Source: Ofcom PSB tracker 2017. Q15 How would you rate each channel individually on this statement, on a
scale of 1 to 10, where 10 is the highest score and 1 is the lowest? Base: All respondents who watch any PSB
channels regularly or occasionally in each nation: 2017 (1957, 502, 400, 239)
28Attitudes to TV in Scotland
One of Ofcom’s duties under the Communications Act 2003 is to ensure that people who watch
television and listen to the radio are provided with appropriate protection from harmful or offensive
material. The annual Ofcom cross-platform media tracker survey looks at attitudes to offensive
language, sex and violence.
A quarter of television audiences in Scotland (26%) feel that TV has got worse in the past year; a
third feel there is too much sex (31%), too much offensive language (34%) and too much violence
(37%)30. This is on par with UK audiences overall.
Source: Ofcom cross-platform media tracker 2017. Base: All with any TV sets in 2017; UK (2,313); Scotland
(228)
30
Base sizes below 100. Treat as indicative only.
29The radio listener
Chapter overview
This chapter provides an overview of the key developments in the radio and audio market in
Scotland, including who is listening, how they are listening and what they are listening to. It also
looks at the availability of DAB (digital audio broadcasting) services in Scotland.
There were 116 stations broadcasting on DAB in Scotland in March
201831
A total of 69 local commercial DAB services were available on local DAB multiplexes in Scotland in
March 2018. A further 34 commercial stations which broadcast across the UK on DAB are available in
Scotland, as well as 13 from the BBC. There were 70 analogue stations available in March 2018,
although Northsound 2’s move to DAB-only in April 2018 mean that this figure will now be lower.32
Figure 24: Radio station availability in Scotland
Digital Analogue
69
34 35
25
13
7
3
All BBC UK commercial Local commercial Community licences
Source: BBC, Ofcom, March 2018
31
There may some duplication in the services counted here where, services broadcast on more than one
Scottish local multiplex.
32
https://radiotoday.co.uk/2018/03/northsound-2-to-switch-off-am-radio-service/
30Note: This chart shows the maximum number of stations available. Local variations and reception issues mean
that listeners may not be able to access all of them. The local commercial digital figure refers to the number of
services carried by local DAB multiplexes in Scotland. Not all services will contain local content, and some
services may be broadcast on a number of different multiplexes (but are still counted for these purposes as
individual services).
Community radio in Scotland
Ofcom awarded five-year licence extensions to the community radio stations Crystal FM (which
serves Penicuik)33, East Coast FM (East Lothian)34, Irvine Beat FM and K107 FM (Kirkcaldy)35 in 2018.
On 29 March 2018 Ofcom announced the award of new community radio licences to Cumbernauld
FM, covering Cumbernauld and North Lanarkshire, and Radio Saltire, to serve Tranent, Wallyford and
Musselburgh in East Lothian.36
DAB services from the BBC and commercial broadcasters are
available to most households in Scotland
DAB radio stations from the BBC were available in 95% of homes in Scotland in March 2018. This was
unchanged since 2017, as was coverage from the Digital One37(82%) and local DAB (85%)
multiplexes. There was a 1pp increase in the coverage across the Sound Digital multiplex over the
same period, to 65%.
33
https://www.ofcom.org.uk/manage-your-licence/radio-broadcast-licensing/monthly-updates/radio-
broadcast-update-january-2018#Community
34
https://www.ofcom.org.uk/manage-your-licence/radio-broadcast-licensing/monthly-updates/radio-
broadcast-update-february-2018#Community
35
https://www.ofcom.org.uk/manage-your-licence/radio-broadcast-licensing/monthly-updates/radio-
broadcast-update-april-2018#Community
36
https://www.ofcom.org.uk/manage-your-licence/radio-broadcast-licensing/monthly-updates/radio-
broadcast-update-march-2018
37
the UK’s first national commercial multiplex, owned by Arqiva.
31Figure 25: Household coverage of DAB (%)
BBC National DAB Digital One Sound Digital Local DAB*
97% 98%
95% 95%
92% 91% 92% 92%
87% 85% 88% 85%
81% 82% 83%
77%
65% 68%
57%
52%
UK England Northern Ireland Scotland Wales
Source: BBC, Arqiva, Ofcom, March 2018.
Digital radio ownership in Scotland continued to grow in 2017
Two-thirds of adults In Scotland (66%) owned a DAB radio, either in the home or the car, at the end
of Q1 2018, up from 37% in 2013.38 This was higher than in any other UK nation - the average UK
ownership figure was 64% in Q1 2018.
Figure 26: DAB ownership
% of population 66%
64%
64%
56%
46% 50%
UK
44%
England 37%
37%
Wales
Scotland
23%
Northern Ireland
2013 2014 2015 2016 2017 2018
Source: RAJAR39, all adults (15+), Q1 for each year
BBC nations’/local radio TSA40 for each nation
38
Ofcom’s technology tracker also looks at DAB ownership in the home, which stood at 40% among all radio
listeners in H1 2018.
39
Radio Joint Audience Research: the official body in charge of measuring radio audiences in the UK
40
RAJAR’s Total Survey Area for a radio station
32Listening to digital radio also continued to grow in 2018
Although 88% of adults listen to the radio, how they listen has been changing over the past few
years. In Q1 2013, 79% of adults in Scotland listened through an analogue radio; in the same period,
five years later, this has dropped to 69%. In contrast, digital listening, either online, through a DAB
set or through a TV, has increased from 43% of the population to 57%.
Share of time spent listening to the radio through a digital platform in Scotland is now 46.9%, up
from 41.3% in 2017, lower than the UK average of 50.9% but higher than the digital share of listening
in Wales (46.6%) and Northern Ireland (35.4%).
Figure 27: Share of listening hours via digital and analogue platforms in Scotland: 2013-2018
Share of total listening hours
Total Analogue 69.6%
53.1%
46.9%
Total Digital 30.4%
2013 2014 2015 2016 2017 2018
Source: RAJAR; BBC Radio Scotland TSA, Q1 of each year
More than three in five radio listeners in Scotland without a DAB
set say they’re unlikely to buy one in the next year
Just 5% of radio listeners without a DAB radio in Scotland say they are likely to buy one in the next
year, compared to 14% across the UK as a whole. This goes up to 16% in rural areas of Scotland.
Among those unlikely to get a DAB radio in the next 12 months, 55% said they had no need to do so
and/or they were happy to use an existing service.41
41
Ofcom Technology Tracker, H1 2018
33Figure 28: Likelihood of purchasing a DAB radio in the next year
19% 16% 15%
20%
34% 37% Don't know
38%
68% 68% 63% Unlikely
79%
62% 53%
61%
Likely
14% 16% 16%
5% 6% 9%
2%
Source: Ofcom Technology Tracker, H1 2018. Base: Adults aged 16+ who listen to radio, have any active radio
sets at home and do not have a DAB set** (n = 675 UK, 110 Scotland, 361 England, 98* Wales, 106 Northern
Ireland, 52* Scotland urban, 58* Scotland rural). *Caution: Low base, treat as indicative only. Significance
testing: Arrows indicate any significant differences at the 95% confidence level between Scotland and the UK in
H1 2018 and between Scotland urban and rural in H1 2018. QP12: How likely is it that your household will get a
DAB radio in the next 12 months?
Live radio is the most popular listening activity in Scotland
On average, adults in Scotland spend 14 hours 4 minutes each week listening to any type of audio;
71% of this was to live radio. This is lower than the proportion of time spent on live radio across
Great Britain (75%).42 Adults in Scotland spend more of their listening time on streamed music (11%)
compared to adults across Great Britain (8%). This is reflected in the fact that adults in Scotland are
more likely than adults in Great Britain (33% vs. 30%) to subscribe to a music streaming service.
42
The TouchPoints sample only covers Great Britain and so does not include Northern Ireland
34Figure 29: Proportion of time spent listening to different types of audio across the week: GB,
Scotland, Wales
Radio podcasts/downloads
3%
2% 3% 3% On demand/listen again radio programmes
3% 3% 5%
4% 4%
7%
8% 8% Other podcasts/downloads
6%
8%
11%
Music video channels/sites for background
listening e.g. YouTube, MTV
Your own personal collection on CD, vinyl record,
etc.
Live radio on a laptop, tablet, mobile, etc. (not a
76% radio set, car radio or TV set)
71% 67%
Your own personal digital music or audio
collection - stored on a device
Streamed online music e.g. Spotify, last.fm
Live radio on a radio set
Great Britain Scotland Wales
Source: TouchPoints 2017
Base: GB adults 15+; Government Office Regions: Scotland; Wales. Data for Northern Ireland are not collected
by TouchPoints.
Music is the most valued type of content for radio listeners across Great Britain, followed by national
news. But for listeners in Scotland, local news coverage is the second most valued type of content; it
is valued more by Scotland listeners than by those in Wales (29%) or across Great Britain as a whole
(27%).
Figure 30: Top ten most valued types of content on the radio
52%53%52%
36% 35%
34% 34%
28%27%28% 29%
27%
23% 22%
21%
20%19% 19%19%19%
18%
16%
13% 13% 13% 13% 12%
12% 11%
11%
Music National news Breaking news Local news Local traffic and Weather International Football Current affairs Djs/Presenters
travel news
Great Britain Wales Scotland
Source: TouchPoints 2017
Base: All who listen to the radio in GB and in Government Office Regions of Scotland and Wales
35Eighty-eight per cent of adults in Scotland listen to the radio every
week
Radio listeners in Scotland listened to an average of 21 hours 6 minutes of radio each week in Q1
2018. 43 At 88.3%, reach of radio in Scotland is lower than in the other UK nations. More people in
Scotland listen to commercial radio (67%) than to BBC radio (58%), whereas in the UK as a whole
66% listen to commercial radio each week, and 64% listen to the BBC.
Figure 31: Average weekly reach and listening hours
England Scotland Wales Northern UK TOTAL
Ireland
Average weekly
listening (hrs:mins) 20:48 21:06 22:00 19:18 20:48
Weekly reach 89.9% 88.3% 90.1% 93.4% 90.2%
Source: RAJAR, all adults (15+), Q1 2018
BBC nations’/local radio TSA for each nation
The BBC commands nearly half of all radio listening in Scotland
In Scotland, the BBC had a 46.3% share of the radio market in Q1 2018. Of the commercial radio
groups, Bauer Radio – which owns stations including Forth 1, Clyde 1 and Northsound 1 – has the
largest proportion of the market, at 26%, followed by Global Radio – the owner of Capital and Heart
– with 14.9%.
43
This figure is greater than that from RAJAR as it looks only at radio listeners while TouchPoints looks at the
listening activity of all adults.
36Figure 32: Share of listening by radio group in Scotland
Source: RAJAR, all adults (15+), Q1 2018, BBC Radio Scotland TSA
More than half of people in Scotland listen to local commercial
radio at least once a week
More people listened to local commercial radio across Scotland than listened to BBC nations/local
radio (51% vs. 20 %) in the first quarter of 2018. BBC nations’ and local output44 was more popular in
Scotland than the equivalents listened to in England (14% reach) and Wales (18% reach). However,
at 20%, BBC Radio Scotland’s reach is slightly down from the 23% of adults who listened five years
ago (Q1 2013).
Figure 33: Weekly reach to local radio, BBC vs. commercial
60.0%
50.9%
49.3% 49.3%
43.0%
38.5%
20.3%
18.1%
15.7%
14.1%
England Northern Ireland Scotland Wales UK
BBC nations'/local Local commercial
Source: RAJAR, all adults (15+), Q1 2018,
44
This includes listening to any BBC nation’s or local radio output, not just BBC Radio Scotland
37BBC nations’/local radio TSA for each nation
BBC Radio 2 was the most popular radio station in Scotland in Q1
2018
BBC Radio 2 was the most listened-to station across Scotland in Q1 2018, with a reach of 27.8%,
followed by BBC Radio Scotland with 20%. However, there were differences in radio listening habits
depending on where people live and what stations are available.
For example, within the central belt,45 where 62% of adults live, Capital Scotland was the third most
popular station, with 17% reach, as opposed to BBC Radio 1 across Scotland as a whole. But in
Aberdeenshire46, Bauer’s Northsound 1 was the most popular station, reaching almost two-fifths
(39%) of adults in the area.
Table 34: Top three stations listened to across the UK, Scotland and Scottish regions
UK Scotland* Central belt** Aberdeenshire***
Rank Station Weekly Station Weekly Station Weekly Station Weekly
reach reach reach reach
1 BBC Radio 2 28.3% BBC Radio 2 27.8% BBC Radio 2 22.7% Northsound 1 39.4%
2 BBC Radio 4 20.0% BBC Radio Scotland 20.0% BBC Radio Scotland 18.7% BBC Radio 2 30.2%
3 BBC Radio 1 17.4% BBC Radio 1 16.1% Capital Scotland 17.3% BBC Radio 1 23.1%
Source: RAJAR Q1 2018. * BBC Radio Scotland TSA. **Capital Scotland TSA. ***Northsound 1 TSA
In the central belt region, peak listening time during the week was between 10am and 10.30am,
when the most listened-to programme was BBC Radio 2’s The Ken Bruce Show. Across its duration,
the show47 reached 13% of the central belt region, although this was lower than across the UK (16%).
45
RAJAR’s Capital Scotland TSA which includes 62% of adults 15+ in Scotland
46
RAJAR’s Northsound 1 TSA, with a population of 350,000 adults
47
09:30-12:00 Monday-Friday
38Figure 35: Average reach across the day in the central belt: Monday-Friday
12%
10%
8%
Weekly reach %
6%
4%
2%
0%
BBC Radio 1 BBC Radio 2 BBC Radio 4 BBC Radio Scotland Capital Scotland Clyde 1
Source: RAJAR Q1 2018, all adults 15+. Capital Scotland TSA.
In March 2018 it was announced that Rockscot Ltd, which won the Ofcom FM radio licence for West
Central Scotland, had been acquired by Nation Broadcasting (which predominantly own stations in
Wales and London). It was later confirmed that the company would launch a station called 'Nation
Radio Scotland' later in 2018.
Local commercial radio in Scotland generated the most revenue per
head across the UK in 2017
Local analogue commercial radio stations in Scotland, such as Northsound 1 and Wave FM,
generated £7.59 per head of population in 2017.48 This was the highest of all the UK nations, and at
the same level as 2016 in real terms.
48
These figures relate to revenues generated against analogue licences only. Revenue generated through
digital platforms are not included.
39Figure 36: Local commercial radio revenue per head (£): 2017
8.16
7.59
6.64 6.50 6.33 Year-on-year change
UK -2%
England -3%
Scotland 0%
Wales -1%
Northern Ireland 0%
Revenue per head
UK England Scotland Wales Northern Ireland
Source: Ofcom/broadcasters. Note: These figures relate to relevant turnover of local analogue licences (local
analogue commercial) and include local and national revenues and sponsorship.
In December 2017 it was announced that DC Thomson had acquired Dundee-based radio station
Wave 102. The station joined DC Thomson’s publishing arm, DCT Media.
40You can also read