BAIRD'S 2020 GLOBAL INDUSTRIAL CONFERENCE - NOVEMBER 12, 2020

Page created by Eleanor Chavez
 
CONTINUE READING
BAIRD'S 2020 GLOBAL INDUSTRIAL CONFERENCE - NOVEMBER 12, 2020
BAIRD’S 2020 GLOBAL
INDUSTRIAL CONFERENCE

    NOVEMBER 12, 2020
BAIRD'S 2020 GLOBAL INDUSTRIAL CONFERENCE - NOVEMBER 12, 2020
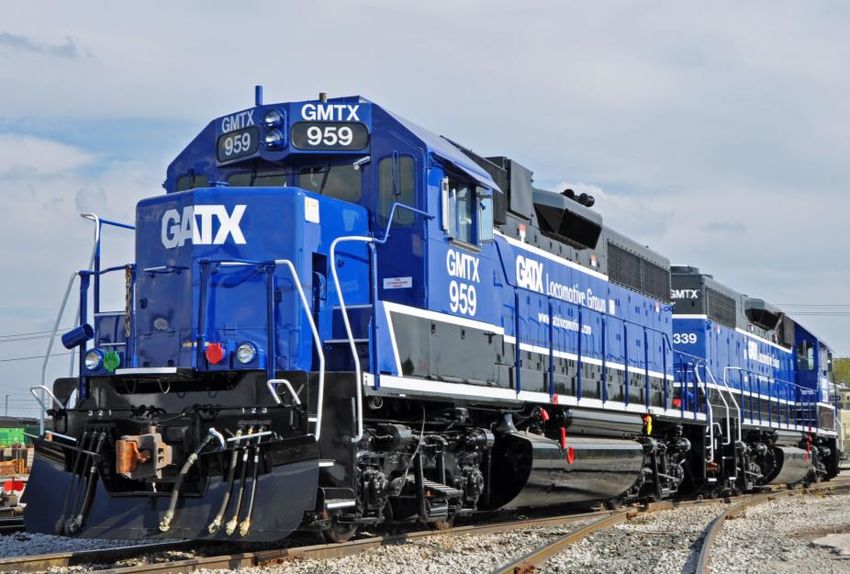
Forward-Looking Statements
Statements in this presentation not based on historical facts are “forward-looking statements” within the meaning of the Private Securities Litigation Reform Act of 1995 and, accordingly, involve known and unknown risks and
uncertainties that are difficult to predict and could cause our actual results, performance, or achievements to differ materially from those discussed. These include statements as to our future expectations, beliefs, plans,
strategies, objectives, events, conditions, financial performance, prospects, or future events. In some cases, forward-looking statements can be identified by the use of words such as “may,” “could,” “expect,” “intend,” “plan,”
“seek,” “anticipate,” “believe,” “estimate,” “predict,” “potential,” “outlook,” “continue,” “likely,” “will,” “would,” and similar words and phrases. Forward-looking statements are necessarily based on estimates and assumptions
that, while considered reasonable by us and our management, are inherently uncertain. Accordingly, you should not place undue reliance on forward-looking statements, which speak only as of the date they are made, and are
not guarantees of future performance. We do not undertake any obligation to publicly update or revise these forward-looking statements. The following factors, in addition to those discussed in our other filings with the U.S.
Securities and Exchange Commission (“SEC”), including our Form 10-K for the year ended December 31, 2019 and subsequent reports on Form 10-Q, could cause actual results to differ materially from our current expectations
expressed in forward-looking statements:

 the severity and duration of the global COVID-19 pandemic, including impacts of the pandemic and of businesses’ and         financial and operational risks associated with long-term railcar purchase commitments, including increased costs due to
  governments’ responses to the pandemic on our personnel, operations, commercial activity, supply chain, the demand             tariffs or trade disputes
  for our assets, the value of our assets and our liquidity                                                                   reduced opportunities to generate asset remarketing income
 exposure to damages, fines, criminal and civil penalties, and reputational harm arising from a negative outcome in          inability to successfully consummate and manage ongoing acquisition and divestiture activities
  litigation, including claims arising from an accident involving our railcars and other transportation assets                operational and financial risks related to our affiliate investments, including the Rolls-Royce & Partners Finance joint
 inability to maintain our transportation assets on lease at satisfactory rates due to oversupply of assets in the market       ventures, and the durability and reliability of aircraft engines
  or other changes in supply and demand                                                                                       fluctuations in foreign exchange rates
 a significant decline in customer demand for our assets or services, including as a result of:                              failure to successfully negotiate collective bargaining agreements with the unions representing a substantial portion of
  •   weak macroeconomic conditions                                                                                              our employees
  •   weak market conditions in our customers' businesses                                                                       asset impairment charges we may be required to recognize
  •   declines in harvest or production volumes                                                                                 deterioration of conditions in the capital markets, reductions in our credit ratings, or increases in our financing costs
  •   adverse changes in the price of, or demand for, commodities                                                               uncertainty relating to the LIBOR calculation process and potential phasing out of LIBOR after 2021
  •   changes in railroad operations or efficiency                                                                              competitive factors in our primary markets, including competitors with a significantly lower cost of capital than GATX
  •   changes in railroad pricing and service offerings, including those related to "precision scheduled railroading"           risks related to our international operations and expansion into new geographic markets, including the inability to access
  •   changes in supply chains                                                                                                   railcar supply and the imposition of new or additional tariffs, quotas, or trade barriers
  •   availability of pipelines, trucks, and other alternative modes of transportation                                          changes in, or failure to comply with, laws, rules, and regulations
  •   changes in conditions affecting the aviation industry, including geographic exposure and customer concentrations          inability to obtain cost-effective insurance
  •   other operational or commercial needs or decisions of our customers                                                       environmental remediation costs
  •   customers' desire to buy, rather than lease, our transportation assets                                                    potential obsolescence of our assets
 higher costs associated with increased assignments of our transportation assets following non-renewal of leases,              inadequate allowances to cover credit losses in our portfolio
  customer defaults, and compliance maintenance programs or other maintenance initiatives                                       operational, functional and regulatory risks associated with severe weather events, climate change and natural disasters
 events having an adverse impact on assets, customers, or regions where we have a concentrated investment                      inability to maintain and secure our information technology infrastructure from cybersecurity threats and related
  exposure                                                                                                                       disruption of our business

                                                                                                                                                                                                                                                      2
BAIRD'S 2020 GLOBAL INDUSTRIAL CONFERENCE - NOVEMBER 12, 2020
History and Business Overview

                 122
                 YEARS OF
                EXPERIENCE

                                3
BAIRD'S 2020 GLOBAL INDUSTRIAL CONFERENCE - NOVEMBER 12, 2020
GATX’s 122-Year History
                                                                                            1898
                                                                                            Established as railcar lessor with 28 railcars

                                                                                 1907
                                                  1919                           Began manufacturing railcars
                                                  Initiated quarterly dividend
                                1936
                                Began rail investment in Canada
               1984
               Exited railcar manufacturing
  1985
  Began locomotive investment

  1994
  Began rail investment in Europe & Mexico

              1998
              Formed Rolls-Royce and Partners Finance Affiliates (RRPF)

                                        2003
                                        Acquired 100% ownership in European rail joint venture
                                        and formed GATX Rail Europe (GRE)

                                                                                      2012 & 2013
                                                                                      Began rail investments in India and Russia

                                                                                             2020
                                                                                             $8.7 billion in assets and ~148,500 wholly owned railcars worldwide
                                                                                             as of 9/30/2020

                                                                                                                                                                   4
BAIRD'S 2020 GLOBAL INDUSTRIAL CONFERENCE - NOVEMBER 12, 2020
GATX Today – Business Segments
                               RAIL NORTH AMERICA
                                Premier railcar lessor                                                                                  6%
                                Diversified fleet of over 118,000 railcars                                                        8%
                                Strong customer credit quality, diversification in car types and commodities carried
                                $2.7 billion of committed lease receipts as of 12/31/2019

                                                                                                                             19%        NET BOOK
                               RAIL INTERNATIONAL                                                                                       VALUE OF
                                    GATX Rail Europe (GRE) is a leading European tank car and freight car lessor with                   ASSETS
                                     approximately 26,000 railcars                                                                                          67%
                                    Strong customer credit quality, diversification in car types, geography,
                                     and commodities carried
                                    GATX Rail India (GRI) is the largest railcar lessor in India with over 4,000 railcars

                               PORTFOLIO MANAGEMENT
                                                                                                                                   ~$8.7 Billion NBV*
                                    Largely comprised of our 50% ownership of Rolls-Royce and Partners Finance
                                     Affiliates (RRPF), a leading worldwide lessor of aircraft spare engines                         Rail North America
                                    RRPF portfolio has approximately 440 aircraft spare engines with $4.6 billion of net            Rail International
                                     book value
                                                                                                                                     Portfolio Management
                                                                                                                                     Other

As of 9/30/2020
*Assets from continuing operations

                                                                                                                                                                  5
BAIRD'S 2020 GLOBAL INDUSTRIAL CONFERENCE - NOVEMBER 12, 2020
Straightforward and Proven Business Model
        BUY                     LEASE                  SERVICE               MAXIMIZE
   the railcar at an          the railcar to a        the railcar in a       the value of the
economically attractive    quality customer at         manner that         railcar by selling or
  and competitively       an attractive rate for    maximizes safety,        scrapping at the
 advantaged price at       a term that reflects      in-use time, and          optimal time
    the right time         the business cycle      customer satisfaction

                                                                                                   6
BAIRD'S 2020 GLOBAL INDUSTRIAL CONFERENCE - NOVEMBER 12, 2020
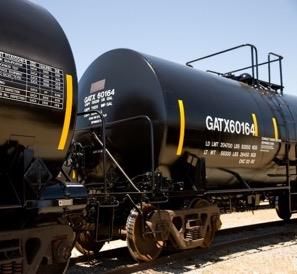
GATX Rail North America Overview
2019 OVERVIEW
                                                                                                  FLEET UTILIZATION*
WHOLLY OWNED FLEET COUNT

118,000+
                                        11%
                                                                              100%                                                99%
CAR TYPE COUNT                  7%                              26%
                                                                              98%
160+
                                                                                                                               98%
AVERAGE FLEET AGE             13%       INDUSTRIES                            96%
                                          SERVED
20 Years                                                                                                96%
                                                                              94%
LOCOMOTIVE COUNT
                                                                23%
                                                                              92%
625+                                20%
NUMBER OF CUSTOMERS                                                           90%
                                                                                          90%
850+
                                                                              88%
COUNTRIES OF OPERATIONS    Chemicals                     Food & Agriculture
                           Refiners & Other              Mining, Minerals &
U.S., Canada, & Mexico     Petroleum                     Aggregates
                                                                              86%
                                                                                     2001 2003 2005 2007 2009 2011 2013 2015 2017 2019
                           Railroads & Other             Other
                           Transports                                                                 *Excludes boxcar fleet

                                Based on 2019 Rail North America Revenue

                                                                                                                                         7
BAIRD'S 2020 GLOBAL INDUSTRIAL CONFERENCE - NOVEMBER 12, 2020
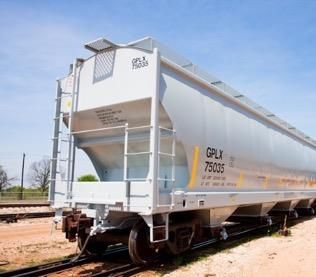
North America – Industry Commodity Carloads
                                                                                                              QUARTERLY COMMODITY CARLOAD TRAFFIC
                                                                                                                                                                           (North America)

                       2,500

                       2,000

                       1,500
           THOUSANDS

                       1,000

                        500

                          0
                               1Q08
                                      2Q08
                                             3Q08
                                                    4Q08
                                                           1Q09
                                                                  2Q09
                                                                         3Q09
                                                                                4Q09
                                                                                       1Q10
                                                                                              2Q10
                                                                                                     3Q10
                                                                                                            4Q10
                                                                                                                   1Q11
                                                                                                                          2Q11
                                                                                                                                 3Q11
                                                                                                                                        4Q11
                                                                                                                                               1Q12
                                                                                                                                                      2Q12
                                                                                                                                                             3Q12
                                                                                                                                                                    4Q12
                                                                                                                                                                           1Q13
                                                                                                                                                                                  2Q13
                                                                                                                                                                                         3Q13
                                                                                                                                                                                                4Q13
                                                                                                                                                                                                       1Q14
                                                                                                                                                                                                              2Q14
                                                                                                                                                                                                                     3Q14
                                                                                                                                                                                                                            4Q14
                                                                                                                                                                                                                                   1Q15
                                                                                                                                                                                                                                          2Q15
                                                                                                                                                                                                                                                 3Q15
                                                                                                                                                                                                                                                        4Q15
                                                                                                                                                                                                                                                               1Q16
                                                                                                                                                                                                                                                                      2Q16
                                                                                                                                                                                                                                                                             3Q16
                                                                                                                                                                                                                                                                                    4Q16
                                                                                                                                                                                                                                                                                           1Q17
                                                                                                                                                                                                                                                                                                  2Q17
                                                                                                                                                                                                                                                                                                         3Q17
                                                                                                                                                                                                                                                                                                                4Q17
                                                                                                                                                                                                                                                                                                                       1Q18
                                                                                                                                                                                                                                                                                                                              2Q18
                                                                                                                                                                                                                                                                                                                                     3Q18
                                                                                                                                                                                                                                                                                                                                            4Q18
                                                                                                                                                                                                                                                                                                                                                   1Q19
                                                                                                                                                                                                                                                                                                                                                          2Q19
                                                                                                                                                                                                                                                                                                                                                                 3Q19
                                                                                                                                                                                                                                                                                                                                                                        4Q19
                                                                                                                                                                                                                                                                                                                                                                               1Q20
                                                                                                                                                                                                                                                                                                                                                                                      2Q20
                                                                                                                                                                                                                                                                                                                                                                                             3Q20
                                              All Other                                         Coal & Coke                                                  Sand, Stone, Minerals, & Related Products                                                                                            Grain                                     Petroleum Products

Association of American Railroads

                                                                                                                                                                                                                                                                                                                                                                                                    8
BAIRD'S 2020 GLOBAL INDUSTRIAL CONFERENCE - NOVEMBER 12, 2020
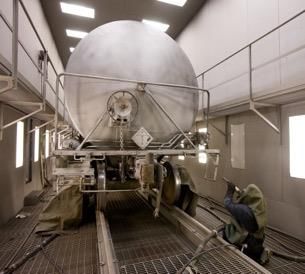
North America – Industry Backlog
                                                                            INDUSTRY BACKLOGS                                                                    Cyclicality of the
                                                                                                                                                                  industry is illustrated by
                                                                                                                                                                  the backlog of orders at
       160,000                                                                                                                                                    the railcar
                                                                                                                                                                  manufacturers
       140,000
                                                                                                                                                               The 2013 and 2014
                                                                                                                                                                  spike in tank car
       120,000
                                                                                                                                                                  backlog was primarily
                                                                                                                                                                  due to the crude boom
       100,000
                                                                                                                                                                 Backlogs have
        80,000                                                                                                                                                    moderated post-crude,
                                                                                                                                                                  with the recent decline
        60,000
                                                                                                                                                                  attributable to Precision
                                                                                                                                                                  Scheduled Railroading
                                                                                                                                                                  (PSR), freight market
        40,000
                                                                                                                                                                  weakness, and, in 2020,
                                                                                                                                                                  economic impacts from
        20,000
                                                                                                                                                                  COVID-19
               -
                       ’99    ’00   ’01       ’02   ’03   ’04   ’05   ’06   ’07   ’08   ’09   ’10   ’11   ’12   ’13   ’14   ’15   ’16   ’17   ’18   ’19 ‘20

                                                                  Number of Tank                    Number of Freight

Railway Supply Institute as of October 2020

                                                                                                                                                                                               9
BAIRD'S 2020 GLOBAL INDUSTRIAL CONFERENCE - NOVEMBER 12, 2020
GATX Actively Manages Through Cycles
                  GATX proactively manages changing market conditions by utilizing our strong
                  customer relationships and the diversity of our fleet to adjust rate and term.
                      STRONG MARKET                           WEAK MARKET                                        STRONG MARKET                                                 WEAK MARKET

             70       67              63                                                                                         66                                                                                       50%
                                                                                                   60             62
                                                                                                                                                 54                                                                       40%
             60
                                                                                                                                39%                                                                                       30%
             50                                                                    45                            35%
                                                     41                                                                                                                                                                   20%
    MONTHS

                                                                                                                                               32%                                                           39
                                                                                                  26%                                                                                         38
             40                                                     35

                                                                                                                                                                                                                                   LPI
                                                                                                                                                                32             33                                         10%
                      14%
             30                                                                    7%
                                                                                                                                                                                                                          0%
                                     5%                           -16%
                                                                                                                                                                                                                          -10%
             20                                                                                                                                                                                              -4%
                                                    -11%                                                                                                                                                                  -20%
             10                                                                                                                                                                              -10%                         -30%
                                                                                                                                                              -20%
                                                                                                                                                                             -28%
              0                                                                                                                                                                                                           -40%
                     2007           2008            2009           2010           2011           2012           2013            2014           2015           2016           2017            2018           2019

                                                                    Renewal Lease Term* (left axis)                                    Lease Price Index* (right axis)

                                  2008            2009            2010           2011            2012            2013           2014            2015            2016            2017            2018           2019              2020

Approximate # of
railcars scheduled               17,500          15,000          17,000         21,000          20,000          21,000         20,000          17,000          12,500          15,100          13,900          17,800            17,800
for renewal*

Renewal Success Rate*              60%            54%             62%             77%             82%            81%             86%            81%             67%             75%             83%               82%             N/A

Utilization*                       98%            96%             97%             98%             98%            99%             99%            99%             99%             98%             99%               99%             N/A

*Excludes boxcar fleet
LPI = Lease Price Index: The average renewal lease rate change is reported as the percentage change between the average renewal lease rate and the average expiring lease rate, weighted by GATX’s North American fleet
composition (excluding boxcars).
Renewal Success Rate: The percentage of expiring leases that were renewed with the existing lessee.
                                                                                                                                                                                                                           As of 12/31/2019

                                                                                                                                                                                                                                          10
GATX Strategy in Today’s Environment

   Operate the Business               Practice a Disciplined
                                                                      Outperform the Competition
   Safely and Efficiently           Capital Allocation Strategy

                                                                      • Maintain focus on utilization;
                                                                        highest reported utilization in
• Maintain a safe and healthy
                                                                        North America
  work environment
                                    • Place new cars from long-       • Shorten lease terms, enabling
• Continue to maintain fleet to       term supply agreements            repricing events in a better
  meet customer needs
                                    • Pursue attractive incremental     environment
 − All owned facilities are fully     investments                     • Leverage the strength of our
   operating
                                                                        full service offering, diversity
                                                                        of our fleet, and depth of
                                                                        customer relationships

                                                                                                           11
GATX Rail International Overview
2019 OVERVIEW

FLEET COUNT                                                                                                   GRE FLEET UTILIZATION

24,500+ in Europe (GRE)                                                                       100%
                                                  25%                                                                                              99%
4,000+ in India and Russia                                                                    99%

CAR TYPE COUNT                                                                                98%
                                                                                                           97%        97%    97%           97%
35+                                                      INDUSTRIES                           97%
                                                                                        48%
                                                           SERVED                             96%
AVERAGE FLEET AGE (GRE)                                                                              96%                            96%
                                                12%
                                                                                              95%
18 Years                                                                                                      95%        95%
                                                                                              94%
NUMBER OF CUSTOMERS
                                                                                              93%
                                                           15%
230+                                                                                          92%

MAJOR COUNTRIES OF OPERATIONS                                                                 91%

Germany, Poland, Austria, India, Switzerland,             Mineral Oil                         90%
The Netherlands, Czech Republic, Hungary and                                                           2007    2009   2011   2013   2015    2017   2019
                                                          Liquefied Petroleum Gas
France
                                                          Chemicals
                                                          Freight & Intermodal

                                                      Based on 2019 GRE Railcar Fleet

                                                                                                                                                          12
GATX Rail India Overview
                          GATX obtained the first-ever wagon leasing license in 2012 and is the
                                         largest private railcar lessor in India.

                      GATX’s GROWTH IN INDIA                                                              KEY ATTRIBUTES

             $140                                          $15                                                        Wholly Owned Fleet of
                                                           $14                 High Growth Opportunity
             $120                                          $13
                                                                                                                        ~4,000 railcars
                                                           $12                     Actively seeks attractive
                                                                                                                  Serving customers in the automotive,
                                                           $11                 investment opportunities to grow
             $100                                                                                                  container, steel, cement, and bulk
                                                           $10                       and diversify the fleet
                                                           $9                                                         commodities transport sector
$ MILLIONS

                                                                  $ MILLIONS
             $80
                                                           $8
                                                           $7
             $60
                                                           $6
                                                           $5
             $40                                                                                                       Local Technical and
                                                           $4
                                                                                 Strong Utilization and
                                                           $3                                                        Operational Capabilities
             $20                                           $2                      Long Lease Term
                                                           $1                                                           Leverages GATX’s fleet
                                                                                  100% fleet utilization with
               $0                                          $0                                                      management expertise to generate
                                                                               average remaining lease term of
                                                                                                                     competitive advantages and
                                                                                    approximately 6 years
                                                                                                                      premium customer services

                    NBV (left axis)   Lease Income (right axis)

                                                                                                                                               As of 9/30/2020

                                                                                                                                                        13
Portfolio Management Overview
                                                                                 RRPF PRE-TAX INCOME
                                                                                    (GATX’s SHARE)
                         3%
                                                                                                                                                           6%
                                                                                                                                                 4%
                                                                          $100
           18%                                                                                                                                 4%
                                                                                                                                                                                31%
                                                                                                                                           9%
                                                                           $80                                                                             RRPF
                      ASSET                                                                                                                               ENGINE
                       MIX                                                                                                               9%                TYPES

                                                             $ MILLIONS
                                                                           $60

                                   79%                                                                                                           16%                      21%

                                                                           $40

                 Aircraft Spare Engine                                                                                               Trent XWB (A350)                    V2500 (A320)
                 Leasing Affiliates (RRPF)
                                                                                                                                     Trent 700 / 7000 (A330)             CFM 56 / LEAP (A320 / B737)
                 Marine Equipment
                                                                           $20                                                       Trent 1000 (B787)                   Trent 800 (B777)
                 Other
                                                                                                                                     Trent 900 (A380)                    Other

Based on NBV of $653.7 million; GATX’s investments in RRPF                 $0                                                           Based on NBV of approximately $5.0 billion; 100% of
          accounted for using the Equity Method                                                                                                          RRPF’s portfolio
                                                                                 2001 2003 2005 2007 2009 2011 2013 2015 2017 2019

                                                                                                                                                                                              As of 12/31/2019

                                                                                                                                                                                                         14
RRPF: Key Attributes
                                          RRPF AFFILIATES ENTERED THE COVID-19 CRISIS FROM A
2019 OVERVIEW                                           POSITION OF STRENGTH.

ENGINE COUNT

478
                                             Engine Portfolio                   Operating Flexibility
ENGINE TYPE COUNT                     Diverse portfolio established over     Low operating cost base and full
10+                                   years of consistent and disciplined    discretion on capital expenditure
ENGINE TYPE MIX                                   investment                     (for new engine investments)

Approximately 87% Wide-Body and 13%
Narrow-Body

AVERAGE ENGINE AGE

11 Years
                                                                            Balance Sheet and Liquidity
TYPICAL LEASE TERM                         Renewal Schedule
3 to 12 Years                                                                Long-dated debt maturity profile,
                                      No material concentration of lease
                                                                            and commitment to preserving cash
                                        expirations in any single year
                                                                              and maintaining strong liquidity

                                                                                                                 15
Financial Highlights

                  122
                  YEARS OF
                 EXPERIENCE

                              16
GATX is Well Positioned with Strong Cash Flows
                     GATX has nearly $3.2 billion in                                                                                        Our strong operating cash flow provides
                    committed future lease receipts.                                                                                        tremendous capital allocation flexibility.

               $954

                                $735

                                                                                                                                                                                              $482

                                                                                                                                                                                                     $224
                                                                                                                               $ MILLIONS
$ MILLIONS

                                                                                                                                                                              $385

                                                                                                                                                                                                                     $234
                                                  $555

                                                                                                                                                                                      $264
                                                                                                                                                              $154

                                                                                                                                                                                                            $166

                                                                                                                                                                                                                            $250
                                                                                                                                                                      $289
                                                                  $407

                                                                                                                                                      $84
                                                                                                                                             $68
                                                                                                    $304
                                                                                   $269

                                                                                                                                                                                              $542
                                                                                                                                                                              $411

                                                                                                                                                                                                     $629
                                                                                                                                                                                     $458
                                                                                                                                                                      $370
                                                                                                                                                              $307
                                                                                                                                                      $244
                                                                                                                                             $267

                                                                                                                                                                                                            $454

                                                                                                                                                                                                                     $485

                                                                                                                                                                                                                            $426
                2020             2021             2022             2023             2024         Thereafter                                 2009     2010    2011    2012    2013    2014    2015    2016 2017* 2018* 2019*

                                                                                                                                                        Operating Cash Flow                     Portfolio Proceeds

                      GATX COMMITTED FUTURE LEASE RECEIPTS
                                                                                                                                                    OPERATING CASH FLOW & PORTFOLIO PROCEEDS
                          FROM CONTINUING OPERATIONS
   As of 12/31/2019
   *2017-2019 reflects continuing operations. The information for 2016 and prior has not been recast for discontinued operations presentation.

                                                                                                                                                                                                                                   17
Capital Allocation Framework
        PRIORITY 1
         Invest in core, service-intensive assets to maximize shareholder value
         $9.3 billion** of investments over the period shown

                                                                                                 INVESTMENT VOLUME

                                                                                                                                       $1,031
                                                                                                                                                                      $928
                                                                                                                       $860
                                  $781                                                               $770
                                                                                                                                                $715                          $723
     $ MILLIONS

                  $634                                                                                                                                 $621
                                                                    $585             $615                                                                     $589
                                                   $480

                  2007            2008             2009            2010             2011             2012             2013             2014     2015   2016   2017*   2018*   2019*

*2017-2019 reflects continuing operations. The information for 2016 and prior has not been recast for discontinued operations presentation.
**Investment volume and non-cash items

                                                                                                                                                                                      18
Capital Allocation Framework
     PRIORITY 2
      Optimize the balance sheet
      Maintain a solid investment grade rating of BBB/Baa2
      Maintain capacity for opportunistic investments

                                                                  LEVERAGE & REDUCTION OF SECURED ASSETS
    5.0x                                                                                                                                                                                                      50%
    4.5x                                                                                                                                                                                                      45%
    4.0x                                                                                                                                                                                                      40%
    3.5x                                                                                                                                                                                                      35%
    3.0x                                                                                                                                                                                                      30%
    2.5x                                                                                                                                                                                                      25%
    2.0x                                                                                                                                                                                                      20%
    1.5x                                                                                                                                                                                                      15%
    1.0x                                                                                                                                                                                                      10%
    0.5x                                                                                                                                                                                                      5%
    0.0x                                                                                                                                                                                                      0%
               2003        2004        2005        2006        2007         2008        2009        2010        2011        2012        2013         2014        2015        2016        2017   2018   2019

                                                            Recourse Debt*/Equity                                                    % of Assets that are Secured

*Total Recourse Debt = On-Balance Sheet Recourse Debt + Off-Balance Sheet Recourse Debt + Capital Lease Obligations + Commercial Paper and Bank Credit Facilities, Net of Unrestricted Cash
(In accordance with the new lease accounting standard, off-balance sheet assets and recourse debt are no longer applicable beginning in 2019)

                                                                                                                                                                                                                    19
Capital Allocation Framework
        PRIORITY 3
         In lockstep with Priorities 1 and 2, return excess cash to shareholders
         Over the period shown below, $2.0 billion returned to shareholders

                                              CASH RETURNED TO SHAREHOLDERS
             $2,500

             $2,000
$ MILLIONS

             $1,500

             $1,000

              $500

                $0
                      2007   2008   2009     2010      2011   2012   2013     2014       2015         2016   2017   2018   2019

                                       Cumulative Dividends             Cumulative Share Repurchase

                                                                                                                                  20
GATX Financial Highlights
               Income Per Diluted Share, Adjusted**

                                                                                                                                                     $5.77
                                                                                                                              $5.37
                                                                                                                                                                                         $4.67              $4.89
                                                                                                        $4.48                                                          $4.41
                                                                                   $3.50
                                                             $2.81
                                        $2.01
                  $1.59

                   2010                 2011                  2012                 2013                  2014                  2015                  2016              2017*             2018*              2019*

               Return on Equity, Adjusted**                                                                                    Investment Volume

                                                                  18%       18%                                                                                        $1,031
                                                         15%                                                                                                                                         $928
                                                                                               14%       14%                                                    $860
                                               13%                                    13%                                                                $770                                                $723

                                                                                                                              $ MILLIONS
                                                                                                                                                                                $715
                                     11%                                                                                                   $585   $615                                 $621   $589
                            9%
                  7%

                 2010      2011      2012      2013     2014      2015      2016     2017      2018      2019                              2010   2011   2012   2013   2014     2015   2016 2017* 2018* 2019*

*2017-2019 reflects continuing operations. The information for 2016 and prior has not been recast for discontinued operations presentation.
**Non-GAAP - excludes tax adjustments and other items. See Reconciliation of Non-GAAP Measures.

                                                                                                                                                                                                                    21
Appendix

            122
            YEARS OF
           EXPERIENCE

                        22
GATX Investment Highlights
     Disciplined Management Team
                                                         Leading Market Position
focused on the long-term and experienced in
managing the business across market cycles        in most of the major rail markets globally

     Highly Diversified Railcar Fleet
                                                  Full-Service Maintenance Capabilities
  with approximately 160 car types serving
 nearly 600 commodities spread across 850        valued by customers across North America
         customers in North America                             and Europe

 Tank Cars & Specialty Covered Hoppers
                                                   High Level of Committed Cash Flow
 make up a large part of the fleet and have a
                                                 via contractual lease receipts from a diverse
heavy service component that supports stable
                                                              base of customers
  customer relationships and fleet utilization

Commitment to Return Excess Capital to                     Strong Balance Sheet
             Our Owners                             Ample liquidity and well-positioned to
 2020 marks our 102nd consecutive year of            capitalize on attractive investments
           paying a dividend                                       that arise

                                                                                                 23
Environmental, Social, and Governance Efforts

                             ENVIRONMENTAL,
                                                                               SOCIAL                                    GOVERNANCE
                           HEALTH & SAFETY (EHS)

           Efficient Transportation                        People                                       Board Leadership
            Moving freight via rail is three to four       Policies and programs in place to           Eight of our nine directors are independent
             times more efficient compared to moving         encourage diversity and inclusion,          Independent lead director as well as
             via trucks1, with less greenhouse gas           including:                                   independent audit, governance, and
             emissions, and reduced noise and traffic          • Training and development                 compensation committees
             congestion                                        • Diverse candidate slates and            Two female board members; recognized
                                                                 interviewers for management hiring       as a “Winning” company by 2020 Women
           Continuous Improvement                              • Flexible work arrangements               on Boards
            Since 2010, GATX has added over 20 EHS            • Paid parental leave
             & Quality headcount to increase efficiency        • Pay equity audits                      Executive Compensation
             across our operations to minimize our          Recognized as a “Top Workplace” by          Reflects business cyclicality, with direct
             environmental impact                            Chicago Tribune                              link to company financial and operating
                                                                                                          performance and creation of long-term
           Railcar and Employee Safety                                                                    shareholder value
            Certified Responsible Care® Partner since     Community
             2005 & won Partner of the Year Award in        TankTrainer™ provides learning to over     Risk Management
             2010 & 2017                                     17,000 first responders, customers, rail    Board oversight of Company’s robust
              • Goals in key metrics are continually         industry participants, and employees         internal processes and controls designed
                measured and refined                        Leading supporter of Make-A-Wish             to facilitate the identification and
            54% reduction in Total Recordable               Illinois, Big Shoulders Fund, and Shedd      management of enterprise risks
             Incident Rate in Rail N.A. over six years       Aquarium

(1) Source: Association of American Railroads, July 2019

                                                                                                                                                        24
North America – Industry Ownership
 Approximately 1.6 million railcars

    RAILROADS (16%)                                     LESSORS (55%)
     Ownership of railcars has been                     Shift from railroad- and shipper- owned
      declining                                           railcars to lessors
     Virtually no tank car ownership due                Lessors dominate the tank car segment
      to complexities and regulations                     due to complex services and compliance
     Focus of capital investment                                  requirements
                                                  16%
      on infrastructure

                                            19%
                                                         55%
    SHIPPERS (19%)                                                 TTX (10%)
     Shipper market share has                  10%
                                                                  Railroad-owned equipment pool
      been relatively constant since                               focused on box, flat, intermodal, and
      2008 at ~19%                                                 gondola cars
     Alternative focus of capital on core business               Overall market share has remained
      versus railcar investments                                   steady since 2008 at ~10% of the
     Railcar maintenance and management not a                     North American fleet
      core competency
                                                                                                           UMLER as of July 2020

                                                                                                                      25
North America – Industry Fleet and Ownership Mix

     RAILCARS BY TYPE                             TANK CAR OWNERSHIP SHARE
     (Approximately 1.6 million railcars)

                                                           19%
                 4%                                 0%
           7%                                                                       Lessor
                                                                                    Shipper/Other
     8%
North America – Lessor Market Share
  LESSOR OWNERSHIP SHARE                                    TANK CAR LESSOR OWNERSHIP SHARE
  (Based on approximately 909,000 lessor-owned railcars)

                                                                    2%        12%                   GATX
                                                                                     17%
                                                                                                    Union Tank Car
                                  13%                                   8%                          Trinity
             25%                                                               17%                  CIT
                                                                    10%        GATX                 SMBC
                                                 15%                                      33%       Wells Fargo Rail
                      13%                                                    18%                    Other

        6%            GATX                                                                       Based on approximately 353,000
                                                                                                 lessor-owned tank cars

             13%
                                             14%           FREIGHT CAR LESSOR OWNERSHIP SHARE

                            14%                                                     11%              GATX
                                                                                                     Wells Fargo Rail
                                                                        33%
                                                                                                     CIT
         GATX                              CIT                                 11%         23%
                                                                                                     Trinity
         Wells Fargo Rail                  SMBC                                GATX                  SMBC
         Union Tank Car                    Other
                                                                                                     Union Tank Car
         Trinity
                                                                   2%                                Other
                                                                                     15%
                   UMLER as of July 2020
                                                                    5%        11%                Based on approximately 555,000
                                                                                                 lessor-owned freight cars

                                                                                                                                  27
North America – Industry Shipments & Carloadings
  INDUSTRY SHIPMENT COMPOSITION                                                                           CARLOADS ORIGINATED
 (Based on 2019 U.S and Canadian carloads of approximately 17.2 millions)                                        (United States and Canada)

                                                                                       22

                                                                                            21.1
                                                                                                   21.0
                     22%                                                               21
                                                      27%

                                                                                       20
             3%
             3%                                                                                                     19.1

                                                                            MILLIONS
              5%                                                                       19                                      18.7
                                                         14%                                                                                  18.2
                  6%
                                                                                       18
                         7%                                                                                                                          17.5
                                        13%                                                                                                                    17.2
                                                                                                          17.1
                                                                                       17
              Coal & Coke                       Forest & Paper Products
              Farm Products                     Metals
              Chemicals                                                                16
                                                Food / Kindred
                                                                                            2005   2007   2009      2011       2013           2015   2017      2019
              Petroleum Products                All Other
              Auto
               Association of American Railroads as of 12/31/2019

                                                                                                                                                        As of 12/31/2019

                                                                                                                                                                      28
North America – Industry Railcar Deliveries

          25,000

          20,000

                                                                                                                                          YTD
          15,000                                                                                                                         Total:
                                                                                                                                         27.2k

          10,000

            5,000

                 -
                           ’05          ’06   ’07   ’08   ’09      ’10    ’11    ’12      ’13      ’14     ’15   ’16   ’17   ’18   ’19   ‘20

                                                                Number of Tank         Number of Freight

Railway Supply Institute as of October 2020

                                                                                                                                                  29
North America – Industry Railcar Orders

          50,000

          45,000

          40,000

          35,000

          30,000

          25,000

          20,000
                                                                                                                                          YTD
          15,000                                                                                                                         Total:
                                                                                                                                         13.9k
          10,000

            5,000

                 -
                           ’05          ’06   ’07   ’08   ’09      ’10    ’11    ’12       ’13     ’14     ’15   ’16   ’17   ’18   ’19   ‘20

                                                                Number of Tank         Number of Freight

Railway Supply Institute as of October 2020

                                                                                                                                                  30
GATX Rail North America: Diverse Fleet
               CAR TYPE                     COMMODITIES CARRIED                                                                                     % OF FLEET   % OF NBV
               General Service Tank Cars:   Liquid fertilizers, Fuel oils, Asphalt, Food-grade oils, Chemicals (styrene, glycols, etc.)
               20k-25k gallon                                                                                                                         15.3%        14.3%
               General Service Tank Cars:   Ethanol & methanol, Food-grade oils, Lubricating oils, Light chemicals,
                                                                                                                                                      15.5%        22.6%
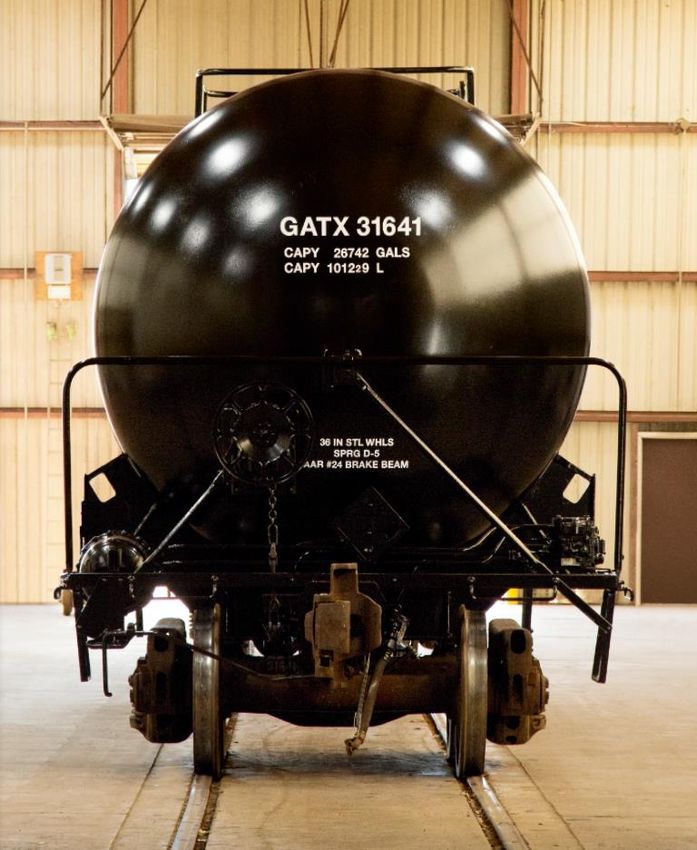
               >25k gallon                  Light petroleum products (crude oil, fuel oils, diesels, gasoline, etc.)
TANK CARS

               High-Pressure Tank Cars      LPG, VCM, Propylene, Carbon dioxide                                                                       10.3%        11.7%

               General Service Tank Cars:   Molten sulfur, Clay slurry, Caustic soda, Corn syrup
                                                                                                                                                       5.5%         5.3%
               13k-19k gallon

               Other Specialty Tank Cars    Acids (sulfuric, hydrochloric, phosphoric, acetic, nitric, etc.), Coal tar pitch, Specialty chemicals      5.0%         4.6%

               Total Tank                                                                                                                             51.6%       58.5%

               Boxcars                      Paper products, Lumber, Canned goods, Food and beverages                                                  12.8%         5.4%

               Open-top Cars                Aggregates, Coal, Coke, Woodchips, Scrap metal, Steel coils                                                7.1%         6.2%
FREIGHT CARS

               Gravity Covered Hoppers:     Grain, Sugar, Fertilizer, Potash, Lime, Soda ash, Bentonite
                                                                                                                                                      10.1%         9.8%
               >4k cubic feet

               Pneumatic Covered Hoppers    Plastic pellets                                                                                            5.5%         3.1%

               Gravity Covered Hoppers:     Sand, Cement, Roofing granules, Fly ash, Dry chemicals
                                                                                                                                                       4.3%         4.6%
GATX Rail North America: Continuous Investment

                           $6.0                                                                                                                                                                         130
                                                        Car count increased 7%                                                                                                            $5.7
                                                         Assets increased 37%                                                                                                                    $5.6
                                                                                                                                                                                                        120
                           $5.5                                                                                                                                        $5.4
                                                                                                                                                      $5.2
                                                                                                                                     $5.1                                                               110

                                                                                                                                                                                                              RAILCARS IN THOUSANDS
    ASSETS IN $ BILLIONS

                                                                                                                    $5.0
                           $5.0
                                                                                                                                                                                                        100
                                                                                                   $4.6
                                                                $4.4             $4.5
                           $4.5                                                                                                                                                                         90
                                               $4.2
                                  $4.1
                                                                                                                                                                                                        80
                           $4.0
                                                                                                                                                                                                        70
                           $3.5
                                                                                                                                                                                                        60

                           $3.0                                                                                                                                                                         50
                                  2009         2010             2011             2012             2013             2014             2015              2016             2017               2018   2019

                                                                                                 Assets*                   Railcars

*Assets include on- and off-balance sheet (In accordance with the new lease accounting standard, off-balance sheet assets and recourse debt are no longer applicable beginning in 2019)

                                                                                                                                                                                                                                      32
GATX Fleet Optimization Strategy
    GATX optimizes its fleet partly through selling railcars in the secondary market or scrapping them at the end of
     their useful lives. Our fleet of cost-advantaged, well-maintained modern railcars, leased to quality customers,
       allows us to realize significant remarketing income when we decide to sell cars in the secondary market.

REMARKETING INCOME (Income from sale of owned assets)
 Helps to optimize a diversified, high-performing railcar fleet
 Over the last 11 years, GATX Rail North America generated an average of approximately $46 million of remarketing income per year
  Rail North America                                    2009             2010             2011             2012    2013    2014    2015    2016    2017    2018     2019

  Approximate # of railcars sold                         700             1,400            1,800            2,000   3,700   2,700   3,900   2,700   1,600   3,200   3,600

  Remarketing income
                                                        $13.8            $17.4            $27.4            $45.7   $54.5   $62.6   $67.4   $46.3   $44.6   $66.1   $58.9
  ($ millions)

SCRAPPING GAINS
 GATX typically realizes gains when railcars are scrapped at the end of their useful lives
 Over the last 11 years, GATX Rail North America and Rail International generated an average of approximately $13 million of scrapping gains per year
  Rail North America and
  Rail International                                    2009             2010             2011             2012    2013    2014    2015    2016    2017    2018     2019

  Approximate # of railcars scrapped                    4,400            3,700            3,700            2,700   3,100   3,200   2,600   3,900   4,800   3,400   3,300

  Scrapping gains/(loss)
                                                         $9.7            $18.0            $27.0            $19.2   $20.7   $16.1   $9.5    $3.2    $8.5    $14.5   $(2.3)*
  ($ millions)

*Includes a $3.8 million scrap loss on customer damaged cars that was largely offset by an early termination fee

                                                                                                                                                                             33
GATX RAILCAR SUPPLY STRATEGY
     GATX’s Railcar Supply Strategy is to acquire railcars from a variety
             of sources versus manufacturing its own railcars.

        Combining Railcar       Adds significant volatility leading to a higher cost of capital
    Manufacturing with a        Can result in poor asset allocation within the lease fleet as cars are added simply to
 Railcar Leasing Business        optimize the manufacturing line

                              Large, multi-year orders for new cars from manufacturers
       GATX’s Sources of
                              Spot orders for new cars to meet specific customer demand
          Railcar Supply
                              Fleet acquisitions of existing cars from other lessors and customers

       Benefits of Railcar      Access to attractively priced railcars
         Supply Strategy        Ability to grow our high quality fleet and reliably meet customer demand

                                                                                                                          34
GATX Rail North America: Diverse Customer Portfolio

                                CREDIT RATINGS OF TOP
                                50 CUSTOMER FAMILIES                                                           GATX serves          Largest
                                                                                                                more than     customer represents
                                         16%
                                                                                                             850 individual     less than 6%
                                                                                                              customers       of total lease revenue
                                                                        30%

                             14%

                                                                                                                 Average       Top 20 customers
                                                                                                               relationship       account for
                                                     40%
                                                                                                              tenure of top       less than
                                                                                                              10 customers      35% of lease
                                  AAA, AA, & A                BB+ or lower                                    is 50 years          revenue
                                  BBB                         Private / Not Rated

Customer families sometimes include more than one customer account; the S&P or equivalent ratings noted
generally reflect the credit quality of the rated parent entity. Lease obligations of subsidiaries are not
necessarily guaranteed by the rated parent entity.                                                                                               As of 12/31/2019

                                                                                                                                                               35
GATX Rail North America: Maintenance Network
 GATX is known for its integrity, safety, and quality of our operations and superior execution.

     EXTENSIVE MAINTENANCE NETWORK                                      MAINTENANCE CUSTOMERS RELY ON GATX
        Eight maintenance facilities                                   In 2019, GATX Rail North America performed
                                                                        approximately 47,000 maintenance events in its owned
        Five locations with mobile units
                                                                        and third-party maintenance network
        Five customer site locations
                                                                         Using continuous improvement principles, we identify
        Third-party maintenance facilities                                  and evaluate opportunities to increase maintenance
                                                                             efficiency to minimize the time our customers are
                                                                             without their railcars

           Services range from routine maintenance and regulatory programs to car modifications and rebuilds, including: All mechanical
           repairs, interior cleaning, interior/exterior blasting, interior/exterior coatings, valve maintenance and qualification, and more.
                                                                                                                                                As of 12/31/2019

                                                                                                                                                              36
GATX Rail North America: Locomotive Leasing
      GATX owns, manages or has an interest in more than 625 Locomotives.

                                                                       LOCOMOTIVE LEASE REVENUE

                                                                                       $39    $39    $39
                                                                                $38                         $36
                                                                         $35
                                                         $34
                                                                $32

                                            $ MILLIONS
 96% are four-axle locomotives leased to:
  Regional and short-line railroads
  Industrial users
  Class I railroads                                     2012   2013     2014   2015   2016   2017   2018   2019

                                                                                                            As of 12/31/2019

                                                                                                                          37
Europe – Industry Snapshot
 Relatively limited manufacturing capacity                RAILCAR OWNERSHIP
  − Helps avoid an industry oversupply of railcars       (Based on approximately 728,000 railcars)

 Older industry fleet in need of replacement
  − Key segments continue to demonstrate need
        to replace aging, smaller, and less efficient
        railcars
                                                                                         32%
   Increasing ownership share by lessors
    −   Incumbent railroads shifting from owning
        railcars to leasing
   Green initiatives driving modal share shift
                                                             68%
    from road to rail
    −   European Commission announced goal of
        achieving climate neutrality by 2050 partly
        through shifting a substantial part of the 75%
        of inland freight carried by road onto rail
                                                              Railroads and             Lessors
    −   The German government and Deutsche Bahn               Shippers
        to invest €86 billion for the modernization of
        the country’s rail network, partly to support
        Germany’s transport sector carbon emissions       GATX management estimates as of 6/30/2020
        reduction target of 42% by 2030

                                                                                                      38
Europe – Industry Fleet and Ownership Mix
                                                                TANK CAR OWNERSHIP SHARE
                      RAILCAR OWNERSHIP
                   (Based on approximately 728,000 railcars)

                                    4%                               30%
                                                                                               Lessors
                          11%
                                                                                               Railroad & Privately Owned

                                                     31%                         70%       Based on approximately 136,000 tank cars

                    35%                                        FREIGHT CAR OWNERSHIP SHARE

                                                19%

                                                                               24%

                                                                                               Lessors
                  Flat Wagons                Covered Wagons                                    Railroad & Privately Owned
                  Tank Wagons                Other
                                                                                           Based on approximately 592,000 freight cars
                  Dry Bulk Wagons                                      76%

GATX management estimates as of 6/30/2020

                                                                                                                                         39
Europe – Lessor Market Share
                                                                      TANK CAR LESSOR OWNERSHIP SHARE
                 LESSOR OWNERSHIP SHARE
            (Based on approximately 236,000 lessor-owned railcars)

                                                                                    21%          23%        GRE
                                                                                                            VTG
                                            11%                           2%
                        24%
                                                                                          23%               Ermewa
                                                                               8%         GRE               Wascosa
                                                                                                            Touax
                                                                                13%              33%        Other
                                   11%                                                                   Based on approximately 95,000 lessor-owned tank cars
                  5%
                                   GRE               36%
                    6%                                               FREIGHT CAR LESSOR OWNERSHIP SHARE
                                                                                            3%

                             18%
                                                                                                            GRE
                                                                                25%
                                                                                                            VTG

                                                                                          3%                Ermewa
                                                                                                   39%
                  GATX Rail Europe (GRE)            Wascosa                                                 Touax
                  VTG                               Touax                      5%         GRE
                                                                                                            Wascosa
                  Ermewa                            Other                       7%                          Other
                                                                                          21%            Based on approximately 141,000 lessor-owned freight cars

GATX management estimates as of 6/30/2020

                                                                                                                                                                40
GATX Rail Europe (GRE): Major Rail Markets
                     72% of GRE’s revenue is generated in Germany, Poland, and Austria
                                 – strong rail freight transport economies.
                                                GEOGRAPHIES SERVED
               4%        11%                                                                                    13%
                                                   Germany
              4%                                                                                                                                   FLEET STRUCTURE
                                                   Poland
                                        32%
         4%                                        Austria                                             14%                                           Mineral Oil
               5%                                  Switzerland                                                                                       LPG
                                                                                                                                    56%
                                                   The Netherlands                                                                                   Chemicals
                   11%                             Czech Republic                                                                                    Freight & Intermodal
                                                                                                         17%
                                                   Hungary
                                29%
                                                   Other

                   Based on 2019 GRE Revenues                                                     Approximately 24,600 railcars as of 12/31/2019

CAR TYPE                                        COMMODITIES CARRIED

Mineral Oil                                     Light mineral oil (gasoline, jet fuel, diesel oils, light heating oils), Dark mineral oil (heavy heating oils, lubricating oils,
                                                coal tar, bitumen, asphalt), Crude oil
Liquefied Petroleum Gas (LPG)                   Propane, Butane, Propylene, Butadiene, Light carbohydrate fractions, Cooling gas mixtures
Chemicals                                       Liquid fertilizers, Acids (Hydrochloric, Sulphur, Phosphoric, etc.), Bases (Carbohydrates, Solutions, Soda lye, Sodium
                                                Hypochlorite, etc.), Aromatics (Benzene, Toluene, Xylenes, Phenol, etc.), Liquid sulphur, Hydrogen peroxide, Resins and
                                                glues, Solvents
Freight and Intermodal                          Containers/Trailers, Steel coils, Timber, Lime, Cement, Coal, Coke, Gravel, Sand, Silica sand

                                                                                                                                                                                   41
GRE: Diverse Customer Portfolio and Fleet
     GRE’s newer and higher capacity railcar fleet attracts top-tier customers.

GRE HAS INVESTED MORE THAN $1 BILLION OVER THE LAST 10 YEARS

  Today, the average remaining lease term for GRE is 2 years                        25%

    • Renewal success rates have been consistently high
    • GRE’s top five customers have done business with us for over 25 years                 TOP 20
                                                                                           CUSTOMER
  The focus on investments in freight and intermodal segments continued      5%         CREDIT RATING
    throughout 2019 as the related fleet grew by 34%                                                               70%

                                           2009           2019

     GRE Car Count                       20,000+         24,500+

     GRE Average Fleet Age                                                              Investment Grade
                                            24              18
     (years)                                                                            Speculative (BB+ or lower)
     GRE Fleet Capacity                                                                 Private/Not Rated
                                          1,485           2,046
     (thousand m³)                                                                 Top 20 customers based on 2019 revenue

                                                                                                                       As of 12/31/2019

                                                                                                                                     42
GRE: Service Offerings

MAINTENANCE                     ENGINEERING                        ASSEMBLY                        SUPPORT                           MODERNIZATION
   GRE’s goal is to ensure        Decades of engineering            GRE’s own production           Comprehensive customer           With an average age of 18
    maximum railcar                 experience                         facility, combined with         service                           years, GRE has one of the
    availability                                                       extensive modernization                                           youngest and most modern
                                   GRE can adapt special
                                                                       expertise, guarantees the
                                                                                                      Deep industry-specific
                                                                                                                                         railcar fleets in Europe
   Proven track record of          railcars in its own workshop
                                                                       highest standards in
                                                                                                       know-how combined with
    extremely high safety           to meet exact customer
                                                                       safety and quality
                                                                                                       understanding of individual      Customer-specific
    standards and technical         needs                                                              transportation needs              adaptations and additional
    expertise
                                   GRE controls the entire
                                                                      Tailored solutions                                                equipment can be
                                                                                                                                         implemented in many
   A network of owned              process from conceptual
                                                                                                                                         railcar types
    workshops and certified         design to construction to
    contract partners               the delivery of new and
                                    modernized railcars
   GRE arranges for the
    cleaning of tanks and
    freight cars combined
    with scheduled repairs to
    minimize downtime

                                                                                                                                                                      43
India – Industry Overview
      Indian Railways has a number of initiatives in progress to increase freight
                           rail modal share in the country.

RAILCAR OWNERSHIP                                  FREIGHT RAIL TRANSPORT
 (Based on approximately 300,000)        Significant Potential
                                          −   Large railway network, dominated by passenger
                   10%                        service today
                                          −   Commodities move long distances
                                          −   Developing manufacturing and import/export
                                              market
                                          −   Inefficient highway system
                                         Government Support
            90%                           −   Stated target of 50% freight rail modal share by
                                              2030 (currently ~30-35% rail vs. ~60% road)
                                          −   Developing initiatives to encourage more private
Indian Railways     Privately owned           ownership and leasing of railcars
                                          −   Approved construction of several dedicated freight
                                              corridors, with the Eastern and Western routes
                                              (combined cost of ~$12.5 billion) expected to be
                                              commissioned by 2022
                                                                                                   As of 3/31/2020

                                                                                                                 44
Aircraft Spare Engine Leasing Industry Overview

   Aircraft spare engines are very attractive and
    reliable leasing assets
    − Robust residual value characteristics
    − Retain value better over the long term compared to
      aircraft
   Aircraft engines need regular scheduled
    maintenance (3-5 year intervals) which takes
    between 90 and 120 days
    − Correct level of spare engines are maintained to ensure
       the fleet remains operationally undisrupted
    − Spare engine ratio to engines installed on aircraft
       recommended by manufacturers
        o 8-10% narrow body
        o 10-15% wide body

                                                                45
RRPF Affiliates Overview
     RRPF is a leading worldwide lessor of aircraft spare engines.

                 OVERVIEW
                                                                       4% 6%
                  GATX established its first                        4%
                   partnership with Rolls-Royce plc in
                                                                                                   31%
                   1998                                            9%
                                                                                 RRPF
                  Total NBV of engines upon RRPF                               ENGINE
                   establishment was $350 million;               9%              TYPES
                   today the NBV is approximately
                   $5.0 billion
                                                                       16%                   21%
                  RRPF affiliates lease aircraft spare
                   engines to commercial airlines and
                   Rolls-Royce plc
                                                          Trent XWB (A350)                   V2500 (A320)
                                                          Trent 700/7000 (A330)              CFM 56/LEAP (A320/B737)
                                                          Trent 1000 (B787)                  Trent 800 (B777)
                                                          Trent 900 (A380)                   Other

                                                                 Based on NBV of approximately $5.0 billion;
                                                                          100% of RRPF’s portfolio

                                                                                                               As of 12/31/2019

                                                                                                                             46
RRPF: Growth in Revenue & Net Book Value
 CAGRs of 15.5% and 14.2% for NBV and Total Annual Revenue, respectively, since 1998.

                                                                                                         2019

                                                                                                      NBV: $5,016M
                                                                                                      Rev: $470M
                  $6,000                                                                                               $500
                                                                                                                       $450
                                  1998
                  $5,000
                                                                                                                       $400
                           NBV: $243M

                                                                                                                              REVENUE (MILLIONS)
                                                                                                                       $350
 NBV (MILLIONS)

                  $4,000   Rev: $29M
                                                                                                                       $300
                  $3,000                                                                                               $250
                                                                                                                       $200
                  $2,000
                                                                                                                       $150
                                                                                                                       $100
                  $1,000
                                                                                                                       $50
                     $0                                                                                                $0
                           1999      2001   2003   2005   2007   2009     2011      2013       2015     2017    2019

                                                    NBV                 Total Annual Revenue

                                                                                                                                                   As of 12/31/2019

                                                                                                                                                                 47
Reconciliation of Non-GAAP Measures

                 122
                 YEARS OF
                EXPERIENCE

                                      48
Reconciliation of Non-GAAP Measures:
      Net Income Measures
Net Income                                                                                                  2010              2011              2012               2013               2014               2015               2016               2017               2018               2019
(in millions)

Net income (GAAP)                                                                                     $            80.8 $            110.8 $           137.3 $            169.3 $            205.0 $            205.3 $            257.1 $            502.0 $            211.3 $            211.2
Less: Net income from discontinued operations (GAAP)                                                                n/a                n/a               n/a                n/a                n/a                n/a                n/a               34.2               20.8               30.4
Net income from continuing operations (GAAP)                                                          $            80.8 $            110.8 $           137.3 $            169.3 $            205.0 $            205.3 $            257.1 $            467.8 $            190.5 $            180.8
Adjustments attributable to pre-tax income from continuing operations:
  Cost attributable to the closure of a maintenance facility at Rail International                                   -                  -                 -                  -                  -                  -                  -                   -                9.5                 -
  Net loss (gain) on wholly owned Portfolio Management marine investments                                            -                  -                 -                  -                  -                 9.2                2.5                (1.8)               -                  -
  Railcar impairment at Rail North America                                                                           -                  -                 -                  -                  -                  -                29.8                  -                 -                  -
  Residual sharing settlement at Portfolio Management                                                                -                  -                 -                  -                  -                  -               (49.1)                 -                 -                  -
  Early retirement program                                                                                           -                  -                 -                  -                  -                 9.0                 -                   -                 -                  -
  Litigation recoveries                                                                                            (6.5)              (3.2)               -                  -                  -                  -                  -                   -                 -                  -
  Leveraged lease adjustment                                                                                         -                (5.5)               -                  -                  -                  -                  -                   -                 -                  -
Total adjustments attributable to pre-tax income from continuing operations                           $            (6.5) $            (8.7) $             -    $             -    $             -    $           18.2 $            (16.8) $             (1.8) $            9.5 $               -
Income taxes thereon, based on applicable effective tax rate                                          $             2.4 $              2.0 $              -    $             -    $             -    $           (6.9) $             7.2 $               0.7 $            (3.1) $              -

Other income tax adjustments attributable to income from continuing operations:
 Income tax rate changes                                                                                             -                  -                0.7                 -                  -                14.1                 -                   -                 -                (2.8)
 Impact of the Tax Cuts and Jobs Act of 2017                                                                         -                  -                 -                  -                  -                  -                  -               (293.2)            (16.7)                -
 Foreign tax credit utilization                                                                                      -                  -               (4.6)              (3.9)                -                  -                (7.1)                 -               (1.4)                -
 GATX income taxes on sale of AAE                                                                                    -                  -                 -                23.2                 -                  -                  -                   -                 -                  -
 Tax benefits upon close of tax audits                                                                             (9.5)              (4.8)            (15.5)                -                  -                  -                  -                   -                 -                  -
Total other income tax adjustments attributable to income from continuing operations                  $            (9.5) $            (4.8) $          (19.4) $            19.3 $               -    $           14.1   $           (7.1) $           (293.2) $          (18.1) $            (2.8)

Adjustments attributable to affiliates' earnings from continuing operations, net of taxes:
 Net loss (gain) on Portfolio Management marine affiliate                                                            -                  -                 -                  -                  -                11.9               (0.6)                -                  -                  -
 Income tax rate changes                                                                                           (1.9)              (4.1)             (4.6)              (7.6)                -                (7.7)              (3.9)                -                  -                  -
 Pre-tax gain on sale of AAE                                                                                         -                  -                 -                (9.3)                -                  -                  -                  -                  -                  -
 Interest rate swaps at AAE                                                                                         9.3               (0.2)             20.5               (6.9)                -                  -                  -                  -                  -                  -
Total adjustments attributable to affiliates' earnings from continuing operations, net of taxes       $             7.4 $             (4.3) $           15.9 $            (23.8) $              -    $            4.2 $             (4.5) $              -    $             -    $             -

Net Income from continuing operations, excluding tax adjustments and other items (non-GAAP)           $            74.6   $          95.0   $          133.8   $          164.8   $          205.0   $          234.9   $          235.9   $          173.5   $          178.8   $          178.0

Adjustments attributable to discontinuing operations, net of taxes:
 Net casualty gain at ASC                                                                                           n/a               n/a               n/a                n/a                n/a                n/a                n/a                   -                 -                (8.1)
 Impact of the Tax Cuts and Jobs Act of 2017                                                                        n/a               n/a               n/a                n/a                n/a                n/a                n/a                (22.7)              0.2                 -
Total adjustments attributable to discontinued operations, net of taxes                                             n/a               n/a               n/a                n/a                n/a                n/a                n/a $              (22.7) $            0.2 $             (8.1)
Net income from discontinued operations, excluding tax adjustments and other items (non-GAAP)                       n/a               n/a               n/a                n/a                n/a                n/a                n/a $               11.5 $            21.0 $             22.3

Net income from consolidated operations, excluding tax adjustments and other items (non-GAAP)         $            74.6 $            95.0 $            133.8 $            164.8 $            205.0 $            234.9 $            235.9 $            185.0 $            199.8 $            200.3

Note: The information for 2010-2016 in the tables above has not been recast for discontinued operations presentation.

                                                                                                                                                                                                                                                                                             49
Reconciliation of Non-GAAP Measures:
        Earnings Per Share

Earnings per Share                                                                                                          2010      2011      2012      2013      2014      2015      2016      2017      2018      2019

Diluted earnings per share from continuing operations (GAAP)                                                            $    1.72 $    2.35 $    2.88 $    3.59 $    4.48 $    4.69 $    6.29 $ 11.88 $      4.98 $    4.97
Diluted earnings per share from discontinued operations (GAAP)                                                                n/a       n/a       n/a       n/a       n/a       n/a       n/a    0.87        0.54      0.84
Diluted earnings per share from consolidated operations (GAAP)                                                          $    1.72 $    2.35 $    2.88 $    3.59 $    4.48 $    4.69 $    6.29 $ 12.75 $      5.52 $    5.81

Diluted earnings per share from continuing operations, excluding tax adjustments and other items (non-GAAP)             $    1.59 $    2.01 $    2.81 $    3.50 $    4.48 $    5.37 $    5.77 $    4.41 $    4.67 $    4.89
Diluted earnings per share from discontinued operations, excluding tax adjustments and other items (non-GAAP)                 n/a       n/a       n/a       n/a       n/a       n/a       n/a      0.29      0.55      0.62
Diluted earnings per share from consolidated operations, excluding tax adjustments and other items (non-GAAP)           $    1.59 $    2.01 $    2.81 $    3.50 $    4.48 $    5.37 $    5.77 $    4.70 $    5.22 $    5.51

Note: The information for 2010-2016 in the tables above has not been recast for discontinued operations presentation.

                                                                                                                                                                                                                      50
Reconciliation of Non-GAAP Measures:
    Balance Sheet Measures

On- and Off-Balance Sheet Assets                        2010         2011         2012         2013         2014         2015        2016         2017         2018           2019

Total assets (GAAP)                                   $ 5,442.4 $ 5,846.0 $ 6,044.7 $ 6,535.5 $ 6,919.9 $ 6,894.2 $ 7,105.4 $ 7,422.4 $ 7,616.7 $ 8,285.1
 Off-balance sheet assets (1):
   Rail North America                                   968.1   884.5   863.5   887.9   606.1   488.7   456.5   435.7   430.2                                                     -
   Portfolio Management                                   3.4     2.6      -       -       -       -       -       -       -                                                      -
   Discontinued operations                                 -       -     21.0    16.5    11.7     6.8     2.6      -       -                                                      -
Total off-balance sheet assets                        $ 971.5 $ 887.1 $ 884.5 $ 904.4 $ 617.8 $ 495.5 $ 459.1 $ 435.7 $ 430.2                                             $       -

Total assets, as adjusted (non-GAAP)                  $6,413.9     $6,733.1     $6,929.2     $7,439.9     $7,537.7     $7,389.7    $7,564.5     $7,858.1     $8,046.9     $8,285.1

(1) Off-balance sheet assets apply to each of the years 2018 and prior. In accordance with the new lease accounting standard, off-balance sheet assets are no longer applicable
beginning in 2019.

                                                                                                                                                                                  51
You can also read