1H21 Results Presentation - 27 August 2021 Hadyn Stephens - CEO Kerri Leech - CFO - Open Briefing

Page created by Jessie Jordan
 
CONTINUE READING
1H21 Results Presentation - 27 August 2021 Hadyn Stephens - CEO Kerri Leech - CFO - Open Briefing
1H21 Results Presentation
27 August 2021
Hadyn Stephens – CEO
Kerri Leech – CFO
1H21 Results Presentation - 27 August 2021 Hadyn Stephens - CEO Kerri Leech - CFO - Open Briefing
Important Notice and Disclaimer

 This presentation has been prepared by Waypoint REIT (“WPR” or                Industry data and third party market data                                            exchange rates, competition in the markets in which WPR operates
 “Waypoint REIT”) which is a stapled entity comprising shares in               This presentation contains statistics, data and other information relating           and the inherent regulatory risks in the business of WPR such forward
 Waypoint REIT Limited (ABN 35 612 986 517) (“Company”) stapled                to markets, market sizes, market shares, market positions and other                  looking statements, and many of these factors are beyond WPR’s
 with units in the Waypoint REIT Trust (ARSN 613 146 464) (“Trust”).           industry data pertaining to WPR’s business and markets. You should                   control.
 VER Limited (ABN 43 609 868 000 and AFSL 483795) is the                       note that market data and statistics are inherently predictive and
 Responsible Entity of the Trust. The information provided in this             subject to uncertainty and not necessarily reflective of actual market               You should rely on your own independent assessment of any
 presentation should be read in conjunction with WPR's other periodic          conditions.                                                                          information, statements or representations contained in this
 and continuous disclosure announcements lodged with the ASX which                                                                                                  presentation and any reliance on information in this presentation will be
 are available at www.asx.com.au.                                              Future performance and forward looking statements                                    entirely at your own risk. This presentation may not be reproduced or
                                                                               This presentation contains forward-looking statements, including                     published, in whole or in part, for any purpose without the prior written
 Summary information                                                           statements regarding the plans, strategies and objectives of WPR                     permission of WPR. WPR disclaims any intent or obligation to update
 The information in this presentation is in summary form and does not          management, distribution guidance. Forward looking statements can                    publicly any forward-looking statements, whether as a result of new
 purport to be complete. This presentation is for information purposes         generally be identified by the use of forward looking words such as,                 information, future events or results or otherwise.
 only, is of a general nature, does not constitute financial product           'expect', 'anticipate', 'likely', 'intend', 'should, 'could', 'may', 'predict',
 advice, nor is it intended to constitute legal, tax or accounting advice or   'plan', 'propose', 'will', 'believe', 'forecast', 'estimate', 'target', ‘guidance’   Effect of rounding
 opinion. This information does not purport to include or summarise all        and other similar expressions. Indications of, and guidance or outlook               A number of figures, amounts, percentages, estimates, calculations of
 information than an investor should consider when making an                   on, future earnings or financial position or performance are also                    value and fractions in this presentation are subject to the effect of
 investment decision nor does it contain all information which would be        forward looking statements. Such prospective financial information                   rounding. Accordingly, the actual calculation of these figures may differ
 required in a Product Disclosure Statement, or other disclosure               contained within this presentation may be unreliable given the                       from the figures set out in this presentation.
 documents prepared in accordance with the requirements of the                 circumstances and the underlying assumptions to this information may
 Corporations Act 2001 (Cth) (“Corporations Act”).                             materially change in the future. Any forward-looking statements,                     To the maximum extent permitted by law and subject to any continuing
                                                                               including projections, guidance on future revenues, earnings and                     obligations under the ASX listing rules, WPR and VER Limited and
 No investment or financial product advice                                     estimates, are provided as a general guide only and should not be                    each of their respective associates, related entities, officers, directors,
 This presentation has been prepared without taking into account the           relied upon as an indication or guarantee of future performance. You                 employees, agents, consultants and advisers do not accept and
 investment objectives, financial situation or particular needs of any         are cautioned not to place undue reliance on any forward looking                     expressly disclaim any liability for any loss or damage (including,
 particular person. Before making an investment decision, investors            statement. While due care and attention has been used in the                         without limitation, any liability arising out of fault or negligence and
 must consider the appropriate of the information (including but not           preparation of forward looking statements, forward-looking statements                whether direct, indirect, consequential or otherwise) arising from the
 limited to the assumptions, uncertainties and contingencies which may         involve known and unknown risks, uncertainties and other factors that                use of, or reliance on, anything contained in or omitted from this
 affect future operations of WPR and the values and the impact that            may cause WPR’s actual results, performance or achievements to                       presentation. Statements made in this presentation are made only at
 different future outcomes may have on WPR) and rely on their own              differ materially from any future results, performance or achievements               the date of the presentation. WPR is under no obligation to update this
 examination of WPR, including the merits and risks involved having            expressed or implied by these forward-looking statements.                            presentation. The information in this presentation remains subject to
 regard to their own investment objectives, financial situation and needs.                                                                                          change by WPR without notice.
 Each person should consult a professional investment adviser and          A number of important factors could cause WPR’s actual results to
 seek legal, accounting and taxation advice appropriate to their           differ materially from the plans, objectives, expectations, estimates and
 jurisdiction before making any decision regarding a financial product.    intentions expressed in such forward looking statements, and many of
                                                                           these factors are beyond WPR’s control. For example, the factors that
                                                                           are likely to affect the results of WPR include, but are not limited to,
                                                                           general economic conditions in Australia, New Zealand and Asia,

                                                                                                                                                                                                                                                  2
1H21 Results Presentation - 27 August 2021 Hadyn Stephens - CEO Kerri Leech - CFO - Open Briefing
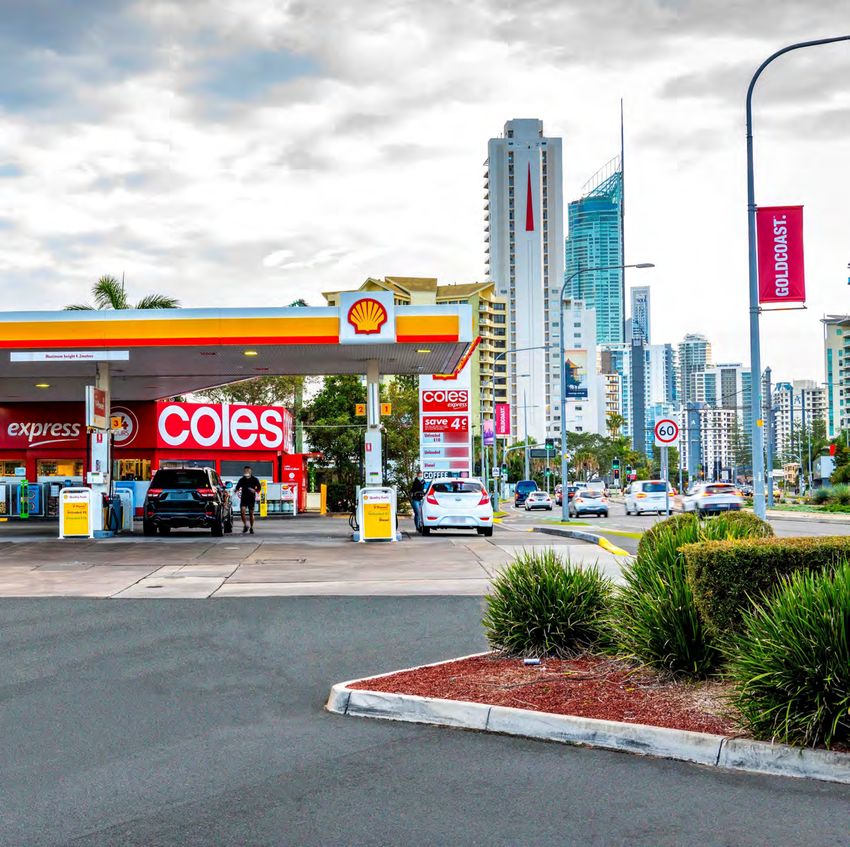
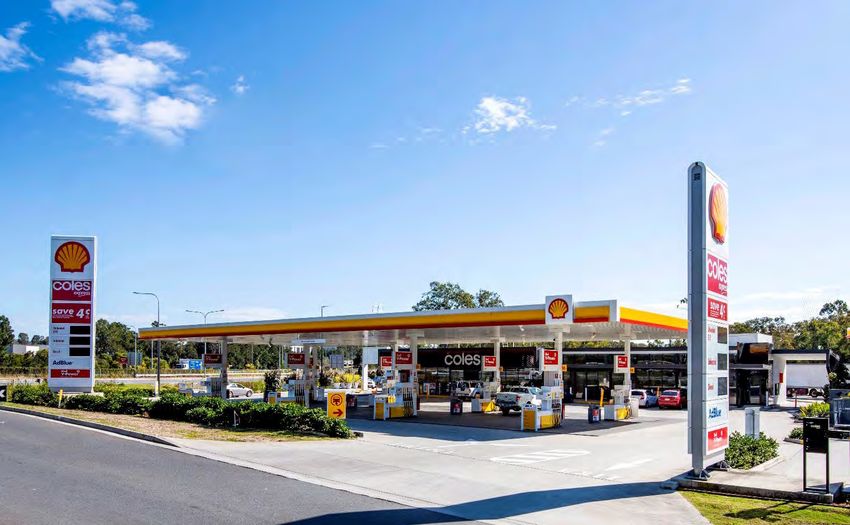
WPR Investment Proposition
 Secure rental income with embedded growth, underpinned by long-term leases to top-tier tenants

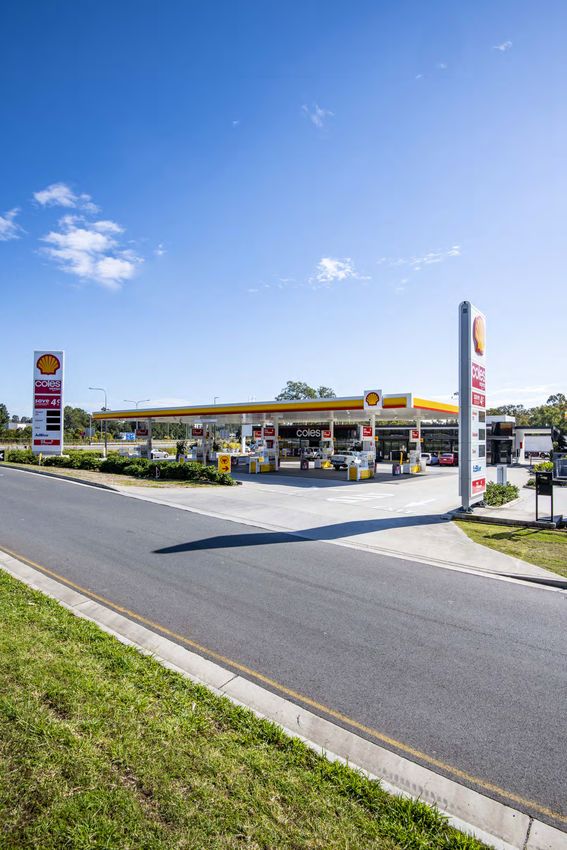
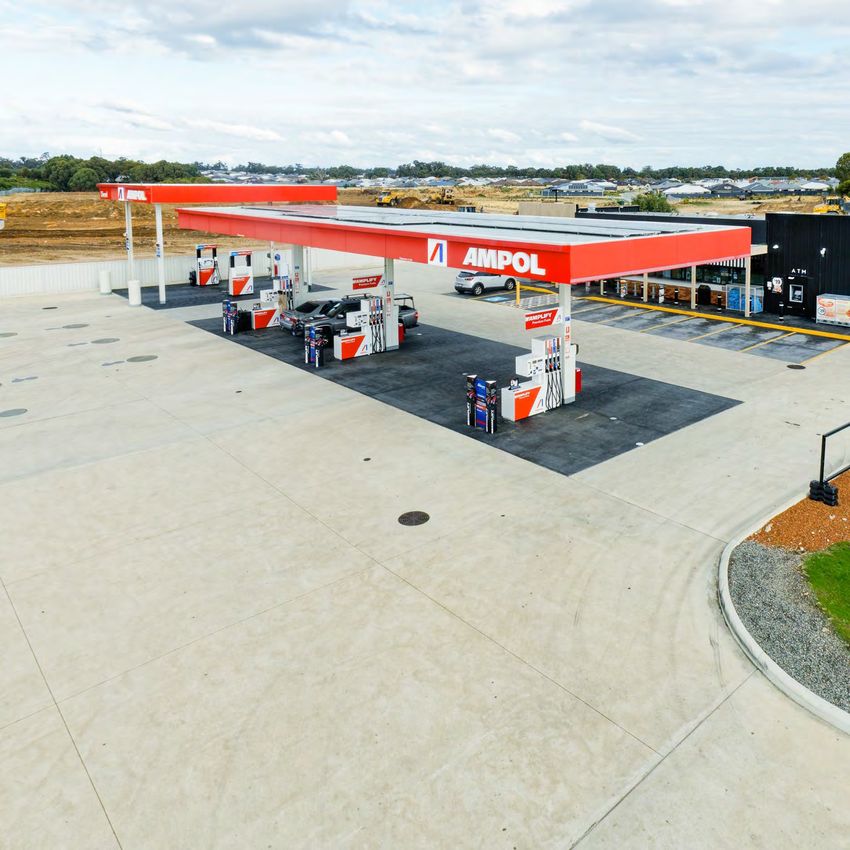
                      ESSENTIAL ECONOMIC INFRASTRUCTURE                                                                                                                        WORLD-CLASS OPERATORS
                      • Roadside retail properties catering for F&C                                                                                                            • VEA supplies approximately one-quarter of
                        operators focused on everyday needs                                                                                                                      Australia’s downstream petroleum market, and
                      • F&C tenants have continued to operate                                                                                                                    has sole rights to the Shell brand for the sale of
                        throughout COVID-19 lockdowns                                                                                                                            retail fuels in Australia
                                                                                                                                                                               • Sites operated by one of Australia’s leading
                                                                                                                                                                                 retailers, Coles (Coles Express)

IRREPLICABLE NETWORK                                                                                                                                                                   PREDICTABLE INCOME + GROWTH
• 427 F&C sites acquired/built over 100+ years                                                                                                                                         • 99.9% occupancy, 10.5-year WALE, predominantly
• Aligned with population density and concentrated in                                                                                                                                    Triple Net leases (91% by income)
  Metro locations along Australia’s eastern seaboard                                                                                                                                   • Strong organic rental growth underpinned by 2.9%1
• Underpinned by 2.1 million square metres of land                                                                                                                                       WARR
                                                                                                                                                                                       • Further growth potential via acquisitions,
                                                                                                                                                                                         development fund-throughs and reinvestment in
                                                                                                                                                                                         the core portfolio

                    LOW-COST OPERATING STRUCTURE                                                                                                                               CONSERVATIVE CAPITAL STRUCTURE
                   • $2.9 billion portfolio managed by 8 FTEs                                                                                                                  • Target gearing range of 30-40%
                   • One of the lowest MERs in the S&P/ASX REIT 200                                                                                                            • Investment grade credit rating (Moody’s Baa1)2
                                                                                                                                                                               • Diversified debt sources and tenor

1 CPI   assumed at 1.6%.
2 Credit  rating must not be used, and WPR does not intend to authorise its use, in the support of, or in relation to, the marketing of its securities to retail investors in Australia or internationally.
                                                                                                                                                                                                                                             3
1H21 Results Presentation - 27 August 2021 Hadyn Stephens - CEO Kerri Leech - CFO - Open Briefing
Contents:

1.   1H21 Highlights              5
2.   Financial Results            8
3.   Portfolio Update             12
4.   Key Priorities and Outlook   18
5.   Additional Information       20
6.   Glossary                     31
1H21 Results Presentation - 27 August 2021 Hadyn Stephens - CEO Kerri Leech - CFO - Open Briefing
1H21 Highlights

                  5
1H21 Results Presentation - 27 August 2021 Hadyn Stephens - CEO Kerri Leech - CFO - Open Briefing
1H21 Highlights
Strong growth in Distributable EPS and NTA per security, gearing remains below revised target range

        Financial Performance                                                 Property Portfolio                                             Capital Management                                                     Business Update

            Distributable EPS: 7.81cps1                                            $2.94bn portfolio2                                                 Gearing: 27.3%                                        Five new leases/options finalised
                    +5.4% on 1H202                                                   427 properties                                            210bp decrease since Dec-20                                       3.5% uplift in rental income
      No additional rent relief granted during 1H21                             74% Metro / 26% Regional                                   Below target gearing range of 30-40%                           99.4% of fuel income secured until May-26
                                                                                    10.5-year WALE                                                                                                            No non-fuel expiries until Aug-23

              NTA: $2.75 per security                                 $176.1m (6.4%) gross valuation uplift2                                $100m of bank debt refinanced                                         Strong Alliance performance
             +$0.26 (10.4%) since Dec-20                                            WACR of 5.37%                                     Weighted average debt maturity of 4.1 years                        VEA: 1H21 fuel volumes up 7.9% on 1H20
                                                                             19bp compression since Dec-20                            Weighted average hedge maturity of 1.9 years                   Coles Express: FY21 c-store revenues up 7.7% on
                                                                                                                                                                                                                          FY20

                      MER: 26bp                                       37 non-core assets sold for $132.0m3                                      $75m buy-back initiated                                              EV take-up remains low
                 2bp decrease on 1H20                                      Average premium to book of 10.8%                           $150m of total capital management initiatives                                 1.6% of new car sales in 1H21
    One of the lowest in the S&P/ASX 200 REIT Index                        Combined IRR of 11.3% (unlevered)                        proposed (including buy-back, $694k of securities                            0.1% of Australia’s light vehicle fleet
                                                                                                                                                   acquired to date)4

1 Based   on weighted average number of securities on issue during the year.
2 Portfolio information excludes assets sold or transferred to assets held for sale during the period.
3 Refers to assets exchanged and/or settled during the period.
4 The final quantum, structure and timing of the capital management initiatives remain subject to satisfactory progress of non-core asset sales (including settlement of the Fawkner transaction) during 2H21.                                             6
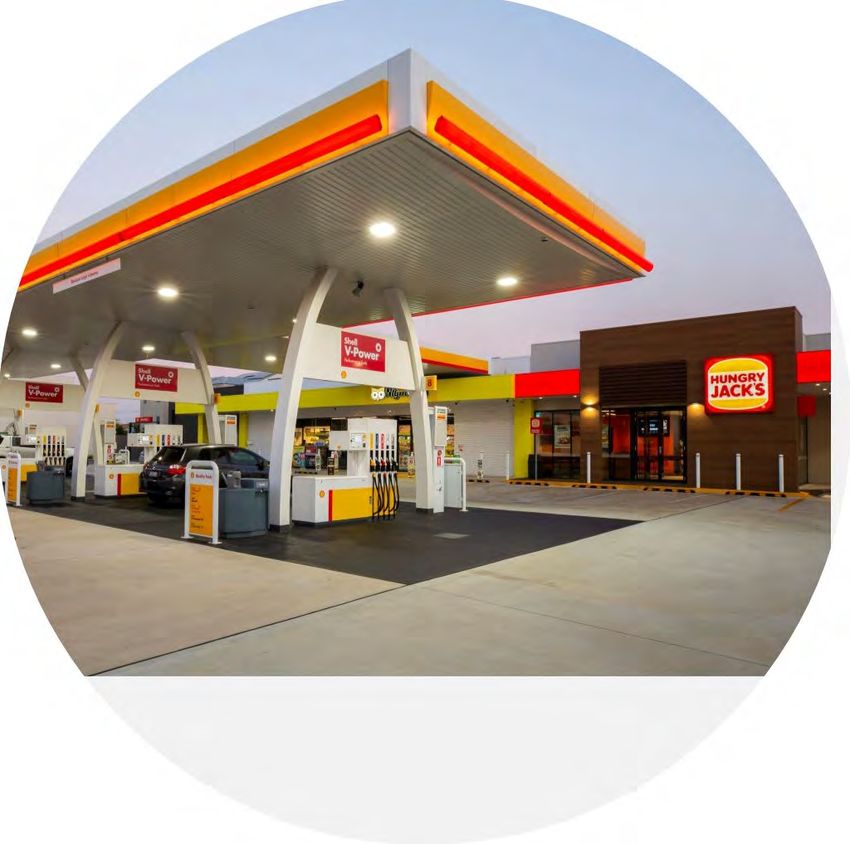
1H21 Results Presentation - 27 August 2021 Hadyn Stephens - CEO Kerri Leech - CFO - Open Briefing
ESG Update
WPR published Modern Slavery Statement, quantified base year carbon emissions & identified path to net zero

    Focus Area /
    Key Matter                     Key Matters                    Stakeholders                  UNSDGs          FY21 Actions
    Ethical Conduct and            Governance,                    Employees/                                    Modern Slavery:
    Transparency                   Compliance,                    Communities/                                  - Issued first Modern Slavery Statement.
                                   Risk Management                Business Partners/                            - Implemented enhanced procedures for vetting new suppliers, including provision of WPR’s Supplier
                                                                  Securityholders                                 Code of Conduct and conduct of Modern Slavery risk assessments.
    Climate Change                 Climate risks and              Tenants/                                      Net Zero pathway:
    and Energy                     opportunities                  Employees/                                    - FY20 baseline year carbon emissions quantified.
                                   Energy efficiency              Securityholders                               - WPR will audit and offset FY21 carbon emissions from operations indirectly through donation to an
                                                                                                                  accredited provider and continue to investigate direct reduction and offset program opportunities.
                                                                                                                Supporting our tenant operators:
                                                                                                                - Indirect Scope 3 emission sources identified and work underway with VEA to better understand Scope 3
                       FY20 Baseline CO2 Emissions (tonnes)*                                                      footprint and approach.
                                       5.3                                                                      - Easements granted on three sites leased to VEA in support of their EV charging station pilot program
                                                                      Scope 1                                     with Evie Networks.
                                                                                                                Acknowledging sustainability commitments of our tenant operators:
                                                26.0                  Scope 2                                   - Coles Group Limited (parent entity of Coles Express): Net zero greenhouse gas emissions by 2050,
                                                                                                                  100% renewable electricity by the end of FY25, reduce combined scope 1 and 2 greenhouse gas
                     49.8                                             Scope 3                                     emissions by more than 75% by the end of FY30.1
                                                                      (direct)
                                                                                                                Survey participation:
                * Unaudited                                                                                     - Completed S&P’s Corporate Sustainability Assessment and Sustainalytics surveys during this period.

    • Scope 1 and 2 emissions reported according to our operational control boundary under the National Greenhouse and Energy Reporting Act 2017. Direct Scope 3 emissions reported include business travel, employee commuting, waste and
      energy emissions. Indirect Scope 3 emissions not reported include in-shop electricity, development expenditure, electricity at pumps, shop refrigerant use, upstream supply chain and fugitive emissions.
    • Emissions calculated in accordance with the GHG Protocol methodology where possible and supplemented with industry best practice estimates. Scope 1 and 2 data calculated using a combination of direct consumption and industry intensity
      data and corresponding emissions factors from the National Greenhouse Accounts Factors. Direct Scope 3 emissions estimated based on spend based consumption data and publicly available industry data.
    • FY20 Baseline represents FY20 Actual adjusted to reflect normalised travel/commuting post COVID-19.

1   Source: Coles Group FY21 Results Presentation.

                                                                                                                                                                                                                                                   7
1H21 Results Presentation - 27 August 2021 Hadyn Stephens - CEO Kerri Leech - CFO - Open Briefing
Financial Results

                    8
1H21 Results Presentation - 27 August 2021 Hadyn Stephens - CEO Kerri Leech - CFO - Open Briefing
Financial Performance
Strong growth in DEPS driven primarily by higher rental income and lower interest expense

                                                                       1H21           1H20         Change           Change
                                                                         $m             $m             $m               %

    Rental income                                                       81.7            79.1              2.6             3.3
                                                                                                                                                     $2.2m of like-for-like rental growth (2.9%), $0.9m of income from net
                                                                                                                                                acquisitions/developments offset by $0.5m lower development coupon income.
    Interest income                                                       0.1            0.2            (0.1)          (50.0)

    Total income                                                        81.8            79.3              2.5             3.2
                                                                                                                                                             Lower average debt balance and base rate interest savings
    M&A expenses                                                          4.4            4.5            (0.1)           (2.2)                                        partially offset by higher margin on USPP.

    Interest expense                                                    16.1            17.0            (0.9)           (5.3)

    Total expenses                                                      20.5            21.5            (1.0)           (4.7)                  Valuation gains represent the key difference between Distributable Earnings and
                                                                                                                                                        statutory net profit. Refer to page 21 for detailed reconciliation.
    Distributable Earnings                                              61.3            57.8              3.5             6.1

    Distributable EPS (cents)1                                          7.81            7.41            0.40              5.4
                                                                                                                                                        WPR continues to have one of the lowest MERs in the sector.
    Statutory net profit                                              251.9           137.0           114.9              83.9                        MER decrease attributed to higher asset base following valuation gains.

    MER2                                                               26bp            28bp            (2bp)

1 Based   on weighted average number of securities on issue during the reported period. Distributable EPS shown to 2 decimal places. Growth calculated on exact figures.
2   Excludes net property expenses of $0.4m (1H20: $0.6m).
                                                                                                                                                                                                                                 9
1H21 Results Presentation - 27 August 2021 Hadyn Stephens - CEO Kerri Leech - CFO - Open Briefing
Balance Sheet
Strong growth in NTA per security driven by 19bp of WACR compression across WPR’s ongoing portfolio

                                                                    Jun-21         Dec-20          Change          Change
                                                                       $m             $m               $m              %

    Cash and cash equivalents                                           15.0           15.5            (0.5)            (3.2)
                                                                                                                                                  Includes the Fawkner Portfolio ($113.9m) and 12 other assets ($35.3m).
    Assets held for sale and other assets                             152.3            17.8           134.5             n.m.                  Three assets sold during 1H21, with three sold post-balance date (see page 16).

    Investment properties                                          2,938.9         2,897.3              41.6              1.4
                                                                                                                                                   Increase due to gross valuation gains ($189.8m) and development spend
    Total assets                                                   3,106.2         2,930.6            175.6               6.0                          ($0.5m), net of assets sold / classified to held for sale ($148.7m).

    Distribution payable                                                61.3           60.7              0.6              1.0
                                                                                                                                                 Debt reduced by asset disposal proceeds ($14.3m) and unrealised foreign
    Borrowings                                                        828.5          845.8            (17.3)            (2.0)                  exchange and fair value hedge movements on USPP ($3.2m), partially offset by
                                                                                                                                                                lower unamortised borrowing costs ($0.2m).
    Derivatives                                                         44.3           54.6           (10.3)          (18.9)

    Other liabilities                                                   15.8           16.3            (0.5)            (3.1)                   Largely represents favourable fair value derivative movements on interest rate
                                                                                                                                                                                    swaps.
    Total liabilities                                                 949.9          977.4            (27.5)            (2.8)

    Net assets                                                     2,156.3         1,953.2            203.1             10.4
                                                                                                                                                 Increase attributed primarily to gross valuation gains ($0.24) and favourable
                                                                                                                                                                    interest rate swap movements ($0.01).
    NTA per security                                                  $2.75          $2.49            $0.26             10.4

    Gearing1                                                         27.3%          29.4%            (2.1%)

1   Net debt (excluding foreign exchange and fair value hedge adjustments) / total assets less cash. Net debt is $843.0m, being gross borrowings of $858.0m (see page 11) less $15.0m of cash.

                                                                                                                                                                                                                                 10
Debt / Liquidity
    $100m of bank debt refinanced during period with no debt expiries until June 2023

                                                                     Jun-21             Dec-20             Change

     Facility limit ($m)                                             1,050.0            1,050.3                 (0.3)
                                                                                                                                                         Asset disposal proceeds used to temporarily repay debt.
     Drawn debt ($m)1                                                  858.0              872.3               (14.3)                            $140.2m of available liquidity to fund selective acquisitions and reinvestment
                                                                                                                                                             in WPR’s core portfolio as and when identified.
     Undrawn debt ($m)                                                 192.0              178.0                 14.0

     Available liquidity ($m)2                                         140.2              127.3                 12.9                           Gearing of 27.3% is below the bottom of our target gearing range of 30-40%.
                                                                                                                                              If completed, the asset sales and capital management initiatives announced in
                                                                                                                                                conjunction with the sale of the Fawkner Portfolio would increase pro forma
     Gearing (%)                                                         27.3               29.4                (2.1)                                                         gearing to 28.7%.

     Weighted average cost of debt (%)3                                  3.65               3.60                0.05

     Interest cover ratio (times)4                                         5.5                5.3                 0.2                              WADM extended through refinancing $100m of bank debt for 4-year term.

     Weighted average debt maturity (years)                                4.1                4.3               (0.2)

     Hedge cover (%)                                                        90                 89                   1                                            New A-MTN Programme established in 1H21.
                                                                                                                                                  Considering A-MTN market issuance in 2H21 to further diversify and extend
     Weighted average hedge maturity (years)                               1.9                2.4               (0.5)                              the tenor of debt platform and reduce exposure to variable interest rates.

1 Reflects AUD equivalent of USPP proceeds on date of funding as cross currency swaps in place.
2 Unrestricted cash and undrawn debt net of distribution provision.
3 Interest expense (excluding borrowing cost amortisation) divided by average drawn debt balance.
4 Covenant calculation: Distributable Earnings before interest expense plus straight-line rental income divided by Net Interest Expense (excluding borrowing cost amortisation) and calculated on a rolling 12-month basis.
                                                                                                                                                                                                                                 11
Portfolio Update

                   12
Portfolio Overview1
Geographically diversified portfolio with a strong weighting to Metro locations along the eastern seaboard

                                                                             Avg. Site             Avg.
                               No. of            Value         Value           Area                Value        WACR            WALE
                             Properties           ($m)          (%)            (m2)                ($m)          (%)            (years)
     Metro                        300           2,166.7          74            3,696                 7.2           5.05           10.6
                                                                                                                                                                               6.9%    NT
     Regional                     127              772.4         26            7,553                 6.1           6.28           10.3
     Total                        427           2,939.1         100            4,843                 6.9           5.37           10.5                                         M - $13.7m (2)
                                                                                                                                                                               R - $11.9m (3)
                                                                                                                                                                                                   M - $408.3m (58)
                                                                                                                                                                                                                          6.0%     QLD
                          Geographic split by value                                Tenant contribution by income                                      M - $187.6m (29)                             R - $170.8m (27)
                                                                                                    Other,                                            R - $88.8m (21)
                        TAS, 1.6%        ACT, 2.2%
                                                  NT, 0.9%                                          0.8%
                       SA, 4.5%                                                                              Ampol, 1.8%
                                                                                                                                           WA    6.3%                                               M - $668.4m (83)
                     WA, 9.4%                       NSW,                                                                                                                                            R - $268.6m (40)
                                                    31.9%                                                          7-Eleven,                                                 M - $89.1m (21)
                                                                                                                     0.7%                                                                                                   4.9%   NSW
                                                                                                                                                                             R - $43.5m (9)
                                                                               Viva Energy                                                                                                                    ACT
                        QLD,                                                    Australia,                                                                                                                           6.1%    M - $65.9m (11)
                        19.7%                                                                                                                                                          SA
                                                                                                                                                                                          6.5%
                                                                                  96.7%
                                                 VIC,
                                                29.8%
                                                                                                                                                                                                             VIC
                                                                                                                                                                                                                   4.9%   M - $687.8m (87)
                  Annual rent review type by income                              Lease structure type by income                                                                                                           R - $186.7m (26)
                                                                                                                                           WACR by State.
                         CPI - 4.1%
                                                Other - 0.7%                                 Double Net                                    Geographic diversification by value (number).    M - $45.9m (9)
                                                                                               8.6%
                                                                                                                                                                                            R - $2.1m (1)          6.1%   TAS

                  Fixed 3% or                                                        Triple Net
                greater - 95.5%                                                       91.4%

1   All figures as at 30 June 2021. Portfolio information excludes assets sold or transferred to assets held for sale during the period.

                                                                                                                                                                                                                                               13
Lease Expiry Profile
Portfolio WALE of 10.5 years with a staggered expiry profile

 • Only two fuel leases expiring prior to FY26 (0.6% of income)

 • Two non-fuel tenancies are currently vacant, with a further 10 non-fuel leases expiring prior to FY26 (0.5% of income)

 • Staggered lease renewal profile mitigates against renewal concentration risk and the impact of potential sector structural changes

  Portfolio lease expiry profile (as at 30 June 2021)               1

Leases expiring2     2           0         0         4          2         6         28         31         37        35          33        53        65         70        70         2          3          0      0      1

                                                                                                                                         WALE
                                                                                                                                          10.5
                                                                                                                                         years

                                                                                                                                                                        24.2%

                                                                                                                                                             18.5%
                                                                                                                                                  14.1%
                                                                                                                                         10.3%
                                                                                                                   7.5%        6.8%                                                0.6%      0.9%                      0.3%
                    0.1%                                      0.1%                            6.0%      5.8%
                                                    0.4%                 0.6%      3.6%

                            3
                   Vacant       FY21     FY22      FY23       FY24       FY25      FY26       FY27      FY28       FY29        FY30      FY31      FY32      FY33       FY34       FY35      FY36       FY37    FY38   FY39
                                                                                                                  Year of lease expiry

   1 Inclusive of lease options renewed but currently subject to documentation. Excludes assets sold or transferred to assets held for sale during the period.
   2 Four lease expiries shown in FY36-39 represent committed new leases or extensions at development sites, with lease terms contracted to commence upon practical completion of the respective development.
   3 Assumed income for vacant tenancies.
                                                                                                                                                                                                                              14
Valuations
WACR compression of 19bp across WPR’s ongoing portfolio in 1H21

 • Gross valuation uplift of $189.8 million (6.6%) recorded in 1H21, including $176.1 million (6.4%) on WPR’s ongoing portfolio

 • WACR on WPR’s ongoing portfolio compressed 19bp from 5.56% to 5.37%

 • Rents on 71 of 80 properties independently valued were assessed as market; net result for 80 properties was
Non-Core Disposals
Strong pricing achieved to date via both public auction and off-market transactions

    • 37 assets exchanged and/or settled for an average premium to prevailing book value of 10.8%

    • The sales have delivered a combined unlevered IRR of 11.3% (35 of the 37 properties were acquired at IPO)

    • 9 further assets identified for sale in 2H21 (combined book value of $26.2m); appropriate sale method to be assessed on site-by-site basis

    • The 46 properties sold or identified for sale represent ~10% of WPR’s portfolio by number and ~5% by value

                                                                                             Latest
                                                                                      Acq.    Book    Yield at              Sale   Yield at   Premium
                                                                            Lease     Cap    Value      Book     S/ment    Price      Sale    To Latest    Unlevered
             Property                             State       Location      Expiry    Rate     ($m)     Value      Date    ($m)      Price        Book           IRR

             Minto1                                NSW            Metro     Aug-26   5.75%     2.33    5.75%     Feb-21     2.96    4.52%          27.0%      13.0%
                                                                                                                                                                          1H21
             Maitland1                             NSW            Metro     Aug-26   7.00%     2.49    6.59%     Feb-21     2.55    6.44%          2.3%       10.4%    settlements
             Klemzig2                                SA           Metro     Aug-26   5.75%     1.78    6.00%     May-21     2.55    4.19%          43.2%      13.8%
             Parafield Gardens3                      SA           Metro     Aug-27   6.00%     2.90    4.20%     Oct-21     3.00    4.06%          3.4%       15.3%
             Sandy Bay3                            TAS            Metro     Aug-27   6.00%     3.13    5.74%     Nov-21     3.38    5.32%          7.9%       10.0%
             Queenstown3                             SA           Metro     Aug-28   6.00%     3.10    4.49%     Oct-21     3.68    3.79%          18.5%      16.7%
             Sales via auction                                                       6.10%    15.74    5.38%               18.12    4.67%          15.1%      13.1%
             Fawkner Portfolio                               Metro (10)
                                                 Various                   FY26-36   7.02%   103.37    6.87%     Q3/Q4    113.86    6.42%          10.1%      11.0%
             (31 assets)2                                  Regional (21)
             All asset sales                                                         6.91%   119.11    6.67%              131.97    6.18%          10.8%      11.3%

1 Book values/premiums as at 30 June 2020.
2 Book values/premiums as at 31 December 2020.
3 Book values/premiums as at 30 June 2021.
                                                                                                                                                                                     16
Business Update: Leasing
Five new leases/options to renew finalised with a 3.5% uplift in rental income

    • 99.4% of fuel income now contractually secured until May 2026, with only two fuel leases expiring during this period (Fawkner (2023) and Rouse Hill (2025))

    • No non-fuel lease expiries until August 2023

    • Following the execution of a new lease with VEA at Caboolture, this property was sold to Fawkner in July 2021

                                                                                                       Lease       Current       New        Agreed    Variance    Variance
                                   Property                      State                   Tenant        Expiry        Rent       Term          Rent          ($)        (%)

                                                                 Metro
                                   Blaxland                                                 VEA        May-21     $331,028     5 years    $310,000    ($21,028)     (6.4%)
                                                                 NSW

                                                             Regional
                                   Caboolture                                 VEA / NightOwl1           Jul-21    $242,240    15 years    $246,408      $4,168       1.7%
                                                                QLD

                                                             Regional
                                   Halfway Creek                                            VEA        Sep-21     $521,320     5 years    $580,000     $58,680      11.3%
                                                               NSW

                                   2 x non-fuel tenancies                                                                      5 years
                                                                                                                  $154,964                $157,189      $2,225       1.4%
                                   (Blaxland, Halfway Creek)                                                                      each

                                                                                                                 $1,249,552              $1,293,597    $44,045       3.5%

1   New 15-year IPO Lease executed with VEA; subsequently assigned to Night Owl as per the terms of the lease.

                                                                                                                                                                             17
Key Priorities
and Outlook

                 18
Key Priorities and Outlook
Focused on active portfolio management and optimising capital structure

          Portfolio                                  Actively manage the portfolio to improve overall quality and maximise returns (noting strength of market)
         Optimisation                                Selective approach to acquisitions, continue to evaluate opportunities to reinvest in the core portfolio

           Capital                                   Final structure of proposed capital management program to be communicated in Q4
         Management                                  Considering A-MTN issuance in 2H21 to further diversify and extend the tenor of debt platform

                                                     FY21 carbon emissions from operations to be audited
                 ESG
                                                     “Net zero” carbon emissions from operations to be achieved in FY21

                                                     Target FY21 Distributable EPS reaffirmed at 15.72cps (3.75% growth on FY20)
       FY21 Guidance1
                                                     Moving from semi-annual to quarterly distributions from the September quarter (payable mid-November)

 1 Based on weighted average number of securities on issue (including forecast adjustments as a result of proposed capital management initiatives) and provided there are no material changes in market conditions and no other factors adversely

 affecting financial performance.
                                                                                                                                                                                                                                                    19
Additional
Information

              20
Reconciliation to Statutory Profit
Statutory profit increased 83.9% largely due to valuation gains recorded during the period

 $m                                               1H21       1H20       Change     Change
                                                    $m         $m           $m         %

 Distributable earnings                            61.3       57.8          3.5       6.1%

 Net gain on sale of investment properties          0.6             -       0.6     100.0%        Gain on sale of Klemzig, SA net of transaction costs.

 Net gain on valuation of investment properties   180.9       73.6        107.3     145.8%
                                                                                              $189.8m gross valuation uplift driven by WACR compression
 Straight-line rental income                        8.9       10.6         (1.7)    (16.0%)    and 2.9% WARR net of $8.9m straight-line rent adjustment.

 Amortisation of borrowing costs                   (0.8)      (1.4)         0.6     (42.9%)
                                                                                              Lower write off of borrowing costs associated with re-financing
 Interest rate swap termination                          -    (3.5)         3.5 (100.0%)            (Refinanced $100m in 1H21 vs $300m in 1H20).

 Net gain from derivatives                          1.0             -       1.0     100.0%
                                                                                                   1H20 expense relates to termination of $20m swap
                                                                                              in connection with Review Event triggered by VEA sell down
 Internalisation costs                                   -    (0.1)         0.1 (100.0%)

 Statutory profit                                 251.9      137.0        114.9      83.9%

                                                                                                                                                                21
Debt/Liquidity
Weighted average debt maturity of 4.1 years and weighted average hedge maturity of 1.9 years

Debt maturity profile as at 30 June 2021                                                 Swap maturity profile as at 30 June 2021

         400                                                                             100%                                                                   3.00%
                                                                                                                                                       2.72%
                                                                                         90%
         350
                                                                                                 90%                                                            2.50%
                                 336                                                     80%
         300                               50
                                                                                         70%    1.88%
                                                                                                         1.78%                                                  2.00%
         250                               52
                                                                                         60%
                                                                                                                   1.50%    1.50%       1.50%
                                                                                                          58%
    $m

         200                              223                                            50%                                                                    1.50%

         150                                                                             40%
                                                                                                                                                                1.00%
                                                                                  140    30%
         100
                                                                          109                                       28%      28%         28%
                                                     90                                  20%
                                                                                                                                                                0.50%
         50
                                                                                         10%
                                                          10    40
          0                                                                                                                                             5%
                                                                                          0%                                                                    0.00%
                 FY21   FY22    FY23     FY24       FY25       FY26       FY27   FY30+          Jun-21   Jun-22    Jun-23   Jun-24      Jun-25         Jun-26

          Term    RCF   RCF (undrawn)   Bilateral   Bilateral (undrawn)    ITL   USPP                    % hedged (LHS)     Average hedge rate (RHS)

                                                                                                                                                                        22
Viva Energy Australia – 1H21 Results1
Strong improvement at Group level driven by return to profitability of Refining

• Group Highlights:                                                                                                  $m                                                  1H21      1H20     Change

     – Underlying EBITDA (RC) up 95% to $256.3m and Underlying NPAT (RC)                                             Sales volumes (litres, billions)                      6.7       6.4       0.3
       up 359% to $111.9m, primarily due to turnaround in refining
                                                                                                                     Underlying EBITDA (RC):
     – Dividend resumed due to strong underlying free cash flow of $144.0m

     – Net cash position of $44.7m at 30 June 2021                                                                       Retail                                          116.7     118.4      (1.7)

     – $140m of capital management initiatives announced; pro forma net debt of                                          Commercial                                      105.9      90.7      15.2
       $95.3m represents 0.26x LTM EBITDA (RC)

     – Fuel Security Package provides certainty for continued investment at                                              Retail, Fuels & Marketing                       222.6     209.1      13.5
       Geelong Refinery whilst minimising downside volatility of refining margins
                                                                                                                         Refining                                         43.8     (66.8)    110.6
• Retail Highlights:
                                                                                                                         Corporate                                       (10.1)    (10.6)      0.5
     – Strong performance despite headwinds from rising oil prices (margin
       compression) and lockdowns, which were offset by volume improvements
       and non-fuel income from convenience sales growth at Alliance sites                                               Underlying EBITDA (RC)                          256.3     131.7     124.6

     – Retail sales volumes up 23% on 1H20, with improvement driven by growth
       in the predominantly regionally-focused Liberty Convenience and Dealer
       Owned channels                                                                                                Underlying NPAT (RC)                                111.9      24.4      87.5

     – Alliance fuel volumes averaged 58.4ML/week, up 8% on 54.1ML/week in
                                                                                                                                                                        Jun-21    Dec-20
       1H20 and broadly in line with levels achieved in 1H19

     – Continued growth of the Liberty Convenience network                                                           Net Cash / (Debt)                                    44.7    (104.2)    148.9

     – Over 80 Coles Express store refurbishments completed to support growth
       in both the convenience and fuel offer

1   Source:VEA’s 1H21 Results Presentation and ASX release, as lodged with the ASX on 24 August 2021. Please note that VEA changed its segment reporting during 1H21.

                                                                                                                                                                                                      23
Coles Express – FY21 Results1
Strong c-store sales and cost control support a doubling of EBIT

• Sales revenue up 7.7% (6.8% on a comparable basis), driven by food-to-                       $m                             FY21      FY20    Change
  go (including coffee) and cold drinks, supported by recent investments in
                                                                                               Key P&L items:
  new self-serve coffee machines and fast-lane fridges
                                                                                               C-store sales revenue ($m)     1,192     1,107     7.7%

• Gross margin decreased by 134bp, largely due to lower fuel margin                            EBITDA ($m)                     207       167     24.0%
  income and lower fuel volumes (down 4.0%)
                                                                                               EBIT ($m)                        67        33    103.0%

                                                                                               Key metrics:
• Strong growth in EBITDA (+24%) and EBIT (+103%) as a result of sales
  growth and focus on cost control
                                                                                               No. of stores                   717       713        +4

                                                                                               Comp c-store sales growth      6.8%      4.6%     229bp
• Strategic investments made in the network, including refurbishment of
  over 80 sites together with VEA                                                              Weekly fuel volumes          57.1ML    59.5ML     (4.0%)

                                                                                               Fuel volume growth            (4.0%)    (2.3%)   (165bp)

                                                                                               Comp fuel volume growth       (5.4%)    (2.5%)   (292bp)

                                                                                               Gross margin                  52.4%     53.7%    (134bp)

                                                                                               Cost of doing business       (46.7%)   (50.8%)    404bp

                                                                                               EBIT margin                    5.7%      3.0%     270bp

1   Source: Coles Group FY21 Results Presentation, as lodged with the ASX on 18 August 2021.

                                                                                                                                                          24
F&C Assets: Investment Market Update
Strong market conditions continued for F&C assets in 1H21

• Transaction numbers up ~40% and transaction volumes up ~80% compared with 1H20

• Key markets of NSW/VIC/QLD make up ~90% of transaction volumes, with Metro sites accounting for ~60% of transactions by number

                                              $450.0                     5.89%                                                                                    6.00%

                                              $400.0                                                                5.81%                                         5.80%
                                                                                                                                                $383.2

                                                                                                                                                                  5.60%
                                              $350.0

                                                                                                                                                                  5.40%
                                              $300.0
                                                                                                                $265.3
                                                                                                                                                                  5.20%
                                              $250.0                                                                                             5.24%
                                                                         $214.0                                                                                   5.00%
                                              $200.0
                                                                                                                                                                  4.80%

                                              $150.0
                                                                                                                                                                  4.60%

                                              $100.0
                                                                                                                                                                  4.40%

                                               $50.0                                                                                                              4.20%

                                                 $0.0                                                                                                             4.00%
                                                                1H20 (38 transactions)              2H20 (45 transactions)               1H21 (53 transactions)
                                                                                   Transaction volume ($m)          Average capitalisation rate (%)

1   Source: CBRE Valuation & Advisory Services. Data is indicative only and may not capture all transactions.

                                                                                                                                                                          25
IPO Portfolio vs. Government Bonds and Term Deposit Rates
Spread to bank term deposits remains elevated, spread to 10-year bond in line with long-term average

• As of June 2021:

     – The yield spread between WPR’s IPO assets and the 10-year Australian Government Bond was ~375bp (in line with 5-year average)

     – The yield spread between WPR’s IPO assets and the average 12-month term deposit rate available from major banks was ~500bp, near its all-time high and ~100bp higher than
       the 5-year average
                                           7.00%

                                           6.00%

                                                                                                                                                                                                                                                                                                                                   5.27%
                                           5.00%

                                           4.00%

                                           3.00%

                                           2.00%
                                                                                                                                                                                                                                                                                                                                   1.52%

                                           1.00%

                                                                                                                                                                                                                                                                                                                                   0.25%
                                           0.00%
                                                                                                 Jun-17

                                                                                                                                                       Jun-18

                                                                                                                                                                                                              Jun-19

                                                                                                                                                                                                                                                                    Jun-20

                                                                                                                                                                                                                                                                                                                          Jun-21
                                                                               Feb-17

                                                                                                                                     Feb-18

                                                                                                                                                                                            Feb-19

                                                                                                                                                                                                                                                  Feb-20

                                                                                                                                                                                                                                                                                                        Feb-21
                                                    Aug-16

                                                                      Dec-16

                                                                                                          Aug-17

                                                                                                                            Dec-17

                                                                                                                                                                Aug-18

                                                                                                                                                                                   Dec-18

                                                                                                                                                                                                                       Aug-19

                                                                                                                                                                                                                                         Dec-19

                                                                                                                                                                                                                                                                             Aug-20

                                                                                                                                                                                                                                                                                               Dec-20
                                                             Oct-16

                                                                                                                   Oct-17

                                                                                                                                                                          Oct-18

                                                                                                                                                                                                                                Oct-19

                                                                                                                                                                                                                                                                                      Oct-20
                                                                                        Apr-17

                                                                                                                                              Apr-18

                                                                                                                                                                                                     Apr-19

                                                                                                                                                                                                                                                           Apr-20

                                                                                                                                                                                                                                                                                                                 Apr-21
                                                                                                 12-mth term deposits                                                    10-yr Govt Bond                                          WACR (IPO assets)

1   Sources: Reserve Bank of Australia. WACR on IPO assets relates to the 381 IPO assets (283 Metro, 98 Regional) remaining in WPR’s portfolio following announced and planned non-core asset sales.

                                                                                                                                                                                                                                                                                                                                           26
Global EV Sales Market Share (2020)
Australia continues to be a global laggard in terms of EV take-up

• 6,900 EVs sold in Australia in 2020 (0.8% of all light vehicles sales), up from 6,718 (0.7%) in 2019

• 76% of EVs sold in Australia in 2020 were battery electric vehicles, with plug-in hybrid electric vehicles representing just under one-quarter of sales

• EVs currently represent only 0.12% of the Australian light vehicle fleet

                                                                                          80%
                                                                                                74.8%

                                                                                          70%
                                                    EVs as % of new vehicle sale (2020)

                                                                                          60%

                                                                                          50%
                                                                                                        45.0%

                                                                                          40%
                                                                                                                32.2%
                                                                                          30%

                                                                                          20%
                                                                                                                        13.5%
                                                                                                                                11.3%   10.7%   10.2%
                                                                                          10%                                                            8.3%
                                                                                                                                                                  6.2%
                                                                                                                                                                           4.2%
                                                                                                                                                                                    2.3%
                                                                                                                                                                                            0.8%
                                                                                          0%
                                                                                                Norway Iceland Sweden Germany France     UK     Europe California China    Global   USA    Australia
                                                                                                                                                                          Average
1   Source: Electric Vehicle Council, State of Electric Vehicles, August 2021.

                                                                                                                                                                                                       27
Annual EV Sales - Australia
EV sales have shown strong growth in 1H21, but still represent
Public EV Charging Infrastructure
Low EV take-up remains the biggest barrier to sustained investment in charging infrastructure

• In the last 12 months there has been a significant increase in the rollout of public chargers, with ~3,000 public chargers now installed across Australia at over 1,650 locations,
  including 470 DC fast or ultra-fast chargers (50kW+) at almost 250 locations

• However, at present there are only 7.2 EVs for every installed public charger, illustrating the commercial realities facing operators without significant EV sales growth

                                                                              1,800

                                                                              1,600

                                                                                                                                                             244
                                                                              1,400

                                                                                                                                                             1,409
                                               No. of public charging sites

                                                                              1,200

                                                                              1,000

                                                                               800

                                                                               600

                                                                               400

                                                                               200

                                                                                 0
                                                                                                  14

                                                                                      ACT   NSW   NT         QLD          SA        TAS        VIC   WA   National

                                                                                                  Standard charge sites    Fast charge sites
1   Source: Electric Vehicle Council, State of Electric Vehicles, August 2021.

                                                                                                                                                                                       29
Retail Fuel Prices and Margins
Industry margins remain resilient despite strengthening oil price and softer diesel margins

• Average retail margin of 15.0cpl for the 12 months to June 2021 (FY21) is down slightly on FY20 (16.1cpl) and CY20 (18.2cpl), but still ~13% higher than 10-year average

• Retailers enjoying strong margins despite COVID-impacted fuel volumes and an 8% decline in average fuel prices (FY21 vs FY20)

                                                 180.0                                                                                                                                                                         18.0

                                                 160.0                                                                                                                                                  16.1                   16.0
                                                                                                                                                                                                                        15.0
                                                                                                                                        14.5
                                                 140.0                                                                                                  13.9                            13.8                                   14.0
                                                                                                                                                                        13.4
                                                                                                                        12.7
                                                 120.0                                                                                                                                                                         12.0
                                                                                                        11.5
                                                                                        11.0
                                                                       10.6
                                                 100.0                                                                                                                                                                         10.0

                                                                                                156.1
                                                  80.0                                                                                                                                                                         8.0
                                                               147.3

                                                                                                                                                                                147.1
                                                                                146.7

                                                                                                                139.3

                                                                                                                                                                                                138.6
                                                                                                                                                                136.2

                                                                                                                                                                                                                127.5
                                                                                                                                                124.7
                                                                                                                                123.0
                                                  60.0                                                                                                                                                                         6.0

                                                  40.0                                                                                                                                                                         4.0

                                                  20.0                                                                                                                                                                         2.0

                                                    0.0                                                                                                                                                                        0.0
                                                             FY12             FY13             FY14            FY15            FY16            FY17            FY18            FY19            FY20            FY21

                                                                              National average retail price (cpl, LHS)                                  National average retail margin (cpl, RHS)

1   Source: AIP. National average retail price and national average retail margin assume a 50/50 split between petrol and diesel. The national average retail margin is the national average retail price less the national average Terminal Gate Price.

                                                                                                                                                                                                                                                           30
Glossary

           31
Glossary

ABS                      Australian Bureau of Statistics.

AIP                      Australian Institute of Petroleum.

ASX                      Australian Securities Exchange.

A-MTN                    Australian Medium-Term Notes.

Alliance                 A long-term agreement between Coles Express and VEA in respect of the operation of a national network of retail fuel and convenience sites.

bp                       Basis points.

Coles Express            Coles Express, a division of Coles Group Limited (ASX: COL).

CO2                      Carbon dioxide.

CPI                      Consumer Price Index.

cpl                      Cents per litre.

cps                      Cents per security.

C-store                  Convenience store.

                         This is a non-IFRS measure being statutory net profit adjusted to remove transaction costs and non-cash items, including straight-lining of rental income, amortisation of debt and
Distributable Earnings
                         establishment fees and any fair value adjustments to investment properties or derivatives.

Distributable EPS        Distributable Earnings per security. Calculated as Distributable Earnings divided by the weighted average number of ordinary securities on issue during the period.

                         Agreement where the tenant is responsible for all outgoings except fair wear and tear, capital expenditure, the difference between single and multiple land tax and, in some cases,
Double Net
                         the landlord’s property management fees (if any).

EBIT                     Earnings before interest and tax.

EBITDA                   Earnings before interest, tax, depreciation and amortisation.

EV                       Electric vehicle (general term used to cover battery electric vehicles, plug-in hybrid electric vehicles and hydrogen fuel cell vehicles).

F&C                      Fuel and Convenience.

                                                                                                                                                                                                               32
Glossary

FTE                    Full Time Equivalent (employee).

Fawkner                Fawkner Property Ltd in its capacity as trustee for various trusts.

Fawkner Portfolio      Sale of 31 assets to Fawkner (per ASX announcement dated 30 July 2021).

FY                     Financial year.

GHG                    Greenhouse gases.

Gearing                Net debt (excluding foreign exchange and fair value hedge adjustments) to total assets (excluding cash).

Internalisation        Agreement with VEA to internalise the management function of WPR (completed on 30 September 2021).

IRR                    Internal rate of return.

IPO                    Initial Public Offering.

IPO Lease              Standard lease entered into between WPR and VEA for the IPO portfolio.

m2                     Square metre

M&A expenses           Management and administration expenses.

ML                     Megalitre (metric unit of capacity equal to a million litres).

                       Properties that are located within Greater Capital City Statistical Areas (GCCSAs) and/or adjacent Significant Urban Areas (SUAs), as sourced from the Australian Bureau of Statistics
Metro
                       (ABS 2016).

MER                    Management expense ratio (calculated as the ratio of M&A expenses (excluding net property expenses) over average total assets (excluding derivative financial assets)).

Moody’s                Moody’s Investors Services.

Net Interest Expense   Finance costs less finance income.

NTA                    Net tangible assets.

                       VEA reports its performance on a “replacement cost” (RC) basis. RC is a non-IFRS measure under which the cost of goods sold is calculated on the basis of theoretical new purchases
RC                     of inventory instead of historical cost of inventory. This removes the effect of timing differences and the impact of movements in the oil price. From 1 January 2021, RC measures also
                       include lease expense, and exclude lease interest and right-of-use amortisation, in effect reporting RC in line with the previous leasing standard.

                                                                                                                                                                                                           33
Glossary

Regional                  All other properties not located within Greater Capital City Statistical Areas (GCCSAs) and/or adjacent Significant Urban Areas (SUAs).

                          The review event triggered under WPR’s debt facilities as a result of VEA’s sell down of its securityholding in WPR in February 2020. As a result, existing lenders at the time had a
Review Event
                          period of 60 days to consult as to the continuation of the existing facilities. In March 2020 WPR received the requisite waivers from lenders in respect of the review event.

                          The Significant Urban Area (SUA) structure of the Australian Statistical Geography Standard (ASGS) represents significant towns and cities of 10,000 people or more. They are based
                          on the Urban Centres and Localities (UCLs) but are defined by the larger Statistical Areas Level 2 (SA2s). A single SUA can represent either a single Urban Centre or a cluster of
Significant Urban Areas
                          related Urban Centres. Using SA2s to define SUAs ensures a wider range of more regularly updated data is available for these areas (such as Estimated Resident Population),
                          compared to UCLs where only Census data is available. Definition sourced from the Australian Bureau of Statistics.

S&P                       Standard & Poor's Financial Services LLC.

Terminal Gate Price       Terminal Gate Price, as per the Australian Institute of Petroleum. Terminal Gate Price represents the national average wholesale price of petrol.

                          A lease where the tenant is responsible for all outgoings relating to the property being leased in addition to the rent fee applied under the lease. This includes all repairs and
Triple Net
                          maintenance (including structural repairs and maintenance), rates, taxes, insurance and other direct property costs.

                          Profit before interest, tax, depreciation and amortisation adjusted to remove the impact of one-off non-cash items including net inventory gain/loss, share of net profit of associates,
Underlying EBITDA (RC)
                          gains or losses on the disposal of property, plant and equipment and gains or losses on derivatives and foreign exchange (both realised and unrealised).

Underlying NPAT (RC)      Underlying NPAT (RC) adjusted to remove the impact of significant one-off items net of tax.

UNSDG                     United Nations Sustainable Development Goals.

USPP                      United States Private Placement.

VEA                       Viva Energy Australia (ASX: VEA).

Waypoint REIT or WPR      Stapled entity comprising one share in Waypoint REIT Limited (ABN 35 612 986 517) and one unit in the Waypoint REIT Trust (ARSN 613 146 464).

WACR                      Weighted average capitalisation rate, weighted by valuation.

WADM                      Weighted average debt maturity.

WALE                      Weighted average lease expiry, weighted by rental income.

WARR                      Weighted average rent review, weighted by rental income.

                                                                                                                                                                                                                     34
Focused on maximising long-term income and capital returns

Excellence                  Respect                     Trust                   Integrity
Doing our best, and        For our people,       Building and maintaining       Operating in an
 always looking for    community, environment,    long-term relationships    ethical manner that is
 ways to do better     customers and investors      through our actions     transparent and honest

                                                                                                      35
You can also read