BERKSHIRE GREY
FEBRUARY 2021
←
→
Page content transcription
If your browser does not render page correctly, please read the page content below

BERKSHIRE GREY FEBRUARY 2021
This presentation (“Presentation”) is for informational purposes only to assist interested parties in making their own evaluation with respect to a potential business combination (the “Business Combination”) between Revolution Acceleration Acquisition Corp (“Revolution”), a special purpose acquisition company and
Berkshire Grey, Inc., (“Berkshire Grey” or the “Company”). The information contained herein does not purport to be all inclusive and none Revolution, the Company or Credit Suisse Securities (USA) LLC nor any of their respective affiliates nor any of its or their control persons, officers, directors, employees or representatives
makes any representation or warranty, express or implied, as to the accuracy, completeness or reliability of the information contained in this Presentation. This Presentation does not contain all the information that should be considered concerning the potential Business Combination and is not intended to form the basis of
any investment decision or any other decision in respect of the Business Combination. You should consult your own counsel and tax and financial advisors as to legal and related matters concerning the matters described herein, and must make your own decisions and perform your own independent investment and
analysis of investment in Revolution and the transactions contemplated in this presentation, and, by accepting this Presentation, you confirm that you are not relying upon the information contained herein to make any decision. The reader shall not rely upon any statement, representation or warranty made by any other
person, firm or corporation (including, without limitation, Credit Suisse Securities (USA) LLC or any of its respective affiliates or control persons, officers, directors and employees) in making its investment or decision to invest in the Company. None of Revolution, the Company or Credit Suisse Securities (USA) LLC, nor any of
their respective affiliates nor any of its or their control persons, officers, directors, employees or representatives, shall be liable to the reader for any information set forth herein or any action taken or not taken by any reader, including any investment in shares of any special purpose acquisition company or the Company.

Certain information contained in this Presentation relates to or is based on studies, publications, surveys and the Company’s own internal estimates and research. In addition, all of the market data included in this Presentation involves a number of assumptions and limitations, and there can be no guarantee as to the
accuracy or reliability of such assumptions. Finally, while the Company believes its internal research is reliable, such research has not been verified by any independent source. This meeting and any information communicated at this meeting are strictly confidential and should not be discussed outside your organization.
Any data on past performance or modeling contained herein is not an indication as to future performance. Revolution and the Company assume no obligation to update the information in this Presentation. Further, the historical financial data included in this Presentation were audited by the Company in accordance
with private company AICPA standards. Accordingly, such information and data may not be included, may be adjusted, or may be presented differently, in any proxy statement/prospectus to be filed with the SEC.

Forward Looking Statements. Certain statements in this Presentation may be considered forward looking statements. Forward looking statements generally relate to future events or future financial or operating performance of the Company or Revolution in the potential Business Combination. Forward-looking statements
include, but are not limited to, statements regarding: (i) the growth of the Company’s business and its growth strategy, including the potential size of the total addressable market and the Company’s growth of and conversion of orders from its pipeline, and expected penetration; (ii) the Company’s expected results,
including with respect to revenue, earnings and margins; (iii) the Company’s entry into new markets, consummation of acquisitions and direct contracting opportunities trends and developments in the robotics and artificial intelligence industries, (iv) the Company’s visibility into its future financial performance, including
cash flows, and successful completion and use of proceeds from the any investment and the Business Combination. In some cases, you can identify forward looking statements by terminology such as “may”, “should”, “expect”, “intend”, “will”, “estimate”, “anticipate”, “believe”, “predict”, “assume”, “continued”, “goal”,
“plan”, “potential”, “projected”, “target” or the negatives of these terms or variations of them or similar terminology. Such forward looking statements are subject to risks, uncertainties, and other factors which could cause actual results to differ materially from those expressed or implied by such forward looking statements.
These forward-looking statements are based upon estimates and assumptions that, while considered reasonable by the Company and its management are inherently uncertain. New risks and uncertainties may emerge from time to time, and it is not possible to predict all risks and uncertainties. Such risks and uncertainties
involving the Company include, but are not limited to: (a) current and future conditions in the global economy, including as a result of the impact of the COVID-19 pandemic; (b) the loss of any one of our primary customers, or the termination of our existing contracts by a customer; (c) the inability to penetrate new
markets and generate revenues from the potential pipeline; (c) demand for our products that does not grow as expected; (d) our dependence on a limited number of third-party contract manufacturers; (e) our failure to manage any growth in the Company or its business; (f) increased competition; and (g) other risks
associated with companies, such as the Company, that are engaged in the intelligent automation industry. Nothing in this Presentation should be regarded as a representation by any person that the forward-looking statements set forth herein will be achieved or that any of the contemplated results of such forward
looking statements will be achieved. You should not place undue reliance on forward looking statements in this Presentation, which speak only as of the date they are made and are qualified in their entirety by reference to the cautionary statements herein. The Company does not undertake any duty to update these
forward-looking statements.

You should carefully consider the risks and uncertainties described in the “Risk Factors” section of Revolution’s registration statement on Form S-1, the proxy statement/prospectus on Form S-4 relating to the Business Combination, which is expected to be filed by Revolution with the Securities and Exchange Commission (the
“SEC”) and other documents filed by Revolution from time to time with the SEC. These filings identify and address other important risks and uncertainties that could cause actual events and results to differ materially from those contained in the forward-looking statements. Forward-looking statements speak only as of the
date they are made. Readers are cautioned not to put undue reliance on forward-looking statements, and Revolution and the Company assume no obligation and do not intend to update or revise these forward-looking statements, whether as a result of new information, future events, or otherwise. Neither Revolution
nor the Company gives any assurance that either Revolution or the Company will achieve its expectations.

This Presentation contains certain financial projections, forecasts, estimates and targets of the Company. Such financial projections, forecasts, estimates and targets constitute forward-looking information, and are for illustrative purposes only and should not be relied upon as necessarily being indicative of future results.
The assumptions and estimates underlying such financial projections, forecasts, estimates and targets are inherently uncertain and are subject to a wide variety of significant business, economic, competitive and other risks and uncertainties. See “Forward-Looking Statements” above. While all financial projections,
forecasts, estimates and targets are necessarily speculative, Revolution and the Company believe that the preparation of prospective financial information involves increasingly higher levels of uncertainty the further out the projection, forecast, estimate or target extends from the date of preparation. Actual results may
differ materially from the results contemplated by the financial projections, forecasts, estimates and targets contained in this Presentation, and the inclusion of such information in this Presentation should not be regarded as a representation by any person that the results reflected in such forecasts will be achieved.

Use of Non-GAAP Financial Metrics. This Presentation includes certain non-GAAP financial measures (including on a forward-looking basis) such as Adjusted EBITDA and Adjusted EBITDA Margin . These non-GAAP measures are an addition, and not a substitute for or superior to, measures of financial performance prepared
in accordance with GAAP and should not be considered as an alternative to net income, operating income or any other performance measures derived in accordance with GAAP. Reconciliations of non-GAAP measures to their most directly comparable GAAP counterparts are included in the Appendix to this
Presentation. The Company believes that these non-GAAP measures of financial results (including on a forward-looking basis) provide useful supplemental information to investors about the Company. the Company’s management uses forward-looking non-GAAP measures to evaluate the Company’s projected
financials and operating performance. However, there are a number of limitations related to the use of these non-GAAP measures and their nearest GAAP equivalents, including that they exclude significant expenses that are required by GAAP to be recorded in the Company’s financial measures. In addition, other
companies may calculate non-GAAP measures differently, or may use other measures to calculate their financial performance, and therefore, the Company’s non-GAAP measures may not be directly comparable to similarly titled measures of other companies. Additionally, to the extent that forward-looking non-GAAP
financial measures are provided, they are presented on a non-GAAP basis without reconciliations of such forward-looking non-GAAP measures due to the inherent difficulty in forecasting and quantifying certain amounts that are necessary for such reconciliations.

Trademarks. Revolution and the Company own or have rights to various trademarks, service marks and trade names that they use in connection with the operation of their respective businesses. This Presentation may also contain trademarks, service marks, trade names and copyrights of third parties, which are the property of their respective owners. The use or display of third parties’
trademarks, service marks, trade names or products in this Presentation is not intended to, and does not imply, a relationship with Revolution or the Company, or an endorsement or sponsorship by or of Revolution or the Company. Solely for convenience, the trademarks, service marks, trade names and copyrights referred to in this Presentation may appear without the TM, SM, ® or ©
symbols, but such references are not intended to indicate, in any way, that Revolution or the Company will not assert, to the fullest extent under applicable law, their rights or the right of the applicable licensor to these trademarks, service marks, trade names and copyrights.

Participants in Solicitation. Revolution and the Company and their respective directors and executive officers, under SEC rules, may be deemed to be participants in the solicitation of proxies of Revolution’s shareholders in connection with the proposed Business Combination. Investors and security holders may obtain more detailed information regarding the names and interests in the
proposed Business Combination of Revolution’s directors and officers in Revolution’s filings with the SEC, including Revolution’s registration statement on Form S-1, which was originally filed with the SEC on November 20, 2020. To the extent that holdings of Revolution’s securities have changed from the amounts reported in Revolution’s registration statement on Form S-1, such
changes have been or will be reflected on Statements of Change in Ownership on Form 4 filed with the SEC. Information regarding the persons who may, under SEC rules, be deemed participants in the solicitation of proxies to Revolution’s shareholders in connection with the proposed Business Combination is set forth in the proxy statement/prospectus on Form S-4 for the proposed
Business Combination, which is expected to be filed by Revolution with the SEC.

Investors and security holders of Revolution and the Company are urged to read the proxy statement/prospectus and other relevant documents that will be filed with the SEC carefully and in their entirety when they become available because they will contain important information about the proposed Business Combination. Investors and
security holders will be able to obtain free copies of the proxy statement and other documents containing important information about Revolution and the Company through the website maintained by the SEC at www.sec.gov. Copies of the documents filed with the SEC by Revolution can be obtained free of charge by directing a written request to Revolution Acceleration Acquisition
Corp 1717 Rhode Island Avenue, NW 10th floor, Washington, D.C. 20036.

No Offer or Solicitation. This communication is for informational purposes only and does not constitute, or form a part of, an offer to sell or the solicitation of an offer to sell or an offer to buy or the solicitation of an offer to buy any securities, and there shall be no sale of securities, in any jurisdiction in which such offer, solicitation or sale would be unlawful prior to registration or
qualification under the securities laws of any such jurisdiction. No offer of securities shall be made except by means of a prospectus meeting the requirements of Section 10 of the Securities Act of 1933 as amended, and otherwise in accordance with applicable law.

                                                                                                                                                                                                                                                                                                                                                                                                                2
We Help Retail, E-Commerce, Grocery, and Package Handling
     Companies Transform To Compete, Grow, and Win

                                                  Disruption

                                               $280+ Billion TAM

    Note: See page 15 for derivation of TAM.

                                                                   3
Today, Warehouse Operations Are Largely Manual

                             The Top 3 Industry Challenges Are:
    Labor Availability, Increasing Customer Demands, Increasing Competitive Intensity

                                                      Operations Need To Scale And Grow

           Source: 2019 MHI Annual Industry Report.

                                                                                          4
Berkshire Grey Transforms Warehouse Operations

      Comprehensive and Coordinated AI-enabled Robotics Across The Supply Chain

                 Fluid Flow Of Incoming Materials And Outgoing Orders
                          Flexible, Adaptive, On-demand, Fast
                                                                                  5
Revolution Overview

                                                                                                                     Revolution Team

  Revolution’s team is comprised of accomplished
  entrepreneurs with ample experience scaling and
  operating public companies                                                                                                             John Delaney
                                                                                                                                         Founder, CEO                P   A   R   T   N   E   R   S

Revolution’s World-Class Capabilities                                                                                                    and Chairman

       Business builders with experience navigating public and
 1     private markets

       A valuable network of relationships with decision makers in
 2     corporate America

 3     Significant public policy expertise
                                                                                                                                         Steve Case
                                                                                                                                         Founder and
 4     Top-tier reputation and accomplished management team                                                                              Director

 5     Strong track record of successful de-SPAC transactions(1)

                    (1)   Successful de-SPAC transactions involving Revolution Growth and Rise of the Rest Seed Fund include DraftKings, AppHarvest and Talkspace.
                                                                                                                                                                                                     6
Revolution’s Investment Thesis

 Revolution has identified Berkshire Grey as a unique and compelling opportunity to invest in and partner with
 Berkshire Grey is a pure play robotics company offering software-enabled, full spectrum automation solutions, poised to become an
 industry leader due to its differentiated technology and strong traction with blue-chip customers

        1    Category creator – a leading robotics company that fully integrates software, AI, hardware and solutions

               2       Leading technology in terms of both its component parts, and more importantly, its unique integrated solutions

                           Large market opportunity benefiting from digital economy acceleration due to COVID and increased
                   3       computing power

                            Strong projected growth story for the next five years and beyond backed by current $1.7bn+ pipeline from
                       4    blue-chip anchor customers and new customers

                           Attractive business model; asset light with significant potential recurring and re-occurring revenue streams
                   5       with Robotics-as-a-Service (RaaS)

               6       Amazon and competition are driving all e-commerce companies to innovate

             Accomplished leadership, Board of Directors, advisors and early investors, and strong existing customers position
        7    Berkshire Grey well for future outsized growth

                                                                                                                                          7
Transaction Highlights
Berkshire Pure play robotics company offering software-enabled, full spectrum solutions that change the
Grey automation paradigm across markets
Helping customers succeed in the warehouse automation and fulfillment market through intelligent
and connected automation
Transaction
Business combination of Berkshire Grey with Revolution (Nasdaq: RAAC)
Structure(1)
Revolution is a publicly listed special purpose acquisition company with $288 million cash held in trust
PIPE size of $165 million
Valuation $2.2 billion pro forma enterprise value
Attractively valued entry multiple for high growth business
Expected $507 million cash on balance sheet, no debt(1)
Capital
Structure Fully funded to cash flow profitability in 2024
Ownership Existing Berkshire Grey shareholders will be rolling 100% of their equity
Implied ownership of Berkshire Grey shareholders of 82%
Note: See page 38 for a detailed transaction overview.
(1) Assuming no redemptions.
8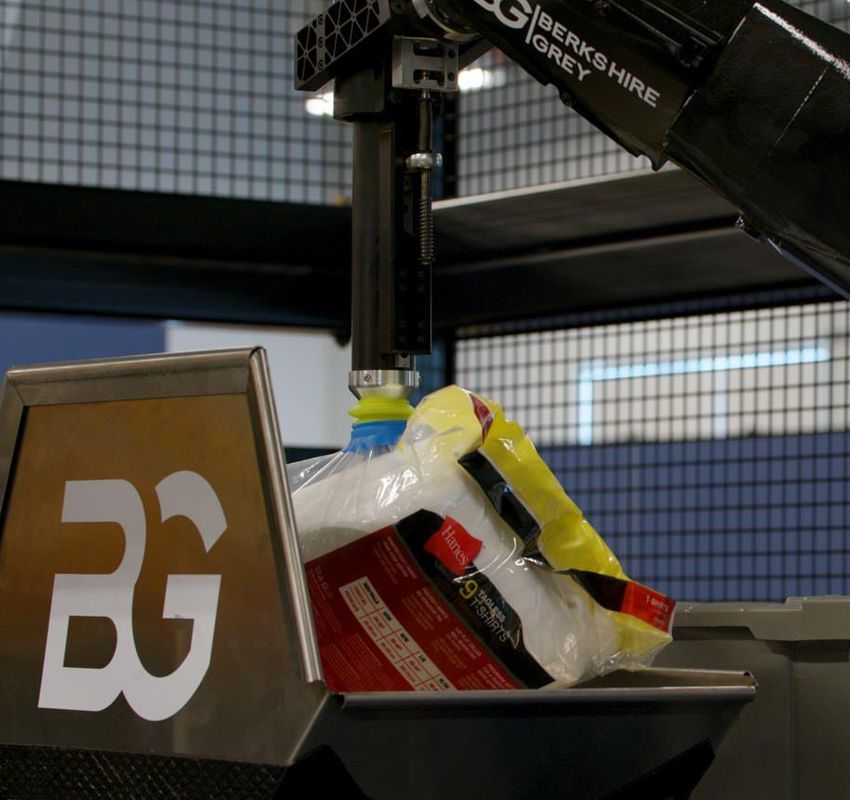
Berkshire Grey Presenters and Snapshot
Tom Wagner, PhD Steve Johnson Mark Fidler
Founder & CEO COO CFO
30 years robotics and technology 30 years career focused on delivering 28 years of senior finance, capital markets
executive with technology, commercial disruptive and impactful technologies to and leadership experience
and leadership expertise customers and scaling high-growth
companies globally Former Chief Financial Officer at NEC
Former Chief Technology Officer at Energy Solutions
iRobot Former Chief Commercial Officer at
Intelex
Company Overview Solutions Overview
Founded in 2013
Powerful cloud-enabled …delivered through …for multiple
In stealth mode until 2018 software platform… proprietary technology… application areas
Top-tier investors: E-commerce
Automated
robotic order fulfillment
Asset-light business model with no own manufacturing
picking
Industry disruptor enabling customers to transform their supply chains through Smart store
warehouse and logistics automation
+ = replenishment
Intellectual property protected by 300+ patent filings Intelligent
Artificial intelligence at mobility Dynamic parcel
$114m orders to date, $70m current backlog the core of the solution sortation
9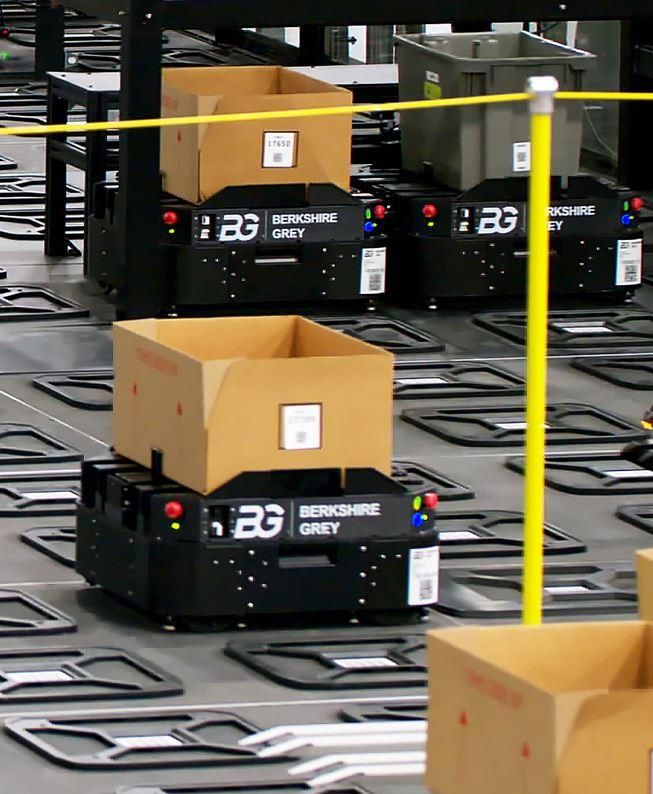
Transforming Commerce
Commerce Has Changed
Today, we want a large SKU selection
We have a low tolerance for substitutions
Consumer Expectations We price shop mercilessly
Have Changed
We think shipping is free
We want our goods today, tomorrow is ok
Amazon setting the pace
These Changes Have Created Continued and increasing shift to
e-commerce
A Battle For Retail
Brick-and-mortar retail leveraging both
warehouses and stores to fulfill any order
from anywhere at any time
11Supply Chain Operations Must Change Also
Today’s Operations Are Highly Manual At Berkshire Grey, We Automate These
Operations With AI-Enabled Robotics
Difficult to meet changing
consumer demands
Labor availability and
costs challenge growth A Flexible, Adaptive, On-Demand Flow Of Goods From
Retailers To Consumers
Berkshire Grey Can Change The Automation
Competition is Paradigm Across Markets
pronounced and
increasing
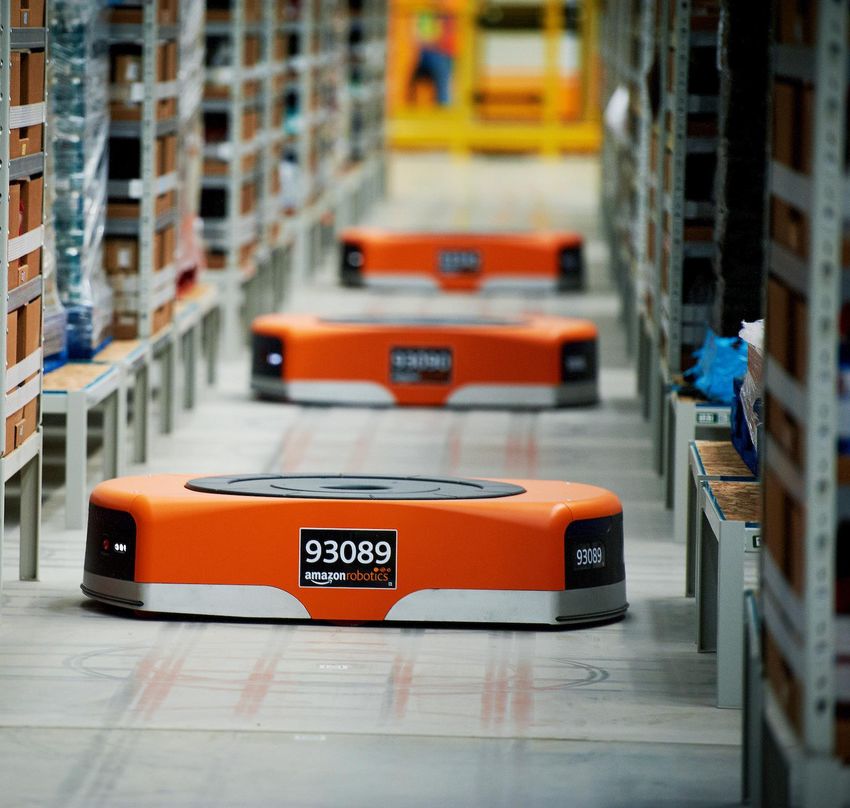
12There Is An “Amazon Effect” On Automation Driving All Retailers To Adapt
Amazon has it figured out AI-driven robotics enables Amazon to offer
with over 200,000 robots in service today. increased SKUs with fast fulfillment and free,
Since acquiring Kiva Systems, a robotics fast delivery, differentiating itself from
company, they have spent competitors
~$180bn on R&D and ~$93bn on CapEx
The Amazon effect is reality – market
Amazon has brought the participants must evolve to compete
automation wave into motion…
Disruption in order fulfillment has occurred
…and supercharged the need for all
competitors to adapt
Berkshire Grey offers a solution
Source: Amazon public filings.
13Berkshire Grey Solutions Enable Competitive Operational Efficiencies
Customer Objectives Automation Approach Berkshire Grey Value Proposition
Increase operational Automate material handling Allows for increased production utilization
efficiencies and fulfillment and ~2-3 year ROI
Augment or substitute 70% reduction in labor spend through
Reduce labor dependence labor-intense processes robotic picking and intelligent mobility
Throughput of 1 BG solution equal to that of
Increase speed, reliability and 8 manual pickers and 100s of case
Intelligent robotics
accuracy handlers, and at maximum reliability and
accuracy
Maximize flexibility and Modular automation Flexible installation with minimal downtime
scalability technologies and hassle-free expansion
Enhance supply chain Integrated software Modular and integrated software / AI
holistically architecture platform on the cloud
14$280+ Billion TAM And Growth Driven By Multi-Faceted Tailwinds
$280+ billion TAM
Key Tailwinds
Only 5% of warehouses are currently
automated
$230+ billion Emerging and rapidly growing
e-commerce, retail and logistics industries
Total annual warehouse labor spend(1)
Increasing need to automate picking –
90%+ currently done manually
+ Need for operational and process
improvements
$56 billion Rapidly accelerating adoption of
automation
Automated material handling equipment market
Expected to grow at 13% per year Emergence of new technologies and
advancements in robotics and AI
Source: McKinsey, Improving warehouse operations – digitally, 02/06/20; F. Curtis Barry & Company, Managing Your Warehouse Labor to Reduce Overall Expenses;
Mordor Intelligence, Automated Material Handling (AMH) Market - Growth, Trends, COVID-19 Impact, and Forecasts (2021 - 2026), 2020;
LogisticsIQ, Warehouse Automation: Rise of Warehouse Robotics, 2019. DHL, Robotics in Logistics, March 2016. 15
(1) Based on labor consuming ~65% of warehousing spend (F. Curtis Barry & Company) and total annual warehouse spend of $350bn (McKinsey, 02/06/20).Business Overview
Berkshire Grey’s Flywheel Enables Customers To Transform And Grow
Investment in Scalable Robotics Tangible Customer Outcomes
Accelerate
revenue growth
Revenue Growth Increased
& Lower Cost Operational
Profile Capabilities
Reduce costs
Increased SKU Coverage &
Drive innovation
Fulfillment Speed
17Experienced Management Team, Board & Advisors
Berkshire Grey Team Board of Directors and Advisors
Tom Wagner, PhD 30 Mark Fidler 28 Vinod Khosla
Founder of Khosla Ventures
CEO CFO
Management Team
Peter Barris
Chairman and Partner at NEA
Steve Johnson 30 Matt Mason, PhD 40
COO Chief Scientist Kenichi “Kent” Yoshida
CBO at SoftBank Robotics
Nadia Shouraboura, PhD
Over 50 new hires since beginning of Over 1,000 years of combined Former VP of Global Supply Chain and Fulfillment
2020, including seven GMs – robotics experience at Amazon
Commercial Team
Engineering Team
commercial build-out will remain a
Rich Boyle
focus for use of proceeds 75% of all employees have technical
General Partner at Canaan Partners
Each GM specializes in a focus degrees; 25+ PhDs
vertical or anchor customer; GMs
have ~32 years of experience on Technical experience across a wide Sven Strohband, PhD
average array of centers of excellence and CTO at Khosla Ventures
blue-chip firms
Widespread and global commercial
experience Tom Wagner, PhD
CEO
Experience
John Delaney(1)
Revolution Founder, CEO and Chairman
(1) To join board of directors upon closing of the transaction.
Years of experience 18Significant Commercial Validation And Momentum In 2020
Key Milestones
Pipeline accelerated through
scaling of commercial organization Commercial
validates opportunity
$1.7+ billion Expanded organization; hired seven
general managers
Current Pipeline
Visibility Significant traction with existing anchor
customers and active new customer
funnel
Now(1) Launched RaaS offering
Expanded into Europe
Visibility into future revenue from backlogFive Focus Verticals To Capture Potential Multi-billion Dollar Opportunity
Five Focus Retail E-Commerce Grocery Parcels 3PL
Verticals
Consumer expectations Rapid expansion of Online grocery delivery is Speed and accuracy is Third party logistics
require agile inventory e-commerce relative to growing and is here to stay essential for successful enables retailers and
management total retail parcel sortation manufacturers large and
small to outsource
Big-box to smaller Direct-to-consumer Chain grocers using Shipping firms across Global and domestic
chain brands channels manual labor the global supply 3PL providers
chain
Global retail sales were 2020 retail The global online Global 3PL market
Global small package
~$23trn(1) in 2020 and e-commerce sales market was $200bn in expected to reach
volume could have
growing rapidly were ~$4trn globally, 2020; expected to $1.7trn by 2025
reached ~130bn in
up over 16.5% YoY grow at ~16% through 2020 and could surge
2027 to over 300bn by 2026
Current Anchor
Customers
E-Commerce
E-Commerce spans each vertical and is driving rapid growth globally
EMEA EMEA spans each vertical with a dedicated General Manager
APAC
APAC spans each vertical and is a potential focus area moving forward
Source: Statista, 09/10/20; Business Insider, Global ecommerce market report: ecommerce sales trends and growth statistics for 2021, 12/30/20; Online Grocery - Global Market
Trajectory & Analytics, 09/07/20; Pitney Bowes, Parcel Shipping Index, 10/12/20;
Mordor Intelligence, Global Third-party Logistics (3PL) Market - Growth, Trends, COVID-19 Impact, and Forecasts (2021 - 2026), 2020. 20
(1) Includes grocery sales.Anchor Customer Overview
Significant
penetration
potential $11bn 3,979 $3bn 1,910 $6bn 605 $1bn 29
2021E Distribution 2021E Distribution 2021E Distribution 2021E Distribution
CapEx centers(1) CapEx centers(2) CapEx centers CapEx centers
Penetration and cross-sell within same
Immediate commercial opportunity
Targeted customer
commercial
strategy across
verticals
High-level executive access Desire to roll-out automation globally
Significant penetration potential, with $1.3bn+ 5-year pipeline
Conversion of Multiple upside opportunities exist in the long-run
large
Aggregate revenue represents only a small percentage of current anchor customer CapEx
opportunity into
revenue Mix shift to recurring and re-occurring revenue as Berkshire Grey scales
Significant opportunity to monetize large and growing installed base
Source: Company management, public filings and FactSet.
(1) Includes US supercenters.
(2) Includes stores. 21Current Visibility To $1.7+ Billion Pipeline
Total Current Pipeline (as of February 1, 2021)
($ in billions) Anchor customers expected to roll-out Berkshire Grey’s
technology broadly
Future New
Customers
Scalability – follow-on opportunities move more quickly
through the sales cycle
Active New
$0.4 Customer Pipeline ~85% and ~40% of 2021E and 2022E revenue,
and Funnel respectively, in backlog and under negotiation
$1.7bn+ Significant commercial momentum driven by Berkshire
Grey solutions as enabler for customer success
Pipeline
(current view) $1.3
Anchor Customers New Customers Key Stats
(5-Year Visibility)
163 119
New pipeline opportunities Unique new customers
in the pipeline
$27m $12m
$114m $70m Orders from new customers
to date
Current new customer
backlog
Total orders to date Current total backlog
22Robust Potential For Acquisitions
Upside To Financial Plan
Scoping
Numerous global industrial robotic
100+ automation opportunities
opportunities
Examining
Complementary
Examining and adjacent
50+ technologies
further
to enhance product portfolio
opportunities
Priority
Candidates that could add immediate
5+ value
opportunities
23Technology Platform
Foundation For Autonomous Warehouses: Picking, Mobility, Orchestration
Each Has Many Advanced AI and Differentiated Hardware Elements

                                                                         25
Integrated Full Solutions Designed To Hit Performance Requirements and Generate ROI
Not Just Components
26AI Drives The Capabilities
Artificial intelligence is at the core of the solution
Berkshire Grey offers a complete enterprise software suite
Systems of Computer
systems vision & scene Proprietary cloud-enabled artificial intelligence
orchestration understanding
Different AI subsystems combined with patented and
proprietary hardware (scanners, sensors, grippers, robots) to
AI enable solutions
Holistic
sensing, Motion Systems work when deployed
haptics & planning
inference
− Do not require years of learning or training to hit metrics
− Learn and improve on a continuous basis
Machine Grasp
Interfaces with customers’ existing technology stacks
learning planning
Enables remote monitoring by mobile devices
IT integration / API Mobile user interface Technology offering includes remote monitoring and
management, optimization and analytics
Remote monitoring, management, and software maintenance
Scalable, adaptable, and reliable AI to automate tasks that have never before been performed by machines in commercial settings
27Solution Leadership Through AI Combined With Differentiated Hardware
Competitive advantage comes from
…physically realized through
powerful intelligent algorithms (AI) …combined to create customer solutions
differentiated hardware…
and software…
Automated 15 major product
robotic picking models
Computer
vision and Motion Solving customer
Grasp planning
scene planning needs from
understanding
Intelligent robotic picking-and-
mobility packing in
e-commerce to
same day grocery
to store
Sophisticated replenishment
Holistic Systems of
Machine robotic perception
sensing, haptics systems
learning
and inference orchestration
Differentiated technology across software and hardware protected by 300+ patent filings
28Berkshire Grey’s Unique, Holistic And Integrated Offering
Picking Mobile Software
(EOAT, AI) Robotics(1) AS/RS(2) Sortation Sensing (WMS)
Integrated AI-Driven Learning
Intelligence
Collaborative Orchestration
Automated Each- And Case-Picking
Picking Gentle Placement Into Containers
Efficient Routing
Intelligent
Mobility
Multi-Channel Workflow Sortation
Aisle-Friendly Sequencing
Item Identification
Perception
Attribute Capture
Brownfield Integration
Flexibility
Scalable Deployment, Adaptable
Sector Evolution Evolving Maturing Maturing Maturing Mature Mature Mature
Transformation Across Warehouse Supply Chain
Note: WMS stands for Warehouse Management (1) Includes automated guided vehicles and autonomous mobile robots.
Software. (2) Automated storage and retrieval includes cubic, shuttle, mini load, carousel / vertical life module.
EOAT stands for end of arm tooling. 29Validated and Trusted Attributes of Berkshire Grey Technology
Key Traits of a Desired Technology Solution BG Capability Key Traits of a Desired Technology Solution (cont’d) BG Capability
Flexibility Layout can fit any warehouse Accuracy
shape or size Maximum picking and mobile >99%
robotics accuracy accuracy
Complete and integrated
software-led customer solutions
Integration
Suitable for brownfield
upgrades and greenfield Integrated with existing HW &
SW architecture
Reliability System redundancy and no
single point of failure
Efficiency
>99% Significantly increases ~2-3 Year
Maximum uptime operational efficiency ROI
uptime
Scalability Incremental additions with
minimal downtime Performance System performance
guaranteed and tied to key
Hassle-free and quick capacity metrics (e.g., overall
expansion throughput)
30Financial Overview
Revenue Expected To Grow To $927 Million By 2025
Strong Commercial Momentum With $70 Million Backlog
Projected Revenue by Strategic Platform
($ in millions)
% Projected YoY growth 69% 102% 109% 99% 88%
$927
$495
$248
(3)
(2) $119
$35
(1) $59
2020E
2020A 2021E 2022E 2023E 2024E 2025E
Anchor Customers New Customers Robotics-as-a-Service Services
Significant penetration Accelerated pipeline momentum Growth in RaaS and emergence Value-add services, remote
opportunity over many years driven by ramp-up of commercial as key part of Berkshire Grey’s management and monitoring as
organization recurring revenue streams well as maintenance services
Multiple follow-on opportunities
revenue expected to grow with
as well as extensions and 119 potential customers identified
installed base and increasing
upgrades – pipeline of 163 projects with
services scope
total value of $0.4bn
$1.3bn+ pipeline through 2025
Source: Company management.
(1) 2020 reflects preliminary actuals.
(2) Includes $47m under contract and $2m agreements subject to negotiations as of 02/01/21. 32
(3) Includes $23m under contract and $23m agreements subject to negotiations as of 02/01/21.Berkshire Grey’s Projected Gross Profit And Adjusted EBITDA(1) Development
Projected Gross Profit(2)
($ in millions)
% margin 8% 7% 23% 36% 44% 48%
$441
$217
$90
$28
$3 (3) $4
2020A
2020E 2021E 2022E 2023E 2024E 2025E
Projected Adjusted EBITDA(1)
($ in millions)
% margin 8% 25%
$232
$41
($55)(3) ($54)
($91) ($96)
2020E
2020A 2021E 2022E 2023E 2024E 2025E
Source: Company management.
(1) Excludes stock-based compensation and depreciation and amortization. Adjusted EBITDA is a non-GAAP measure. See reconciliations of historic measures in Appendix.
(2) See page 34 for the assumptions underlying the projected gross profit and adjusted EBITDA. 33
(3) 2020 reflects preliminary actuals.Operating Leverage And Scale Drive Projected Adjusted EBITDA(1) Growth
Projected Gross Profit(2) (% margin) Projected Adjusted EBITDA(1) (% margin)
48% 25%
2021E 2022E 2023E 2024E 2025E 2021E 2022E 2023E 2024E 2025E
Significant operations overhead leverage expected to be attained by Berkshire Grey’s business is asset-light with manufacturing completed
increased volume through contract manufacturers
Well-defined initiatives in place
Expected to enable Berkshire Grey to achieve significant operating
− Supply chain efforts include volume pricing from contract leverage as revenue scales
manufacturers and commodity cost reduction initiatives
− Engineering programs specifically focused on reducing component
costs through redesign efforts
Defined pathway to 50%+ gross margin and 25%+ Adj. EBITDA(1) margin
Source: Company management.
(1) Excludes stock-based compensation and depreciation and amortization. Adjusted EBITDA is a non-GAAP measure. See reconciliations of historic measures in Appendix.
(2) Includes direct and indirect costs of goods sold (including operations). 34Potential Upside Opportunities Not In Current Plan
Accelerate Robotics-as-a-Service business build-out
Recurring & Re-
occurring Revenue Increase software and services scope, leverage installed base and upgrades /
extensions – expand re-occurring revenue scheme
Accelerate Sales Leverage commercial momentum and build out commercial team faster
Geographic
Accelerated expansion into European and Asian markets
Expansion
Strategic partnerships
Inorganic
Pursue strategic acquisitions to broaden offerings even further
Expand product portfolio
Adjacencies
Tap new market verticals
Significant potential upside opportunities ahead based on well-defined strategic initiatives
35Closing Remarks
Transforming warehouse operations; $280+ billion TAM
AI-enabled technology which is best in class
Category creator – complete foundation for
automated operations: picking, mobile, orchestration
$1.7+ billion pipeline, accelerating commercial
momentum
Right time for Berkshire Grey, entering a period of
transformative growth
Note: See page 15 for derivation of TAM.
36Transaction & Valuation Overview
Detailed Transaction Overview
Transaction Overview Illustrative Pro Forma Valuation and Sources & Uses
($ in millions, except per share data; shares in millions)
Pro forma enterprise value of $2,234m (2.4x 2025E revenue)
Total Enterprise Value Summary
$413m cash proceeds inclusive of $165m PIPE proceeds and transaction Berkshire Grey share price $10.00
expenses(1) (X) Pro forma share outstanding 274.1
Pro Forma Equity Value $2,741
Pro forma net cash of $507m
(–) Current cash (94)
− No debt (–) Net proceeds (413)
Pro Forma Enterprise Value $2,234
− Inclusive of $94m cash currently on balance sheet
Valuation Multiples Metric
Berkshire Grey shareholders are rolling 100% of equity ownership EV / 2025E Revenue $927 2.4x
(2)
EV / 2025E Adj. EBITDA $232 9.6x
Pro Forma Ownership @ $10.00 per Share(1,3) Sources $ % Shares
Rollover equity $2,250 82% 225.0
PIPE investors Founder shares
6% 1% RAAC cash in trust 288 10% 28.8
Revolution public PIPE investment 165 6% 16.5
shareholders Founder shares 38 1% 3.8
10% Berkshire Total Sources $2,741 100% 274.1
Grey existing Uses $ %
shareholders
82% Rollover equity $2,250 82%
Cash to balance sheet 413 15%
Founder shares 38 1%
Estimated fees and expenses 40 1%
Total Uses $2,741 100%
Note: Figures may not total due to rounding. before 3rd anniversary, $23.00 before 6th anniversary or $35.00 before 9th anniversary of a business
(1) Assumes no redemption of public shares, no earn-out shares issued and a PIPE of $165m. combination, 5.2m founder warrants and 9.6m of Revolution’s public warrants, which have a strike price
(2) Adjusted EBITDA is a non-GAAP measure. Excludes stock-based compensation and depreciation and
amortization. See reconciliations of historic measures in Appendix.
of $11.50 per share. The founder shares are held by Revolution’s sponsor and certain of its directors and
advisors that convert into Class A common stock at the completion of the business combination. 38
(3) Additional dilutive securities include 5.75m Revolution alignment shares that vest at the earlier of $15.25 Excludes share that may be issued to Berkshire Grey employees pursuant to Berkshire Grey’s incentive
plan.Selected Public Comparable Universe For Berkshire Grey
Automation-Oriented Industrial Technology Automation Software
Traditional established players Visibility via SaaS models
Focus on equipment / components Mostly subscription based
High-value branded / IP products Strong margin profile
E-Commerce Enablers Recent De-SPAC
Similar end-market dynamics in retail Recent transaction in automation ecosystem
Fulfillment automation and network as strategic pillar Technology-enabled, valued-added industrial equipment
39Selected Operational Benchmarking
Recent
Automation-Oriented Industrial Technology Automation Software E-Commerce Enablers De-SPAC
CY2020E – CY2022E
Average: 8% Average: 11% Average: 24%
99%
Revenue CAGR
Median: 7% Median: 12% Median: 20%
87%
35%
20%
13% 14% 15%
13% 11% 13%
7% 7% 8% 9% 8%
6%
21-25E 21-25E
Average: 54% Average: 82% Average: 44%
Median: 58% 89% 92% Median: 81% Median: 40%
Gross Margin
74% 81% 81% 74% 74%
CY 2021E
64% 58%
48% 53% 54%
41% 36% 40% 38%
2025E 2025E
Average: 29% Average: 40% Average: 10%
EBITDA Margin(1)
Median: 30% 56% Median: 37% Median: 12%
45%
41%
CY 2021E
37% 33% 33%
30% 32% 32% 28%
25% 21% 24%
15% 12%
4%
2025E 2025E
(2)
Source: Company management, public filings and FactSet as of 2/9/21. Appendix.
Note: Each group is sorted by enterprise value. (2) Desktop Metal projections based on 8/26/20 investor presentation.
(1) Berkshire Grey based on Adj. EBITDA that excludes stock-based compensation and depreciation and 40
amortization. Adjusted EBITDA is a non-GAAP measure. See reconciliations of historic measures inSelected Valuation Benchmarking
Recent
Automation-Oriented Industrial Technology Automation Software E-Commerce Enablers De-SPAC
Average: 8.1x Average: 13.1x Average: 18.5x
Median: 6.2x Median: 14.2x Median: 7.1x
EV / CY 2021E Revenue
44.9x
18.5x
17.3x
15.0x 14.8x
13.6x
10.1x
6.6x 6.2x 6.5x 7.1x 7.3x
6.0x
4.2x 3.6x
2.4x
2025E 2025E
Average: 21.0x Average: 33.0x Average: 23.9x
46.5x
EV / CY 2021E EBITDA(1)
Median: 20.1x Median: 32.0x Median: 23.9x
40.8x
33.4x
30.7x
26.1x 26.2x 25.8x
23.9x
19.8x 20.4x 20.4x
17.9x
9.6x
NM NM NM
2025E 2025E
(2)
Source: Company management, public filings and FactSet as of 2/9/21. depreciation and amortization. Adjusted EBITDA is a non-GAAP measure. See
Note: NM denotes not meaningful (negative or >50.0x). reconciliations of historic measures in Appendix.
Each group is sorted by enterprise value. (2) Desktop Metal projections based on 8/26/20 investor presentation. 41
(1) Berkshire Grey based on Adj. EBITDA that excludes stock-based compensation andTransaction Priced At A Discount To Selected Peer Multiples
Implied EV Based on Selected Comparable Companies Trading Transaction Value
($ in millions; implied future and discounted EV rounded to the nearest $5m)
Implied Future EV Implied Discounted EV Implied Post-Money EV
$9,275
Midpoint represents
60% upside to
transaction value
$5,565 $4,475
Midpoint represents
232% upside to $2,234
transaction value $2,685
Implied Multiples
EV / 2025E Revenue 6.0x – 10.0x 2.9x – 4.8x 2.4x
EV / 2025E Adj. EBITDA(1) 24.0x – 40.0x 11.6x – 19.3x 9.6x
Using a future valuation date of 12/31/2024, Berkshire Grey is valued by applying 2025E revenue of $927m to a EV/NTM revenue
multiple of 6.0 – 10.0x based on peer multiples, which results in an implied future EV of $7,420m
Valuation Approach The implied future EV is then discounted 20% over a 4-year period to arrive at an implied present value of $3,580m(2)
Transaction priced at a substantial discount
Source: Company projections.
(1) Excludes stock-based compensation and depreciation and amortization. Adjusted EBITDA is a non-GAAP measure. See reconciliations of historic measures in Appendix.
(2) Assumes a 20% discount rate; based on midpoint of implied future enterprise value of $7,420m. 42Appendix
Berkshire Grey Financial Summary

                                                                                                                                                        '20E - '25E
($ in millions)                                          2020A              2021E             2022E             2023E             2024E         2025E     CAGR

Total revenue                                            $35               $59             $119              $248               $495           $927        93%
  % growth                                               337%               69%              102%              109%                99%           88%
Gross profit                                               $3                $4              $28               $90              $217           $441
  % margin                                                  8%                7%               23%               36%               44%           48%
Adj. EBITDA(1)                                          ($55)             ($91)             ($96)             ($54)              $41           $232
  % margin                                               NM                NM                NM                NM                   8%           25%
       (2)
FCF                                                     ($65)             ($95)           ($115)              ($85)                $4          $145

Adjusted EBITDA Reconciliation
($ in millions)                                      2020A             2021E             2022E             2023E              2024E           2025E

EBIT                                                    ($61)            ($100)            ($109)             ($72)               $14          $189
  Depreciation & amortization                                1                 2                 4                 8               14            24
  Stock-based compensation                                   5                 7                 9               11                14            18
                  (1)
Adjusted EBITDA                                         ($55)             ($91)             ($96)             ($54)              $41           $232

Free Cash Flow Reconciliation

($ in millions)                                      2020A             2021E             2022E              2023E             2024E           2025E

  CF from operations                                    ($57)             ($90)             ($98)             ($62)               $40          $223
  CF from investing                                         (7)               (5)             (17)              (23)              (36)          (77)
Free cash flow                                          ($65)             ($95)           ($115)              ($85)                $4          $145

                        Source: Company management.
                        Note: NM denotes not meaningful.
                                2020 reflects preliminary actuals.                                                                                                    44
                        (1)     Excludes stock-based compensation and depreciation and amortization. Adjusted EBITDA is a non-GAAP measure.
                        (2)     Cash flows from operating activities less cash flows from investing activities.
You can also read