Cryptocurrency Miners - Can a select few escape the volatility and generate sustainable shareholder returns? - Elwood Asset Management
←
→
Page content transcription
If your browser does not render page correctly, please read the page content below
Cryptocurrency Miners
Can a select few escape the volatility and generate sustainable
shareholder returns?
Elwood Research Series
04 February 2020
Elwood Asset Management LLP
Your attention is drawn to the section entitled “Important information” at the end of the note. © Elwood Asset Management LLP. All rights reserved Page 1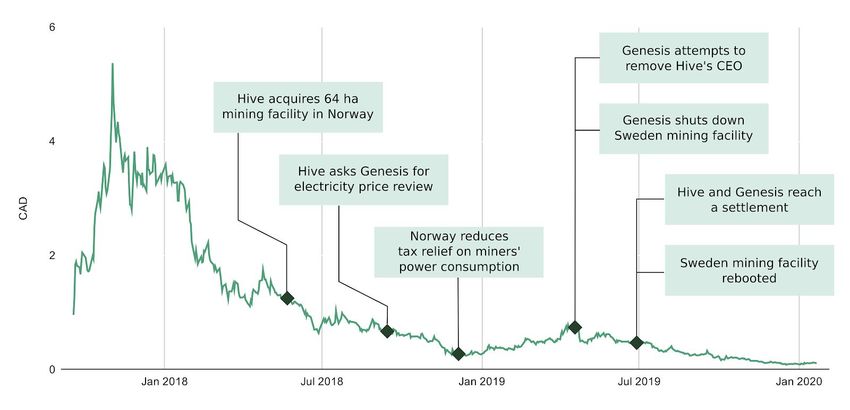
About Elwood Asset Management
Elwood Asset Management (“Elwood”) is an investment firm specialising in providing investors exposure to digital
assets and blockchain technologies.
The Elwood Blockchain Global Equity Index aims to offer exposure to listed companies that participate or have the
potential to participate in the blockchain or cryptocurrency ecosystem. The index aims to capture the potential
investment upside generated by earnings related to the adoption of blockchain technologies or cryptocurrency. It is
designed to evolve with the future development of the blockchain space.
The index is independently calculated and distributed by Solactive and is reviewed and rebalanced quarterly.
Invesco has partnered with Elwood to launch an ETF and a Japan domestic mutual fund that aim to deliver the
performance of the Elwood Blockchain Global Equity Index by physically investing in the index constituents.
Index
Ticker Name
BLOCK Index Elwood Blockchain Global Equity Index
ETF
Ticker Exchange
BCHN LN London Stock Exchange - USD
BCHS LN London Stock Exchange - GBP
BNXG GY Börse Frankfurt - EUR
BCHN IM Borsa Italiana - USD
BCHE SW SIX - USD
Investment Fund
Japan domestic mutual fund
Invesco World Blockchain Equity Fund
Contacts
www.elwoodam.com
block@elwoodam.com
twitter.com/Elwood_AM
Your attention is drawn to the section entitled “Important information” at the end of the note. © Elwood Asset Management LLP. All rights reserved Page 2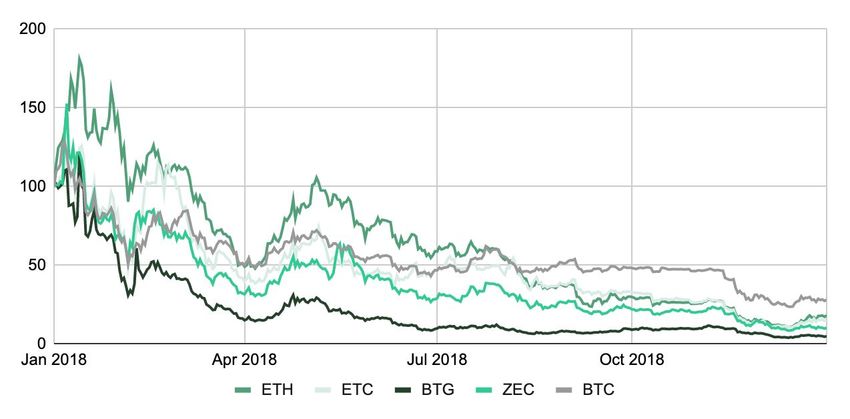
Abstract
In this report we seek to shed light on the four publicly listed cryptocurrency mining stocks: Hut 8 Mining,
Bitfarms, Hive Blockchain Technologies and Argo Blockchain. We evaluated the miners using our own custom
EBIT measure, which applied the same depreciation policy across all the companies. Using this methodology one
can compare the profitability of the companies, while normalising for differences in depreciation policies or the
timing of impairments, which can be quite significant due to the large expenditure on mining equipment. Our
analysis shows that Hut 8 Mining was the most capital efficient listed cryptocurrency miner during 2019, as it was
the only profitable company on our adjusted EBIT basis. This is a very different picture than one would get by
looking at the reported EBIT figures. In addition, our analysis suggests that the remaining listed mining
companies are placed too high in the mining cost curve, leading to poor capital returns and negative free cash
flow generation. Bitcoin’s block reward halving in May 2020, could exacerbate the challenges some of these
listed miners are facing. However, we think there are still investment opportunities available in this $5 billion a
year industry, one just needs to be highly selective.
Ticker Company Market Cap Total mining SHA-256 hash H1 2019 Gross H1 2019 adj.
(US$m) capacity* (MW) rate* (PH/s) mining margin** EBIT margin
HUT CN Hut 8 Mining 109.4 107 952 43% 16%
BITF CN Bitfarms 39.8 64 813 63% (71%)
HIVE CN Hive Blockchain 42.0 24 100 30% (188%)
ARB LN Argo Blockchain 26.1 64 581 51% (6%)
(Source: Market Cap, Bloomberg, data as of 30/01/2020, mining capacity and hash rate from company website as of 30/01/2020, ** only including electricity and
hosting costs for mining)
Introduction
Companies in the blockchain space have managed to raise a significant amount of capital, however most are still
privately held. The same applies to the cryptocurrency miners, with the exception of four of them, which have become
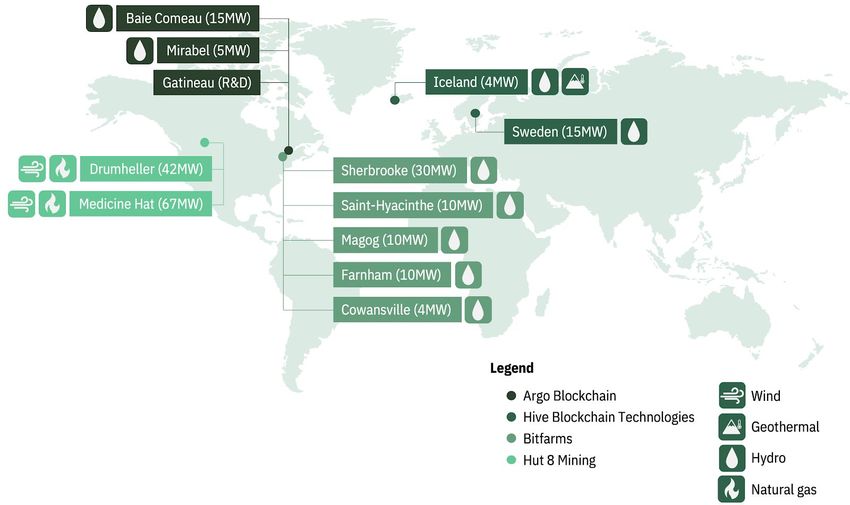
listed in Canada and the UK. In this report, we aim to evaluate them and assess the investment opportunities.
Geographic distribution of listed cryptocurrency miners
(Source: Elwood research)
Your attention is drawn to the section entitled “Important information” at the end of the note. © Elwood Asset Management LLP. All rights reserved Page 3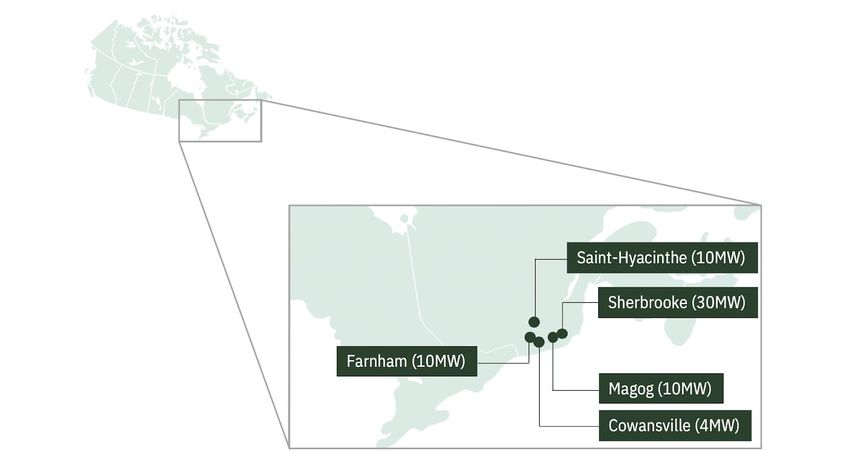
What is Bitcoin mining?
Bitcoin is an electronic currency, aiming to capture some of the peer to peer like characteristics of physical cash, by
avoiding third party financial intermediaries when engaging in electronic transactions. Bitcoin uses a peer-to-peer
network of nodes to generate, process and distribute transactions. Miners are nodes with a very specific role: update
the public ledger by packaging new transactions into a block of transactions. Miners compete to update the public
ledger by trying to build their own block proposal. This process prevents the inclusion of conflicting valid transactions in
the public ledger, by a quasi random competitive process, thereby avoiding a centralised third-party financial
intermediary to resolve these conflicts.
The mining competition involves the use of highly intensive processing resources to solve a mathematical puzzle: the
first miner who solves it disseminates the new block into the network. Every validating node will independently verify
the correctness of the information inside the block. The diagram below shows a simplified mining process with two
miners.
Mining process and new block inclusion
(Source: Elwood research)
In case of success, every node links the new block (b+1 in the diagram above) to the previous block considered to be
the last mined (b), forming an ever-growing blockchain. The competition will then start over with new block proposals
containing transactions not yet included in the current state of the blockchain. As noted before, different miners may
produce blocks containing different sets of transactions (shaded squares within candidate blocks in the diagram). Each
puzzle attempt is represented by an operator H (i.e. hash). Miner A solves the puzzle for block b+1 after n attempts (Hn).
Mining requires significant investment to purchase state-of-the-art hardware and perform efficient computations to
remain competitive. The activity is supported by an economic incentive: the miner who solves the puzzle is rewarded
with a specific amount of newly minted bitcoin, in addition to the sum of all the transaction fees for the transactions
included in the block.
Miners are also compelled to play by the rules: mining is expensive and miners are rewarded in the underlying mining
currency, Bitcoin. The amount of new minted bitcoin is set by the protocol and cannot be modified. If a dishonest miner
tries to award themselves with a higher number of bitcoin, every node in the network will automatically reject the
proposed block. In this case, the dishonest miner will have wasted computational resources for mining a block which
would not have been accepted by the network.
Your attention is drawn to the section entitled “Important information” at the end of the note. © Elwood Asset Management LLP. All rights reserved Page 4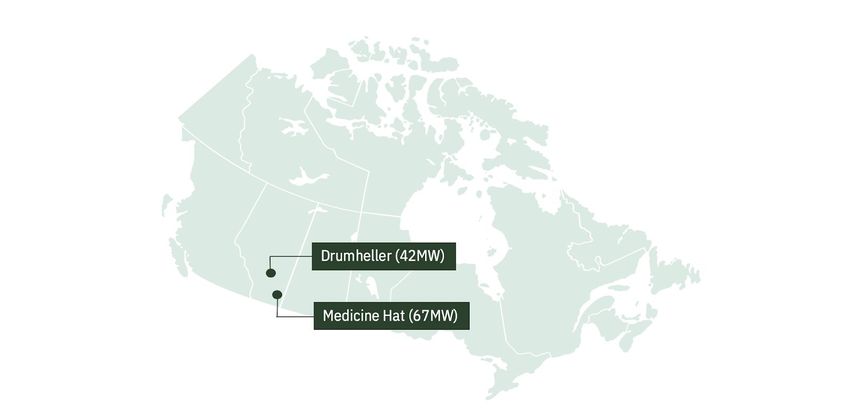
Bitcoin mining is designed to be an open and competitive process. However, there are some economies of scale, that
therefore significant investments may be required in order to achieve meaningful profits.
Miners use a considerable amount of electricity power (measured in Watts) and power cost is one of the key
profitability drivers. Mining operations performance is measured in hashes per second (H/s), which is the number of
attempts to solve the puzzle each second. The chart below shows the growth of the Bitcoin network hash rate over
time, which is analogous to the amount of computing power being used to secure the network.
Bitcoin hash rate and price since 2013
(Source: Blockchain.com)
Overview of the Bitcoin mining industry
With the significant price appreciation of Bitcoin since its inception in 2009, the Bitcoin mining space has grown into a
professional and large-scale industry. The total Bitcoin mining revenue for the year of 2018 was over $5.3bn, as shown
below, and since Bitcoin was first launched in 2009, a total of $15bn in revenue has been earned by miners. This is
therefore a reasonably large industry, which does present opportunities for investors and entrepreneurs.
However, as the industry is relatively new, many investors and businesses have struggled to allocate capital in a
sensible way, by failing to appreciate the cycles and nuances in the industry. However, we think it is possible to build a
robust and sustainable business if one can lower their costs and place themselves within the lower end of the cost
curve. As with most mining operations, digital or not, being in such a position can lead to stable levels of earnings,
despite the high degree of volatility in the underlying cryptocurrency.
Your attention is drawn to the section entitled “Important information” at the end of the note. © Elwood Asset Management LLP. All rights reserved Page 5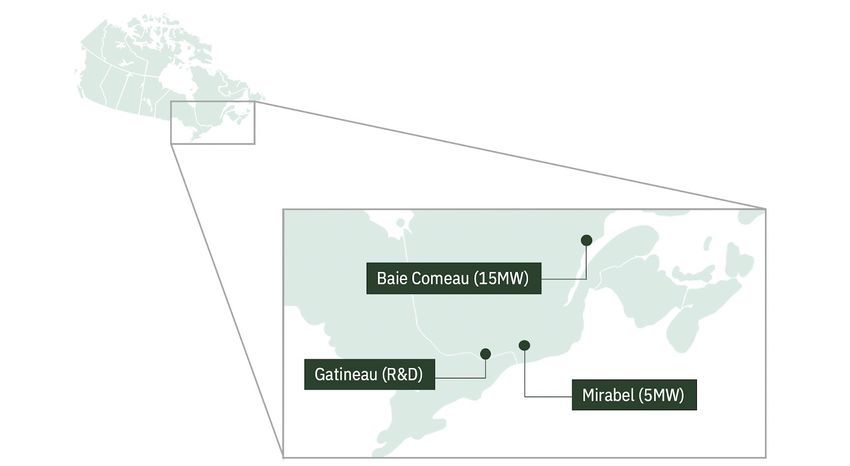
Annual Bitcoin mining revenue
(Source: Bloomberg, Quandl)
Factors that impact mining profitability
The main factors which impact a cryptocurrency miner’s profitability are:
● Cost of electricity and supply stability. These factors have a large role in determining cryptocurrency mines are
located. Firms aim to operate mining farms in areas with constant and cheap electricity supply (typically less
than $50/MWh). For instance, regions with abundant hydroelectric power are particularly desirable as the
marginal cost of power generation is very low, while power is reliable and stable.
● Efficiency and reliability of hardware. This factor is determined by the type of hardware the company has
deployed as well as its ability to keep the equipment up to date and well maintained in order to maximise uptime
and performance. In addition to other costs (e.g. cooling, staff and administration costs), higher end hardware is
more expensive to acquire and requires constant investment and upgrades in order to keep efficiency levels.
Miners need cryptocurrency friendly jurisdictions with cooler climates and, as defined above, cheap electricity to
achieve the best operating performance. Given the significant share of electricity within mining costs, it comes as no
surprise that geographies offering the cheapest electricity are the preferred ones by cryptocurrency miners (see chart
below). The exception is Russia, which does have a suitable climate for mining operations, but legal barriers and
international sanctions could create a challenging environment for miners.
Your attention is drawn to the section entitled “Important information” at the end of the note. © Elwood Asset Management LLP. All rights reserved Page 6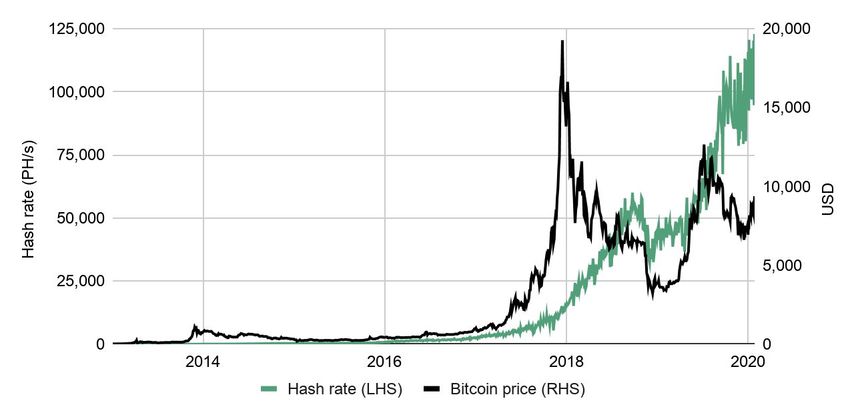
Electricity prices in Europe and North America
(Source: Elwood research, Bloomberg; as at 20 Jan 2020)
Note: although no comparable data is available, Statistics Iceland suggests power prices in the country are the lowest in the rest of the Nordic region.
Benchmarking cryptocurrency miners
In this section, we aim to benchmark the operating capacity and profitability of the four listed cryptocurrency mining
companies. The largest listed miner is Hut 8, with 107MW of mining capacity, allowing the company to achieve a hash
rate of 952 PH/s (petahashes per second).
Listed cryptocurrency mining companies by mining capacity and hash rate
(Source: Bloomberg, company data)
As would be expected, the companies with the largest mining capacities and hash rates are also the ones that produce
most bitcoin. Below, we show the quarterly number of mined bitcoin per company - Hut 8 mined 1,965 units in the
quarter to September 2019, while Argo Blockchain had the lowest output, with 426 mined units.
Your attention is drawn to the section entitled “Important information” at the end of the note. © Elwood Asset Management LLP. All rights reserved Page 7
Amount of bitcoin mined per quarter
(Source: Elwood research, company data)
We have also analysed the gross cost per bitcoin mined, defined as the electricity cost to mine. Hive Blockchain has
incurred the highest cost per mined bitcoin in the quarters to December 2018 (when it initiated Bitcoin mining) and
June 2019. In contrast, Bitfarms has had the lowest electricity costs in five of the six quarters we have analysed.
Gross (electricity) cost per mined bitcoin
(Source: Elwood research, company data)
Despite some variations, mining costs seem to have hovered around or below $4,000 for listed miners in 2019, well
below the $7,670 bitcoin price average over the past twelve months (as of 27 January 2020). A Bloomberg report1 from
January 2019 suggested Chinese companies were mining at around $2,400 in Q4 2018, nearly 30% below the most
efficient listed player in the period (Bitfarms). This suggests some of the listed miners are likely to be marginal
1
Source: Bloomberg [link]
Your attention is drawn to the section entitled “Important information” at the end of the note. © Elwood Asset Management LLP. All rights reserved Page 8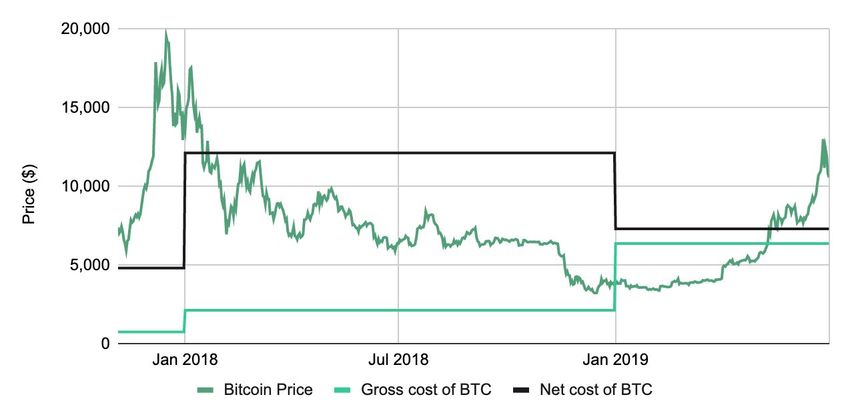
producers, and could become more loss making or even go out of business in the event of a large and prolonged
downward price swing.
A considerable challenge is likely to arise in May 2020, when the Bitcoin mining reward is expected to half, from 12.5
bitcoin per block to 6.25 bitcoin per block. This means that, for the same input, miners will receive half the amount of
currency they currently do. All else equal (e.g. Bitcoin price, average cumulative fees per block), this would lead miners
to just break even on the gross profit level, leaving very little resources to cover for ongoing operating costs and
reinvestment in the business. For miners with some cash availability, they could increase their competitiveness and
remain in business by acquiring newer, more efficient equipment. Those with limited cash resources are likely to be
pushed out of business, reducing the number of players in the industry. This adjustment would result in lower difficulty
and increased earnings for the remaining miners, being especially beneficial for companies lower in the cost curve.
Some of the listed cryptocurrency miners also produce other coins, such as Ethereum, Litecoin, Dash, etc. Company
reports allowed us to benchmark Ethereum, which used to be mined by Bitfarms and is still part of Hive’s mining
portfolio. Throughout the January 2018 - June 2019 period, Ethereum mining costs ranged between $100 and $230,
with the latest figures from Hive suggesting it cost the company around $130 to mine one unit of Ethereum (ether).
Gross (electricity) cost per mined ether
(Source: Elwood research, company data)
In order to benchmark the miners’ profitability, we have calculated a gross mining margin for the first half of calendar
2019, where:
By this metric, Bitfarms comes at the top, with a H1 2019 gross mining margin of 56%, followed by Argo Blockchain,
then Hut 8 and Hive Blockchain.
Your attention is drawn to the section entitled “Important information” at the end of the note. © Elwood Asset Management LLP. All rights reserved Page 9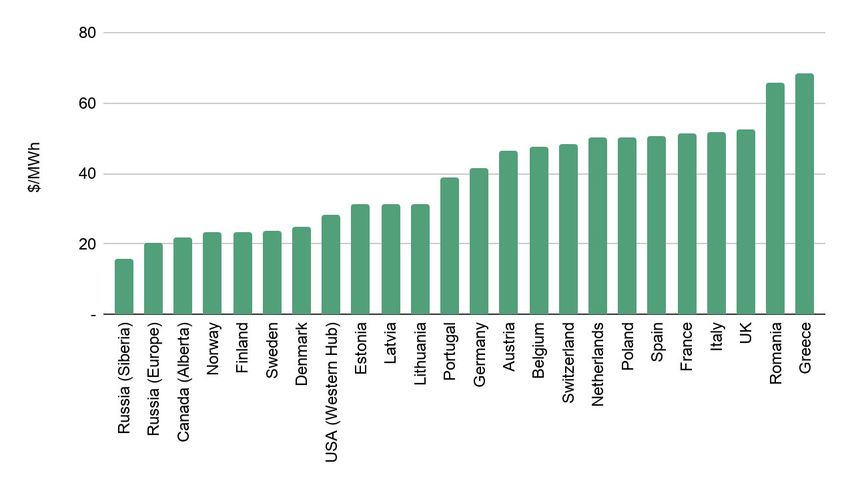
H1 2019 gross mining margin
(Source: Elwood research, company data)
EBIT adjustments and reworked depreciation schedule
However, power is not the only cost for cryptocurrency miners. We have calculated an adjusted EBIT margin which
includes electricity costs, depreciation of mining equipment on a straight-line two year basis, salaries, maintenance
costs and all general administration costs required to operate the business. Below we provide a summary on which
expenses are included in each of the EBIT metrics:
Reported EBIT Adjusted EBIT
Adjusted depreciation and amortisation ✘ ✔
Depreciation and amortisation ✔ ✘
Energy and infrastructure ✔ ✔
General, admin and other ✔ ✔
Impairments ✔ ✘
Maintenance costs ✔ ✔
Marketing ✔ ✔
Revaluation of digital currencies ✔ ✘
Salary and benefits ✔ ✔
Share based payments ✔ ✘
In our analysis, we noticed that companies use different accounting policies to depreciate their mining assets, although
the generally accepted approximate useful life for this type of hardware is two years2. Based on each companies’
capital expenditure history, we have reworked the depreciation schedules of Argo, Hive and Bitfarms in order to
convert their policies to a two-year regime, reflecting the real world hardware lifetime expectations, while also
removing the effects of discretionary accounting policies.
2
Source: CoinShares Research [link]
Your attention is drawn to the section entitled “Important information” at the end of the note. © Elwood Asset Management LLP. All rights reserved Page 10Depreciation schedule by company
Company Depreciation schedule used by company Assumptions made in order to adjust
$18m of hardware bought in H1 2019
Argo Blockchain 3 years on a straight-line basis
period was purchased in May
Asset acquisitions occur at beginning of
Bitfarms Sum of years, declining over 5 years
respective quarter
Asset acquisitions occur at beginning of
Hive Blockchain Technologies 4 years on a straight-line basis
month stated
Hut 8 Mining 2 years on a straight-line basis No assumptions or adjustments needed
(Source: company data)
It is important to note that, when adjusting each company’s depreciation schedule, we had to make assumptions
around the timing of hardware purchases (beginning of period) and that there would be no residual value in the end of
their useful lifetimes.
As the chart below makes clear, the choice of depreciation policy can have a significant impact on depreciation
expenses and, hence, profitability numbers. For some of the companies we analysed, the adjusted charge corresponds
to a nearly 300% increase in the depreciation charge for the H1 2019 period. Although not a cash charge, depreciation
does reflect the level of reinvestment that is required on the business, which looks to be much higher than reported by
some companies, if we take into account an average lifetime for the hardware of two years rather than three or four.
Impact of depreciation adjustments by company (H1 2019)
(Source: Elwood research)
The reworked depreciation charge has a considerable impact on the companies we have analysed, but it is not the only
element we have adjusted to calculate our adjusted EBIT margin. As per the table in the beginning of this section, we
also excluded from the adjusted EBIT any realised or unrealised gains from the revaluation of cryptocurrencies and
impairments of mining equipment, as these do not reflect the true operating strengths of the businesses. By applying
these adjustments, we were able to create the chart below, which shows the adjusted and reported EBIT margins for
each firm during the H1 2019 period. It is worth noting that the reported EBIT margin does include impairments and
revaluation of cryptocurrencies held as inventory.
Your attention is drawn to the section entitled “Important information” at the end of the note. © Elwood Asset Management LLP. All rights reserved Page 11H1 2019 EBIT margins
(Source: Elwood research)
During this period, Hut 8 Mining was the only company which had a positive adjusted EBIT margin, at 16%. However, it
is important to highlight that this adjusted operating income excludes impairments and any revaluation of
cryptocurrencies.
Your attention is drawn to the section entitled “Important information” at the end of the note. © Elwood Asset Management LLP. All rights reserved Page 12COMPANY SECTIONS
Valuation
Cryptocurrency mining farm operations remains a largely private company industry. The four listed entities covered in
this report account for less than 2% of the global Bitcoin hash rate, with the likes of Bitfury, Genesis and Gigawatt
remaining in private hands. The companies that are listed, however, are relatively small, with a combined market value
of $210m.
We have produced a peer group valuation table for the listed miners as per below. At this point, we can only analyse
sales and EBITDA multiples, as in calendar 2018 and over the last twelve months, all companies have been
loss-making on the operating level. We compare the stocks against gold miners, who are most likely the closest peers
to cryptocurrency miners. The sector trades at an average 2.2x trailing twelve months sales, 33% below gold mining
companies, who trade at 3.3x. With a trailing EV/EBITDA of 6.5x, the sector looks even more deeply discounted,
against the gold miners’ 11.2x trailing EV/EBITDA multiple.
Ticker Name Year Price Market cap EV/Sales EV/EBITDA
end ($) ($m) CY18 LTM CY18 LTM
HUT CN Hut 8 Mining Dec 1.21 109 3.4x 2.1x 8.7x 5.2x
BITF CN Bitfarms Dec 0.48 40 1.5x 2.0x 3.1x 7.8x
HIVE CN Hive Blockchain Tech. Mar 0.13 42 1.4x 1.4x 10.1x n.a.
ARB LN Argo Blockchain Dec 0.09 26 17.0x 3.5x n.a. n.a.
Average 5.8x 2.2x 7.3x 6.5x
(Source: Elwood research, Bloomberg)
Note: LTM corresponds to last twelve months, or the October 2018 to September 2019 period, except for Argo Blockchain (used July 2018 to June 2019)
In our view, there could be a few reasons for such a deep discount:
● Loss-making companies: all four listed cryptocurrency miners are currently loss making, which also translates
into poor cash flow generation, with all companies burning cash. For instance, Hive lost around twice its market
capitalisation in 2018.
● Poor capital allocation and write-downs: some of the cryptocurrency miners have started their operations
during the cryptocurrency hype of late 2017, making large investments during the period. As Bitcoin and other
cryptocurrency prices dwindled, the expected returns on their investments have drastically dropped, leading to
hefty writedown charges and reduced profitability.
● Governance issues: conflicts between companies have not provided investors with a friendly and stable
environment to invest in, with the added risk of reduced earnings given the high probability of deals falling
through.
In addition to poor profitability, cryptocurrency miners will have to face the challenge of Bitcoin halving in May 2020,
which adds to investors’ cash generation concerns about these companies, as, with rewards halving, almost all of the
listed names would barely be able to break even at a gross profit level (assuming current prices).
Your attention is drawn to the section entitled “Important information” at the end of the note. © Elwood Asset Management LLP. All rights reserved Page 13Hut 8 Mining
Ticker Company Market Cap Total mining Hash rate H1 2019 Gross H1 2019 adj. operating
($m) capacity (MW) (PH/s) mining margin mining margin
HUT CN Hut 8 Mining 109.4 107 952 43% 16%
Hut 8 is a Bitcoin-only mining company, listed in the Toronto stock exchange. It is the largest Bitcoin mining firm in
North America and the largest publicly listed cryptocurrency miner, with a total of 107 MW of mining power.3 One of the
motivations behind Hut 8 listing as a public company was to provide investors with a method of gaining exposure to the
price of Bitcoin in a regulated manner. Therefore the firm tends to keep the majority of bitcoin that it mines as
inventory.
Corporate history
Hut 8 was founded by Andrew Kiguel and Bill Tai on November 14th, 2017.4 The company has a very close working
relationship with Bitfury, a privately owned blockchain technology infrastructure firm. Bill Tai sits on the boards of both
Bitfury and Hut 8, as does Jeremy Sewell - who is also the CFO of Bitfury. Hut 8’s majority shareholder is Bitfury with a
47% stake and the relationship between the two firms is further outlined in a Master-Service agreement.5 Hut 8 listed
on the Toronto Stock Exchange after a reverse takeover of Oriana Resources Corp.
Hut 8 has exclusive use of Bitfury’s BlockBox cryptocurrency mining devices in North America.6 The BlockBox is a
containerised data center for Bitcoin mining with air-cooled mining services that deliver a reported total hashrate of 14
PH/s per container.7 The chief benefit of this design is the portability of the mining servers so that equipment can be
easily transported to a cheaper electricity location.
Hut 8 operates two mining locations, both in the Canadian province of Alberta. The largest operation is located in
Medicine Hat, with a maximum capacity of 67MW and the second site is in Drumheller with 42.4 MW.
Hut 8 mining locations
(Source: Elwood research, company data)
3
Source: Hut 8 website [link]
4
Source: Hut 8 articles of inception [link]
5
Source: Bloomberg as of 05/11/2019
6
Source: Hut 8 Q4 2018 MD&A
7
Source: Bitfury website [link]
Your attention is drawn to the section entitled “Important information” at the end of the note. © Elwood Asset Management LLP. All rights reserved Page 14Financial Analysis
Hut 8 commenced mining operations on 15th November 2017 and quarterly revenues and net income can be viewed
below:
Hut 8 mining revenue and net income
(Source: company data, Elwood research)
The chart above shows a considerable profit slump in Q4 2018, despite generating similar levels of revenue against the
previous quarter. This is the result of a CAD 84m inventory write-down during the period, shown in the figure below.
Fixed asset investments versus depreciation and writedowns (Nov 2017 - Sep 2019)
(Source: company data, Elwood research)
Hut 8 raised CAD 23.8m and CAD 54.9m from share issues in Q4 2017 and Q1 2018 respectively and drew CAD 20.6m
Your attention is drawn to the section entitled “Important information” at the end of the note. © Elwood Asset Management LLP. All rights reserved Page 15out of a loan from Bitfury. Management claimed that he CAD 84m inventory writedown was due to the “decline in
market value of servers, weakening prices of Bitcoin and volatility in network difficulty levels during the year,”8 but it
corresponds to over 85% of the company’s historical cumulative cash flows and more than half the investment on
PP&E in the period. Hut 8 determined the recoverable amount as the fair value for the Drumheller facility (42.4 MW)
and value in use for the Medicine Hat facility (67 MW) using the following assumptions:
● Bitcoin price = CAD 5,224 ($3,829)
● Network difficulty = 5,619 billion
● Discount rate of mining servers = 25%
Below, we show a summary of Hut 8’s historical financials and mining output:
Hut 8 summary financial metrics
Metric 2017 (Nov 15 - Dec 31) 2018 (to Dec 31) 2019 (to Jun 30)
Number of BTC mined 62 5,592 5,341
Electricity costs ($m) 0.10 29.8 17.3
Gross cost of BTC mined ($) 1,635 3,423 3,246
Adjusted EBIT ($m) 0.12 (21.4) 4.9
Adjusted cost of BTC mined ($) 11,971 22,432 4,775
Reported EBIT ($m) 0.12 (37.9) 21.1
(Source: Elwood research, company data)
As Hut 8 only mines Bitcoin, we can attribute 100% of electricity costs to Bitcoin mining in order to calculate the gross
cost per bitcoin mined. Hut 8’s reporting currency is the Canadian dollar and we have used the period average
exchange rates to convert the figures into US dollars.9
Being the largest of the listed miners, Hut 8 has mined over twice as many bitcoin per quarter than Bitfarms, the second
largest listed player. This has provided the company with enough scale to dilute fixed costs, leading it to report the
highest EBIT margins for the first half of 2019, as well as some of the lowest electricity costs per mined unit in the
industry.
Bitfarms
Ticker Company Market Cap Total mining Hash rate H1 2019 Gross H1 2019 adj. operating
($m) capacity (MW) (PH/s) mining margin mining margin
BITF CN Bitfarms 39.8 64 813 63% (71%)
8
Source: Hut 8 Q4 2018 Financial Statements [link]
9
Source: OFC yearly average rates [link]
Your attention is drawn to the section entitled “Important information” at the end of the note. © Elwood Asset Management LLP. All rights reserved Page 16In January 2018, Israel-listed company Blockchain Mining Ltd acquired Backbone Hosting Solutions Inc., a Canadian
Bitcoin mining company and changed the resulting company name to Bitfarms.10 Later in 2019, Bitfarms moved the
listing to the Toronto Venture Exchange and filed a prospectus with the Ontario Securities Commission.
Today, Bitfarms operates five cryptocurrency mining facilities in Quebec, Canada: a 4MW capacity facility in
Cowansville, 10MW in Farnham, 10MW in Magog, 10MW in Saint-Hyacinthe, and a newly built facility in Sherbrooke,
which has a total capacity of 60MW, of which 30MW of mining power is currently operating.11
Bitfarms Mining Locations
(Source: Elwood research, company data)
The five facilities add up to 64 MW of mining power, which generates 813 PH/s, with a total contracted power portfolio
of 160 MW, should the company wish to expand their operations.12 According to Bitfarm’s website, 100% of their ASIC
hardware is dedicated to mining on the Bitcoin network, however the firm has historically mined other cryptocurrencies
as shown in the chart below.
10
Source: Intrado news [link]
11
Source: Bitfarms website [link]
12
Source: Bitfarms website [link]
Your attention is drawn to the section entitled “Important information” at the end of the note. © Elwood Asset Management LLP. All rights reserved Page 17Fair value of coins mined ($m)
(Source: company data)
In relation to other cryptocurrencies, the proportion of Bitcoin has increased over time and, for the previous two half
years, Bitfarms only mined Bitcoin and Litecoin.
Below, we have estimated the company’s cost of mining Bitcoin. In order to do so we have made several assumptions:
1) Assumed that Bitfarms has the same mining margin for all coins that it has mined (Bitcoin, Bitcoin Cash, Dash,
Litecoin and Ethereum).
2) Assumed that the entirety of ‘energy and infrastructure’ costs correspond to cryptocurrency mining electricity
costs.
3) For 2017, attributed the same value proportion of ‘energy and infrastructure’ spent on Bitcoin mining as the
proportion of the fair value of bitcoin mined in relation to the total cryptocurrency value mined; for 2018 and
2019, Bitcoin ‘energy and infrastructure’ costs have been obtained by multiplying reported Bitcoin break even
cost (gross cost of bitcoin mined) by the number of bitcoin mined
Taking the 2017 period as an example. Bitfarms mined a total of 550 bitcoin, with a fair value of $6,626,000. This
represented 62% of the total value of all the cryptocurrency mined by the company in the period. Therefore we have
attributed 62% of the total ‘energy and infrastructure’ costs of $673,000 to Bitcoin mining, which is $420,569,
resulting in an implied gross Bitcoin mining cost of $765 per unit.
We have used a similar methodology in order to calculate the total Bitcoin operating costs, which includes all operating
costs (energy and infrastructure, adjusted depreciation, general and administrative expenses and impairments).
Bitfarms summary mining metrics
Metric 2017 (from 5th Nov) 2018 2019 (up to 30th June)
Number of BTC mined 550 3,252 1,811
BTC electricity costs ($) 420,569 6,243,840 4,070,912
Gross cost of BTC mined ($) 765 1,920 2,248
Adjusted EBIT ($) 4,413,313 2,881,345 (1,761,184)
Net cost of BTC mined ($) 4,829 12,126 7,307
Your attention is drawn to the section entitled “Important information” at the end of the note. © Elwood Asset Management LLP. All rights reserved Page 18(Source: Elwood research, company data)
This methodology has some drawbacks since it assumes that Bitfarms mine all cryptocurrencies with the same
efficiency, an assumption which may be inaccurate. However, since Bitfarms does not provide a breakdown of costs for
each cryptocurrency mined, this is the closest possible approximation derived from public information.
Below we have overlaid Bitfarm’s gross and net cost of mining Bitcoin with the prevailing market price for the analysed
period. It is possible to conclude that the difference between the gross and net cost of Bitcoin mining increased during
2018, a result of several impairments recorded by Bitfarms throughout the year, which are included in the net cost.
Bitcoin price vs. mining costs
(Source: Bloomberg, Elwood research)
Hive Blockchain Technologies
Ticker Company Market Cap Total mining Hash rate H1 2019 Gross H1 2019 adj. operating
($m) capacity (MW) (PH/s) mining margin mining margin
HIVE CN Hive Blockchain 42.0 24 100 30% (188%)
Hive Blockchain Technologies became the first listed cryptocurrency miner in the world when it listed on the TSX
Venture Exchange in Canada on 15th September 2017. The first mover advantage has drawn significant attention to
Hive’s stock during the cryptocurrency bull run of 2017 and the firm eventually hit a market capitalisation of $2bn on
3rd November 2017.13
Hive was co-founded by Marco Streng (CEO of Genesis Mining) and Olivier Newton and has had a strategic partnership
with Genesis Mining since inception. Genesis is a private company founded in 2013 which provides mining-as-a-service
13
Source: Bloomberg
Your attention is drawn to the section entitled “Important information” at the end of the note. © Elwood Asset Management LLP. All rights reserved Page 19to their clients and has claimed that over 2 million customers have used their cryptocurrency mining services.14 In
September 2017, Hive signed a Master-Service Agreement with Genesis Mining in order to receive cryptocurrency
mining facilities for a fixed monthly fee, covering all the costs associated with the mining operation, such as electricity,
hardware and maintenance costs.15
As laid out in the agreement, there are cryptocurrency mining facilities in Iceland and Sweden in which Hive owns the
mining machines purchased from Genesis, while Genesis hosts and maintains these machines. These specific locations
were chosen because of the cold weather, in order to minimise cooling costs, and for the access to stable and cheap
electricity. The agreement and partnership with Genesis Mining was highly beneficial for Hive as it gained access to
Genesis’s proprietary cryptocurrency mining hardware and software and years of experience in mining
cryptocurrencies on an industrial scale.
Hive Blockchain Mining Locations
(Source: Elwood research, company data)
However, the relationship soured in 2019, when Genesis launched a proxy war in order to take control of Hive.16
Tensions first arose between the two firms in September 2018, when Hive asked Genesis to review the electricity
pricing for the mining facilities in Iceland and Sweden. As stated in the Master-Service Agreement, Hive is entitled to be
charged the same rate as Genesis’ cost of power. After increases to the power charges issued to Hive by Genesis, the
company demanded full disclosure of these costs, which were not provided by Genesis. As a result, Hive demanded
compensation of US$50m from Hive and for the full costs to be disclosed. Genesis had two representatives on Hive’s
board and owned 26% of the company’s stock. In retaliation, it convened a board meeting on April 19, 2019 to remove
Frank Holmes as the interim CEO of Hive, although this effort was unsuccessful. However from April 22, 2019, Genesis
shut down Hive’s mining facility in Sweden which had 20.4 MW of power mining Ethereum.
On June 28, 2019 Hive announced that they had reached a settlement with Genesis which positively resolved these
issues and the mining facility in Sweden had been rebooted17. As part of the settlement, Hive assumed full
responsibility for the management of the mining operations in Sweden and Iceland and later went on to appoint
Blockbase Group as the operator. The settlement also limited Genesis to having only one member on Hive’s board of
directors. During the period when Hive’s facility was shut down in Sweden, the Ethereum price increased by 96% and
Hive could not effectively profit from this.
14
Source: Genesis Mining website [link]
15
Source: SEDAR [link]
16
Source: SEDAR [link]
17
Source: Cision news [link]
Your attention is drawn to the section entitled “Important information” at the end of the note. © Elwood Asset Management LLP. All rights reserved Page 20Furthermore, in May 2018 Hive acquired a 64-hectare mining facility in Norway which would provide the company with
an additional 30 MW of mining capacity for a total cost of $12.3m. However, in December 2018 the Norwegian
Parliament approved a legislative bill determining that cryptocurrency miners would no longer be subject to tax relief
on power consumption at the same rate as other power-intensive industries. As a result, the company is still uncertain
as to whether they will build out the mining infrastructure at this site or not, resulting in land rights being written off.18
The chart below shows Hive’s share price and the aforementioned events.
Hive Blockchain price and material events
(Source: Elwood research, Bloomberg)
Argo Blockchain Plc
Ticker Company Market Cap Total mining Hash rate H1 2019 Gross H1 2019 adj. operating
(US$m) capacity (MW) (PH/s) mining margin mining margin
ARB LN Argo Blockchain 26.1 64 581 51% (6%)
Argo Blockchain is listed on the London Stock Exchange and raised £25m through an IPO on 3rd August 2018 at a
valuation of £46.9m, or 12.5p per share.19 Argo chose London for its credible listing process and regulatory regime and
maintains a registered office in London. The firm and nearly all employees are based in Canada. Initially the firm
operated a mining-as-a-service business model, where customers would be provided capacity in exchange for a
monthly fee. However, the firm pivoted to mining for their own account in Q1 2019.
The company has three facilities in the province of Quebec. The main facility is located in the town of Mirabel, outside
of Montreal, with 5MW of mining capacity. The second facility is devoted to research and development, and is located in
Gatineau. The third facility is in Baie Comeau, north-east Canada, and as of January 2020 has 15MW of mining capacity.
18
Source: Hive Blockchain website [link]
19
Source: Argo Blockchain Prospectus
Your attention is drawn to the section entitled “Important information” at the end of the note. © Elwood Asset Management LLP. All rights reserved Page 21Argo Blockchain Mining Locations
(Source: Elwood research, company data)
Today the firm has a total of 20MW of operating mining power. GPU.one is a private firm which provides Argo with
hosting services, this includes sourcing electricity for Argo and maintaining Argo’s mining machines. As the name
suggests, GPU.one is predominantly focussed on GPU mining machines, however they host both Argo’s ASIC and GPU
mining machines.
Initially, Argo’s business model was to provide Mining-as-a-service for retail investors. This is an arrangement where
Argo owns the mining hardware and investors rent hash power from the firm and earn a share of the mining rewards. At
launch in August 2018, Argo initially focussed on mining four cryptocurrencies for their clients with the price cost
shown below:20
Argo cryptocurrency mining plans
Plan name Small Medium Large
Plan price per month ($) 49 99 599
Bitcoin Gold (BTG) 200 H/s 600 H/s 2,800 H/s
Ethereum (ETH) 20 MH/s 600 MH/s 280 MH/s
Ethereum Classic (ETC) 20 MH/s 60 MH/s 280 MH/s
Zcash (ZEC) 200 H/s 600 H/s 2,800 H/s
(Source: Align Research)
20
Source: Align Research initiation note 06/08/2018
Your attention is drawn to the section entitled “Important information” at the end of the note. © Elwood Asset Management LLP. All rights reserved Page 22All four of these cryptocurrencies can be mined using GPU miners and, at initiation, the company only owned GPU
mining machines. However, these cryptocurrencies, and the wider market, depreciated significantly in value throughout
2018, as shown below21:
Select cryptocurrency price change throughout 2018 (1 Jan 2018 = 100)
(Source : CoinMarketCap)
As a result of this price depreciation, and the additional expenses required to run a mining-as-a-service business, such
as marketing and customer service costs, Argo decided to shut down this service and focus on mining for their own
account.
In Q1 2019 Argo began mining for their own account, using their GPU miners to mine Zcash and converting to fiat daily.
The firm also purchased S17 and T17 ASIC mining machines from Bitmain in order to start mining Bitcoin. The table
below shows how the firm reduced spending cash on building and maintaining their customer-facing website and
increased spending on mining equipment as they began to mine for their own account in Q1 2019.
H1 2018 H2 2018 H1 2019
Additions - website (£) 471,222 200,699 28,335
Additions - computer equipment (£) 442,515 2,365,074 18,056,966
On a recent phone call with management, we were told that Argo sells their cryptocurrency inventory daily and sees
itself as a pure infrastructure company. However, this has not always been the case, as this extract from the firm’s
2018 annual report shows:
“Between 11 October 2018 and 14 November 2018, the Group identified an opportunity to make short
term gains from low prevailing prices on the Crypto currency market, purchasing Bitcoin and Ethereum to
21
Source: CoinMarketCap
Your attention is drawn to the section entitled “Important information” at the end of the note. © Elwood Asset Management LLP. All rights reserved Page 23the value of £329,088. However, due to the continued poor performance of the Crypto currency market,
only losses were realised.” 22
Conclusion
Our analysis shows that Hut 8 Mining is the most capital efficient listed cryptocurrency miner during 2019, as it was the
only profitable company on our adjusted EBIT basis, and the firm with the highest net income over the period. We have
estimated that Hut 8 had a net unit cost of $4,775 to mine 5,341 Bitcoin over this period. Moreover, Hut 8 is also the
largest listed miner, with a hash rate of 952 PH/s.
Cryptocurrency miners return on invested capital (ROIC) analysis (H1 2019, annualised)
(Source: Elwood research, company data)
While there can be considerable returns from investing in mining operations, our analysis suggests that the currently
listed companies are placed too high in the mining cost curve, which could put them in a challenging situation given the
current volatility of the cryptocurrency market. Miners with a lower position on the cost curve are protected from the
volatility, to some extent.
Finally, on valuation terms, while seemingly cheap against major global indices (e.g. S&P 500, MSCI World) on a
EV/Sales and EV/EBITDA basis, capital returns have been poor and free cash flow generation has been mostly negative.
This, combined with the challenging short-term outlook for the industry, could reduce investor appetite for the sector,
which could ultimately undermine valuations, resulting in share price underperformance. However, there are
opportunities in this space and strong companies may be able generate surprisingly sustainable earnings, despite price
volatility. Identifying these stocks will be challenging and investors will require a highly selective approach.
22
Source: Argo Blockchain website [link]
Your attention is drawn to the section entitled “Important information” at the end of the note. © Elwood Asset Management LLP. All rights reserved Page 24Important Information
This document has been provided specifically for the use of the intended recipient only and must be treated as proprietary and confidential. It may not be passed
on, nor reproduced in any form, in whole or in part, under any circumstances without the express prior written consent from Elwood Asset Management LLP
(“Elwood”) or any of its affiliates.
This document is provided for information purposes only and does not constitute an invitation, solicitation or offer to subscribe for or purchase any of the
investments, products or services mentioned herein, nor shall it, or the fact of its distribution or communication, form the basis of, or be relied on in connection with
any contract.
This document is not intended to constitute, nor should it be construed as investment advice. Potential investors in any investments, products or services referred to
in this document or to which this document relates should seek their own independent financial, legal and taxation advice. This document is not intended to provide
a sufficient basis on which to make any investment decision.
The information, data and opinions contained in this document are for background purposes only, are not purported to be full or complete and no reliance should be
placed on them. Elwood believes (but has not necessarily verified) that the sources of the information, data and opinions contained in this document are reliable.
However, Elwood does not give any guarantee, representation, warranty or undertaking, either express or implied, regarding and accepts no liability, responsibility
or duty of care for, the accuracy, validity, timeliness or completeness of any such information, data or opinion or that it is suitable for any particular purpose or use or
it will be free from error. To the extent that any further information, data or material is provided in relation to the investments, products or services referred to
herein, no representation is made that any such further information, data or material will be calculated or produced on the same basis, or in the same format, as
contained in this document. No obligation is undertaken to update any information, data or material contained herein.
Elwood Asset Management Services Limited (FRN 823616), an affiliate of Elwood Asset Management LLP, is an Appointed Representative of MJ Hudson Advisors
Limited (FRN 692447) which is authorised and regulated by The Financial Conduct Authority.
This document contains information that is for discussion purposes only. This document is only being made available to such person as it may be lawfully provided.
The information herein should not be relied or acted on by any other person.
In the United Kingdom, this document is directed only at, and made available only to, professional clients and eligible counterparties. This material is not intended
for use by, or directed at, retail customers.
Any projections or analyses provided to assist the recipient of this document in evaluating the matters described herein may be based on subjective assessments
and assumptions and may use one among alternative methodologies that produce different results. Accordingly, any projections or analyses should not be viewed
as factual and should not be relied upon as an accurate prediction of future results. Hypothetical or simulated performance results have certain inherent limitations.
Unlike an actual performance record, simulated results do not represent actual activity and similar investment opportunities may not be available. Also, since the
investments represented do not represent actual investments, the results may have under- or over-compensated for the impact, if any, of certain market factors,
such as lack of liquidity or market disruptions. Simulated investments in general are also subject to the fact that they are designed with the benefit of hindsight.
Data as of 3 February, 2020 unless otherwise stated. By accepting this document, you consent to communicating with us in English, unless you inform us otherwise.
Any investment decisions must be based only on the most up to date legal offering documents. This document is not marketing material and is not intended as a
recommendation to buy or sell any particular asset class, security or strategy. Regulatory requirements that require impartiality of investment/investment strategy
recommendations are therefore not applicable nor are any prohibitions to trade before publication. This document should not be considered financial advice. Any
calculations and charts set out herein are indicative only, make certain assumptions and no guarantee is given that future performance or results will reflect the
information herein. The Index is calculated and published by Solactive AG.
Your attention is drawn to the section entitled “Important information” at the end of the note. © Elwood Asset Management LLP. All rights reserved Page 25You can also read