CORPORATE PRESENTATION - Yangarra.ca
←
→
Page content transcription
If your browser does not render page correctly, please read the page content below

CORPORATE PRESENTATION
TSX: YGR
                        NOVEMBER 2021
YANGARRA
  “YOU DON’T NEED AN INTRODUCTION TO SUCCEED IN LIFE. YOU NEED TO HAVE GOOD WORK.” – OSCAR DE LA RENTA

 ➢ Strong track record of generating net income throughout volatile commodity cycle
                • 13% Q3 2021 Annualized return on capital employed (“ROCE”)
                • $0.16 EPS for Q3 2021 & $0.35 EPS YTD 2021

 ➢ Highly incentivized and aligned management & Board
                • 18.2% basic ownership, 25.6% fully diluted

 ➢ Geographically concentrated (bioturbated halo Cardium zone near Rocky Mountain House)
                • Multi-year drilling inventory

 ➢ Low-cost producer
                • $6.69 operating costs (including transportation) for Q3 2021
                • 77% operating margin & 66% funds flow margin for Q3 2021

 ➢ Minimizing environmental impact
                • 100+ wells abandoned in the past three years with resulting discounted ARO of $12.7mm & LMR of 6.4
                • Ongoing field-work to reduce C02 equivalent emissions

 ➢ Vertical integration of Yangarra’s in-house services should act as a hedge against inflationary pressures
                • 2022 industry activity will be impacted by scarce equipment & labour disrupting capital programs

yangarra resources ltd.                                                                                              NOVEMBER 2021| PG 2
(Refer to end of presentation for slide notes & advisories)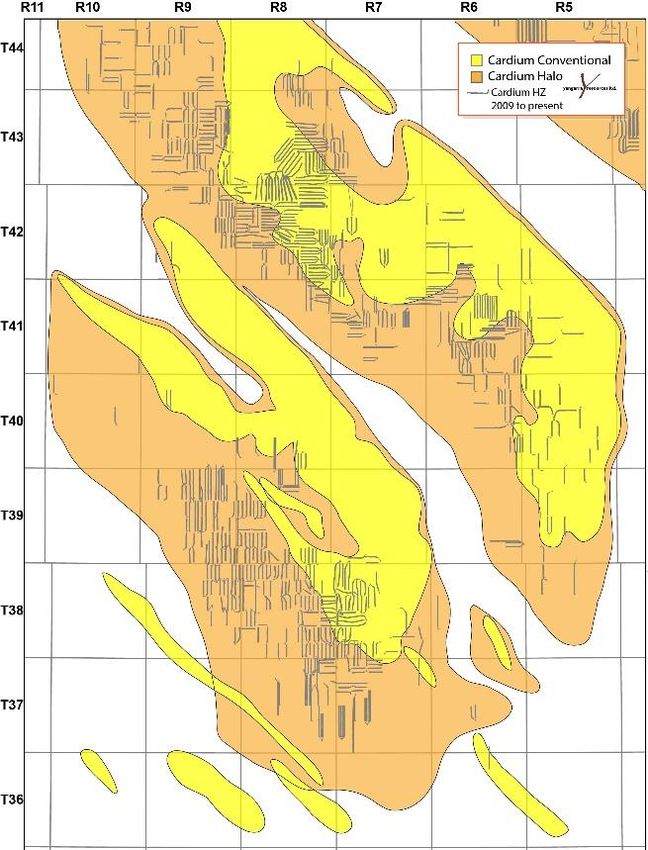
CORPORATE SNAPSHOT
  “SIMPLICITY IS THE ULTIMATE SOPHISTICATION” – LEONARDO DA VINCI

                                         CAPITALIZATION SUMMARY                                                                       Q3 2021 OPERATIONS SUMMARY
                                                                           Additional Information             Q3 2021 Avg.            boe/d   8,710   2021 YTD Avg.              boe/d          8,550
Basic Shares                                mm                  86.2   18.2%     Insider Ownership            Q3 2021 Capital           mm    $23.4   2021 YTD Capital              mm          $61.5
Options                                     mm                   8.6    $0.86    Weighted Average Ex. Price   Q3 2021 FFO               mm    $24.1   2021 YTD FFO                  mm          $58.5
Fully Diluted                               mm                  94.9   25.6%     Total Insider Ownership      Q3 2021 FFO per basic share     $0.28   YTD 2021 FFO per basic share             $0.68
Market Capitalization                       mm                $168.2    $1.95    Share Price at 03/Nov/21
Q3 2021 Net Debt                            mm                $201.8   $210.0    Total Credit Facility        Q3 Net Income (NI)              $13.5   2021 YTD Net Income (NI)                  $30.4
Enterprise Value                            mm                $370.0                                          Q3 NI per basic share           $0.16   2021 YTD NI per basic share              $0.35

 ➢ Simplified capital structure consists of equity & syndicated bank facility (reserve-based lending)
         •       Last equity raise completed in 2016 for $11.5mm
         •       Total capital raised of $177.3mm (including option exercises), retained earnings surplus of $139.1mm
         •       Current facility of $210mm (no borrowing restrictions)
         •       Next renewal for bank facility in November 2021

 ➢ In 2022, at prevailing commodity prices, the Company expects to generate more cashflow than capital
         expenditures on a quarterly basis
         • Yangarra initially expects to target debt reduction with an initial debt target of $150mm and/or a 1.0 D/CF on a
            trailing quarter annualized basis
         • Incremental free cashflow, post debt reduction, is expected to drive return of capital to shareholders

yangarra resources ltd.                                                                                                                                                                  NOVEMBER 2021| PG 3
(Refer to end of presentation for slide notes & advisories)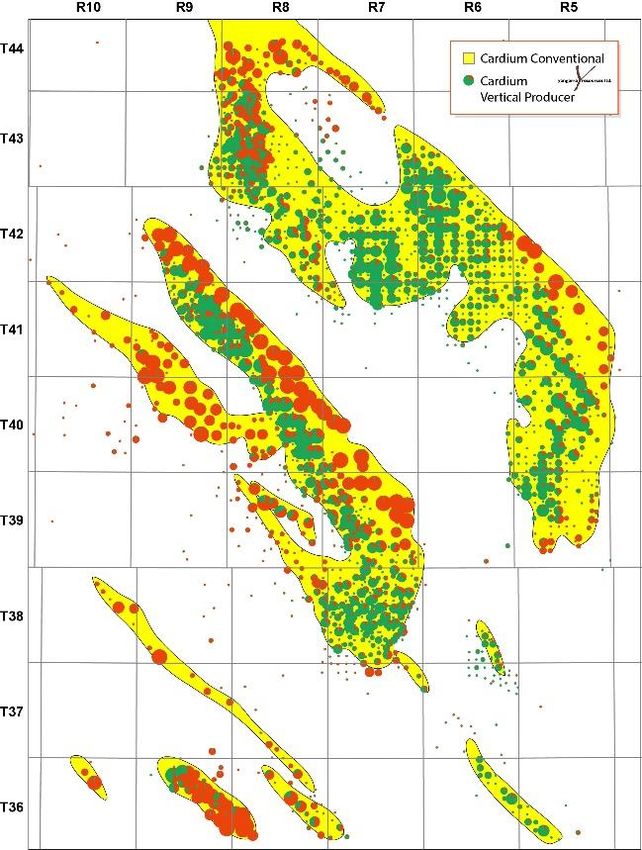
20+ YEARS OF RUNNING ROOM
  “BEAUTY IS IN THE EYE OF THE BEHOLDER” – GREEK PROVERB

                                                              ➢ ~70,400 gross acres (Tier 1)

                                                              ➢ ~38,880 gross acres (Tier 2/3)

                                                              ➢ Tier 2/3 inventory is economic at current
                                                                commodity prices

yangarra resources ltd.                                                                               NOVEMBER 2021| PG 4
(Refer to end of presentation for slide notes & advisories)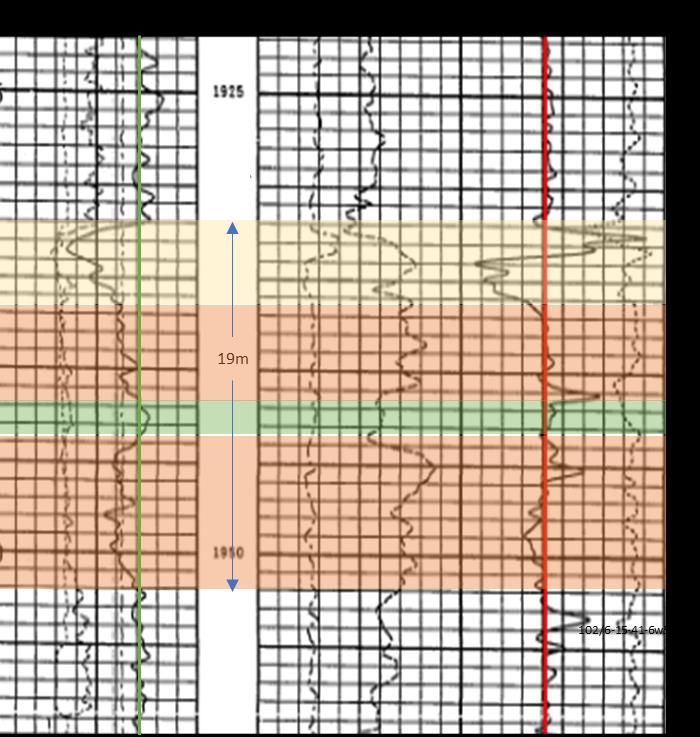
LEADERSHIP
  “A SMOOTH SEA NEVER MADE A SKILLED SAILOR” – FRANKLIN D. ROOSEVELT

                                                  MANAGEMENT TEAM                                                                  BOARD OF DIRECTORS
 Jim Evaskevich*                                              - 30+ years of extensive executive experience      Gordon Bowerman   - President of Cove Resources Ltd.
   President & CEO                                            - Strong field & drilling operational background    Chairman         - 50+ years of oil & gas experience

 Lorne Simpson, B.Sc., C.E.T.*                                - 30+ years of experience in oil & gas             Neil Mackenzie    - Director at various public companies
  VP Operations                                               - Drilling & completions operations                                  - Recent Partner at Blackstone Fluids

 Trish Olynyk*                                                - 20+ years of experience in oil & gas             Robert Weir       - President of Weir Resource Management Ltd.
  VP Finance                                                  - Controller at Yangarra since 2005

                                                                                                                 Ted Morton        - Former Albertan & Canadian politician; Held
 James Glessing, CA*                                          - 20+ years of oil & gas accounting experience      (Audit)          Energy, Finance, Enterprise, and Sustainable
   Chief Financial Officer                                    - Ex-controller & CFO at various energy firms                        Resources Minister positions
                                                              - Articled at Deloitte

                                                                                                                 Penny Payne       - President of Vercatis Consulting Ltd.
 Gurdeep Gill, CFA*                                           - 20+ years of experience in capital markets                         - Former CFO, Yangarra. Previously manager at
  VP Business Development                                     - Head of investment banking at AltaCorp
                                                                                                                                   MNP LLP & PWC
                                                              Capital Inc.

                                                                                                                 Dale Miller       - President of Dark Horse Energy Consultants
 Brett Booth                                                  - 12+ years of experience in oil & gas
                                                                                                                                   - COO of Hillcrest Petroleum
  VP Land                                                     - Significant experience in Central Alberta

 *Management Committee
                                                                                                                 Jim Evaskevich    - See bio in management team.

yangarra resources ltd.                                                                                                                                                     NOVEMBER 2021| PG 5
(Refer to end of presentation for slide notes & advisories)
TRACK RECORD OF GROWTH
“PROGRESS IS IMPOSSIBLE WITHOUT CHANGE, AND THOSE WHO CANNOT CHANGE THEIR MINDS CANNOT CHANGE ANYTHING”
– GEORGE BERNARD SHAW
PRODUCTION PROFILE CAPEX & PER WELL COSTS
14,000 $160 D&C CAPEX $5.0
Facilities CAPEX
12,000 $140
Oil & NGLs (b/d) Gas (boed) 2-Mile Costs
$4.5
$120
10,000
Pre-COVID
$100 well costs
Production (boed)
8,000 $4.0
Per Well (mm)
$80
CAPEX (mm)
6,000
$60 $3.5
4,000
$40
$3.0
2,000 $20 Post-COVID
well costs
- $0 $2.5
2010
2011
2013
2014
2015
2016
2018
2019
2012
2017
Q1 '20
Q2 '20
Q3 '20
Q4 '20
Q1 '21
Q2 '21
Q3' 21
2016 2017 2018 2019 2020
STELLAR HISTORICAL GROWTH PROFILE CAPITAL COSTS MOVING IN THE RIGHT DIRECTION
➢ Growth surge in 2017 attributable to bioturbated ➢ 2020 COVID reset created opportunity to reduce drilling
Cardium success & completions costs
➢ Q3 2021 production growth a turning point on COVID ➢ Future budget contemplates $3.25mm per two-mile well
related declines ➢ Structural vertical integration will insulate future well
➢ Pad drilling creates “bumpy” growth profile, impacted costs from increasing oilfield activity levels
by timing but growth has resumed in Q3 2021
yangarra resources ltd. NOVEMBER 2021| PG 6
(Refer to end of presentation for slide notes & advisories)
FOCUS ON EARNINGS AND LIVING WITHIN CASHFLOW
  “ONE BAD CHAPTER DOESN’T MEAN YOUR STORY IS OVER” - ANONYMOUS

                                                 HISTORICAL EARNINGS                                                                           NETBACKS
              2018 ROCE: 11.6%, 2019 ROCE: 10.0%                                                                       $60                                                        $12
     $160     2020 ROCE: 2.3%, Q3 2021 (Annualized) ROCE: 13.0%                $0.60                                                  Op. Netback/BOE   Rev/BOE   Op. Cost/BOE
     $140                                                                      $0.50                                                                                              $11
                                                                                                                       $50

                                                                                         Rev & Op. Netback (per boe)
     $120
                                                                               $0.40                                                                                              $10

                                                                                                                                                                                        Operating Cost (per boe)
     $100                                                                                                              $40
       $80                                                                     $0.30                                                                                              $9
       $60                                                                     $0.20                                   $30
                                                                                                                                                                                  $8
       $40                                                                     $0.10                                   $20
       $20                                                                                                                                                                        $7
                                                                               $0.00
        $0                                                                                                             $10
                                                                               -$0.10                                                                                             $6
      -$20
      -$40                                                                     -$0.20                                   $0                                                        $5
                 2010 2011 2012 2013 2014 2015 2016 2017 2018 2019 2020 2021                                                 '10 '11 '12 '13 '14 '15 '16 '17 '18 '19 '20 '21
                                                                        YTD
                                 Retained Earnings (Deficit) EPS                                                                                                         YTD

   HOW CAN AN OIL & GAS COMPANY ACTUALLY MAKE                                           IMPROVING NETBACKS DRIVE CASHFLOWS
   MONEY???                                                                             ➢ YTD improvement in commodity prices have driven
   ➢ Operating cost structure                                                             netbacks; Q4 2021 strip pricing suggests higher netbacks
   ➢ D&C costs                                                                            to come
   ➢ Organic growth                                                                     ➢ Relatively fixed operating cost structure results in
                                                                                          majority of commodity price improvement falling to the
   ➢ Acquire land at compelling values
                                                                                          bottom line, driving cashflow & net income
   ➢ Did we say costs?

yangarra resources ltd.                                                                                                                                               NOVEMBER 2021| PG 7
(Refer to end of presentation for slide notes & advisories)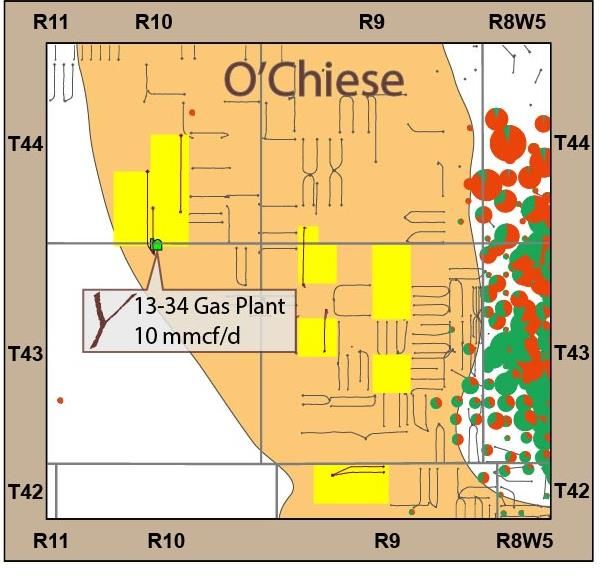
FIVE-YEAR POTENTIAL
  “SIMPLE CAN BE HARDER THAN COMPLEX” – STEVE JOBS

                         FLAT PRODUCTION (~10,000 BOE/D) VS. INTERNALLY FINANCED GROWTH SCENARIO

                                            Full Development Annual FCF
       $600                                                                                                                   Base Assumptions
                                            ~10,000 BOED Annual FCF
                                            ~10,000 BOED Annual CF
                                                                                                                              Commodity Price:
                                            Full Development Annual CF
                                                                                                                              US$80WTI, US$5.00 Diff, 1.20 F/X
                                            ~10,000 BOED Cum. FCF
       $500                                                                                                                   C$90 Ed. Par, C$4/gj AECO
                                            Full Development Cum. FCF
                                            Full Development CAPEX
                                                                                                                              Type Curves:
                                                                                                                              See page 9
       $400
                                                                                                                              Flat Scenario:
                                                                                                                              Production flat at ~ 10,000 boe/d
                                                                                                                              ~$45MM capex for year 1 and 13
 $MM

       $300                                                                                                                   wells thereafter (13 wells/yr)

                                                                                                                              Full Development:
                                                                                                                              Assumes 30 gross (27 net) wells in
       $200                                                                                                                   2022, 30 wells per year thereafter

                                                                                                                              Other:
                                                                                                                              $6.50/boe operating (incl. transp)
       $100                                                                                                                   $1.00/boe G&A
                                                                                                                              Interest flat at $2.15/boe

                                                                                                                              Declines:
          $0                                                                                                                  Base oil decline year 1: 55%
                                  2022                        2023        2024               2025                      2026   Base oil decline thereafter: 40%
                                                                                                                              Base nat. gas decline year 1: 30%
            Cash flow estimates are based on an internal estimate of production assuming full utilization of one-rig          Base nat. gas decline after: 27.5%
            (~30 wells/year) under the full development scenario & using 80% of the disclosed type curve.                     Imputed 1st year decline: 37%

yangarra resources ltd.                                                                                                                           NOVEMBER 2021| PG 8
(Refer to end of presentation for slide notes & advisories)
CURRENT UNRISKED DEVELOPMENT TYPE CURVE
  THE GOOD, THE BAD & THE UGLY: THE AVERAGE OF EVERY WELL IN PROPOSED BUDGET

                                              TYPE CURVE FOR PROPOSED DRILL PROGRAM (AVERAGE OF ALL 1.5/2.0-MILE WELLS IN TIER 1 AREAS)

                                    600                                                                                                Unrisked     Risked
                                                                                    Lower DC&T 2.0 Mile Costs                 $mm           3.25        3.25

                                    500                                             IP90 (56% Oil)                            boe/d          446      367
                                                                                    IP365 (43% Oil)                           boe/d          353      292
                                                                                    1st Year Capital Efficiency             $/boe/d        9,207   11,100

                                    400                                             Base Economics @ US$80 WTI, C$4/gj AECO, US$5 diff, 1.20 F/X
       Production Per Day (boe/d)

                                                                                     IRR                                              474%       229%
                                                                                     NPV10%                                  $mm         8.7       6.4
                                                                                     Payback                               months          5         8
                                    300
                                                                                     Discounted P/I                             x        2.7       2.0

                                    200

                                    100

                                      0
                                          1          7        13          19        25          31           37        43             49           55
                                              Total Boe/d            Oil (bbls/d)                      Months

yangarra resources ltd.                                                                                                                                        NOVEMBER 2021| PG 9
(Refer to end of presentation for slide notes & advisories)
CARDIUM EVOLUTION
  ITS AN OLD SAYING BUT IT WORKS: “ THE BEST PLACE TO FIND OIL & GAS IS WHERE THERE IS ALREADY OIL & GAS”

                  CONVENTIONAL CARDIUM                                                        HALO CARDIUM                      CARDIUM RELATIVE TO NORTH AMERICA
                                                                                                                                     North American Oil and Natural Gas Plays
                                                                                                                                            Half-Cycle Payout Period
                                                                                                                                       Clearwater Marten Hills/Nipisi
                                                                                                                                          Mississippian Conventional
                                                                                                                                             Montney Dawson Lower
                                                                                                                                                                                 Oil Plays Median of 2.0 Years
                                                                                                                                                      Montney Gundy              Natural Gas Median of 2.3 Years
                                                                                                                                 Delaware Wolfcamp A (Top Quartile)
                                                                                                                                                      Montney Kakwa
                                                                                                                               N. Midland Wolfcamp A (Top Quartile)
                                                                                                                                  Eagle Ford Oil - East (Top Quartile)
                                                                                                                                                         Montney Karr
                                                                                                                                             Montney Inga/Fireweed                   YGR Type Curve:

                                                              TECHNOLOGICAL SHIFT
                                                                                                                                                   Montney Pipestone
                                                                                                                      North Dakota Bakken/Three Forks (Top Quartile)                 8 months on below
                                                                                                                                           Viking Hz. Dodsland ERH                   assumptions
                                                                                                                                                         Charlie Lake
                                                                                                                                                     Montney Nig/Beg
                                                                                                                                                   Cardium Oil Ferrier
                                                                                                                                                       Shaunavon Hz.
                                                                                                                                           Montney Elmworth/Wapiti
                                                                                                                                              Bakken Hz. (
CARDIUM REVOLUTION
“SOME PEOPLE SAY THAT LESS IS MORE. BUT I THINK MORE IS MORE” – DOLLY PARTON
ORIGINAL LOG & BIOTURBATED CORE NEW FRAC PLANE
Willesden Green T41-R6W/5
Net Pay
Old Well Path Upper
2.5-4.0m
TECHNOLOGY PROGRESSION
Upper Sand
Core analysis
Porosity 10-15% ➢ Yangarra approach:
Bioturb.
• Cemented liners 3.0-7.0m
• Sliding sleeves New Well Path
• Extended reach wells Lower
1.5-3.0m
➢ Frack into bioturbated
zone to access ➢ Deeper well path allows YGR to access
bioturbated zone & significantly more OBOEIP
Bioturbated upper Cardium ➢ Gas-charge drives higher oil and NGLs
Log Porosity 3% recoveries (see type curve)
IT’S ALL ABOUT OOIP/OBOEIP
UPPER CARDIUM OOIP TARGET/SECTION
YGR BIOTURBATED VIEW ~2-5 mmbbl OOIP
~6-20 mmboe OBOEIP
Actual core analysis (by YGR &
PLUS BIOTURBATED TARGET/SECTION
Weatherford) shows porosity
~4.5-6 mmbbl OOIP
increases to 4-6%
~12-18 mmboe OBOEIP
Materially increasing OOIP/OBOEIP TOTAL TARGET
target estimates ~7.5-10 mmbbl OOIP
~18-38 mmboe OBOEIP
yangarra resources ltd. NOVEMBER 2021| PG 11
(Refer to end of presentation for slide notes & advisories)OWNED & OPERATED INFRASTRUCTURE LOWERS COSTS
A PICTURE IS WORTH A THOUSAND WORDS, SO HERE IS YANGARRA’S PH.D. THESIS
$10.00
Added seven emulsion Completion of gas Results:
hauling trucks handling & process ~108 mmcf/d gas-handling
Central oil treating facilities Fleet of emulsion hauling
$9.00
battery Wireline trucks Construction division
Pressure truck
Operating Cost per BOE
$8.00
2015-2016 2017 2018 2019 2020 2021+
$7.00
10 emulsion hauling Pressure trucks Cat hoe & grader
trucks Gas handling & Combo trucks
Central oil treating processing facility build- Packer
battery out Bed trucks
$6.00
Crew trucks Winch trucks
Picker trucks Gravel trucks
Skid steers Sawdust hauler
Picker truck Recent example:
$5.00
Eight flat deck trailers Recent pad cost of ~$65k vs.
third-party at ~$250k
yangarra resources ltd. NOVEMBER 2021| PG 12
(Refer to end of presentation for slide notes & advisories)ENVIRONMENT SOCIAL GOVERNANCE STRATEGY
“A PACK OF LEMMINGS LOOKS LIKE A GROUP OF RUGGED INDIVIDUALISTS COMPARED WITH WALL STREET WHEN IT GETS A CONCEPT
IN ITS TEETH” - WARREN BUFFET
Yangarra is a leader on good environmental practices: Yangarra takes an unbiased approach to people & relationships
- Industry leading LMR of 6.4, discounted ARO of $12.7mm - Focus on skills & training leading to output
- Drilled 300+ wells, 100+ wells have been abandoned - Diverse opinions matter, management committee comprised of
- Operating structure mitigates risk of emulsion pipeline spills diverse backgrounds
Completed 2020 methane emissions review, future targets: - Culture of strong work ethic lead by senior management
- Reduce pneumatic venting by ~45%
- Reduce venting by ~22%
ENVIRONMENT SOCIAL
E HAS TO BE MORE THAN S HAS TO BE MORE THAN
EMISSIONS SOCIAL JUSTICE
ESG STRATEGY
GOVERNANCE
MITIGATE RISKS
Yangarra believes good governance is more than just “conforming” Yangarra will continue to work on ESG strategy that is right for
board committees: Yangarra stakeholders
- Outcomes matter: high insider ownership focused on creating - Emissions reductions to be driven by future investment
real, long-term shareholder value through net income - Boards take time to change but the oracle of Omaha says it best:
- Return on capital employed emphasized over return of capital “board members be owner-oriented, business-savvy, interested
- Corporate governance matters for Yangarra but the double and truly independent” (i.e. not professional board members)
standard between the public & private sectors continues: “one - Recent nominees to address diversity, while addressing Yangarra
thing Canadians won’t stand for is good government, at any requirements
level.” – Ted Connor
ESG GUIDELINES MATTER BUT YANGARRA OPERATES IN ONE OF THE MOST STRINGENT REGULATORY ENVIRONMENTS IN THE WORLD
yangarra resources ltd. NOVEMBER 2021| PG 13
(Refer to end of presentation for slide notes & advisories)CONCLUSION
“FINALLY, IN CONCLUSION, LET ME SAY JUST THIS” – PETER SELLERS
➢ In the past five years, Yangarra has almost exclusively focused on the bioturbated Cardium
20+ years
of inventory
➢ The expertise built-up in de-risking this play is now set to focus on developing it
➢ Discipline will be key for Yangarra, on costs and on maintaining capital discipline Current price: $1.95
➢ The Company can easily revert to a “pay-down” debt model but the returns from
improving well returns justifies a one-rig program for Yangarra
YTD 2021 CFPS: $0.68
➢ A one-rig program results in material growth for 2022, leveraging off infrastructure build-
out in previous years
PDP+PNP NAV: $3.08
➢ Full-cycle rates of return will continue to drive capital allocation
➢ We are not a renewable company at this point, but we can responsibly develop the Proved NAV: $10.66
Cardium in a safe & environmentally friendly manner without sacrificing returns
384 gross
locations booked
FULLY-FUNDED INVESTMENT VEHICLE TRADING AT COMPELLING VALUATION METRICS
yangarra resources ltd. NOVEMBER 2021| PG 14
(Refer to end of presentation for slide notes & advisories)APPENDIX
RISK MANAGEMENT, ANALYST COVERAGE, PRESENTATION FOOTNOTES & FORWARD LOOKING STATEMENTS
yangarra resources ltd. NOVEMBER 2021| PG 15
(Refer to end of presentation for slide notes & advisories)ANALYST COVERAGE BROADLY COVERED BY THE STREET Acumen Capital Finance Partners Ltd. Cormark Securities Inc. Peters & Co Trevor Reynolds Garett Ursu, CFA Dan Grager treynolds@acumencapital.com gursu@cormark.com dgrager@petersco.com (403) 410-6842 (403) 750-7221 (403) 261-2215 ATB Capital Markets National Bank Financial Raymond James Ltd. Patrick O’Rourke Dan Payne Jeremy McCrea, CFA porourke@atb.com dan.payne@nbc.ca jeremy.mccrea@raymondjames.ca (403) 539-8615 (403) 290-5441 (403) 509-0518 Canaccord Genuity Paradigm Capital Inc. Anthony Petrucci Adam Gill apetrucci@canaccordgenuity.com agill@paradigmcap.com (403) 691-7807 (403) 513-1043 yangarra resources ltd. NOVEMBER 2021| PG 16 (Refer to end of presentation for slide notes & advisories)
PRESENTATION FOOTNOTES
  NOVEMBER 2021

         ➢ Slide 3: For FFO see definition on slide 18
         ➢ Slide 4: Tier 1 includes acreage in Chedderville, Cow Lake, West Ferrier and East Willesden Green. Years of inventory calculated using (well
               density times # of sections less drilled wells), adjusted for well length and than divided by 24
         ➢     Slide 6: CF equals FFO, difference between D&C capex & total capex is land & facilities capital
         ➢     Slide 7: ROCE: Trailing 12-month EBIT divided by (Total Assets less Current Liabilities) for trailing years, annualized for Q3 2021;
         ➢     Slide 8: Assumptions as laid out. Drilling per year for 2022-2025 is assumed to be spread throughout the year, accounting for breakup. 2021
               drilling based on current proposed program. Financial model uses type curve provided on page 9.
         ➢     Slide 9: Type curve provided is the proposed drilling program weighted average of the two-mile & 1.5-mile type curves from Chedderville, Cow
               Lake, West Ferrier and East Willesden Green. Each specific area type curve is the average of all two-mile & 1.5-mile wells in each area.
         ➢     Slide 10 & 16: NAV = NPV10 Reserve Value less adjusted Net Debt and excludes undeveloped land value, effective as at December 31, 2020
               based on the reserve report prepared by Deloitte LLP, independent petroleum engineers (the “Reserves Report”)
         ➢     Slide 11: Per share calculation based on basic shares outstanding
         ➢     Slide 12: Payout chart as provided by Peters & Co. Limited (“Peters”); Chedder & Cow Lake payouts calculated using Peters assumptions
         ➢     Slides 13 & 14: OOIP & OBOEIP data are provided to illustrate how the Company targets land acquisition and drilling opportunities and are not
               actual amounts calculated by the Company. However, the OOIP & OBOEIP estimates are prepared by a Qualified Reserves Evaluator employed
               internally by the Company and follows good engineering practices as outlined in the COGE Handbook. Reservoir parameters are assumed for
               sections without production to calculate “in-place” estimates; where well(s) are drilled in a section, reservoir parameters are determined and
               used to calculate “in-place” values. OOIP estimates are provided in conjunction with OBOEIP estimates whereby OBOEIP equals OOIP plus gas in
               place and liquids is calculated using 55 bbls/mmcf. OOIP & OBOEIP estimates are a combination of discovered and undiscovered quantities and
               are highly dependent upon if there are existing wells in specific sections.

         Additional Information/Terminology:
         ➢ Gas converted at 6 mcf : 1 barrel of equivalent basis (BOE)
         ➢ OOIP: original oil in place; OBOEIP: original barrels of equivalent in place

yangarra resources ltd.                                                                                                                          NOVEMBER 2021| PG 17
(Refer to end of presentation for slide notes & advisories)
PRESENTATION FOOTNOTES
NOVEMBER 2021
Non–IFRS and Additional IFRS Measures
This document contains “funds flow from (used in) operations”, which is an additional IFRS measure. The Company uses funds flow generated from (used in)
operations as a key measure to demonstrate the Company’s ability to generate funds to repay debt and fund future capital investment. This document also
contains the terms “net debt or adjusted working capital (deficit)” and “netbacks”, which are non-IFRS financial measures. The Company uses these measures to
help evaluate its performance. These non-IFRS financial measures do not have any standardized meaning prescribed by IFRS and therefore may not be
comparable to similar measures presented by other issuers.
Funds flow from operations
Yangarra’s determination of funds flow from operations and funds flow from operations per share may not be comparable to that reported by other companies.
Management uses funds flow from operations to analyze operating performance and leverage and considers funds flow from operations to be a key measure as it
demonstrates the Company’s ability to generate cash necessary to fund future capital investments and to repay debt, if applicable. Funds flow from operations is
calculated using cash from operating activities before changes in non-cash working capital and decommissioning costs incurred. Yangarra presents funds flow
from operations per share whereby per share amounts are calculated using weighted average shares outstanding consistent with the calculation of income per
share.
Netbacks
The Company considers corporate netbacks to be a key measure as they demonstrate Yangarra’s profitability relative to current commodity prices. Corporate
netbacks are comprised of operating, field operating, funds flow from operations and net income / (loss) netbacks. Operating netback is calculated as the average
sales price of its commodities (including realized gains on financial instruments) and then subtracts royalties, operating costs and transportation expenses. Field
operating netback subtracts the realized gains on financial instruments, Funds flow from operations netback starts with the operating netback and further
deducts general and administrative costs, finance expense and adds finance income. To calculate the net income (loss) netback, Yangarra takes the funds flow
netback and deducts share-based compensation expense as well as depletion and depreciation charges, accretion expense, unrealized gains on financial
instruments, any impairment or exploration and evaluation expense and deferred income taxes. There is no IFRS measure that is reasonably comparable to
netbacks.
Funds flow from operations margins and Operating margins
Are calculated as the ratio of Funds flow from operations netbacks to sales price and operating netback to sales price.
Adjusted Net debt
Adjusted net debt, which represent current assets less current liabilities, excluding current derivative financial instruments, are used to assess efficiency, liquidity
and the general financial strength of the Company. There is no IFRS measure that is reasonably comparable to net debt or adjusted working capital (deficit).
Adjusted earnings before interest, taxes, depletion & depreciation, amortization
Adjusted earnings before interest, taxes, depletion & depreciation, amortization (“Adjusted EBITDA”) which represents EBITDA, excluding changes in derivative
financial instruments are used to assess efficiency, liquidity and the general financial strength of the Company.
Working Capital deficit (surplus)
Working capital deficit (surplus) is the total of current assets less the total of current liabilities and is used to assess efficiency, liquidity and the general financial
strength of the Company
Reconciliations for the above Non–IFRS and Additional IFRS Measures are presented in the Company’s latest MD&A
yangarra resources ltd. NOVEMBER 2021| PG 18
(Refer to end of presentation for slide notes & advisories)FORWARD LOOKING STATEMENTS
This presentation contains a summary of management's assessment of results and should be read in conjunction with the Consolidated Financial Statements and
related Management's Discussion and Analysis for the year ended December 31, 2020, as filed on the SEDAR profile of Yangarra Resources Ltd. (the "Company").
This presentation contains certain forward-looking statements, which include assumptions with respect to (i) drilling success; (ii) commodity prices; (iii)
production; (iv) reserves; (v) future capital expenditures; (vi) future operating costs; (vii) cash flow; and (viii) potential markets for the Company's production. The
reader is cautioned that assumptions used in the preparation of such information may prove to be incorrect.
Certain information regarding the Company set forth in this presentation, including statements regarding management's assessment of the Company's future
plans and operations, the planning and development of certain prospects, the 2021 Capital Program and the Company's proposed exploration and development
activities and the timing thereof, including the amount and allocation of capital expenditures, the number and types of wells to be drilled and brought on
production and the timing thereof, estimates of total and net capital expenditures, and the focus of, the objectives of and the anticipated results from the 2021
Capital Program, production estimates, reserve estimates, productive capacity and economics of new wells, undeveloped land holdings and values, capital
expenditures and the timing and allocation thereof (including the number, location and costs of planned wells), the total future capital required to bring
undeveloped proved and probable reserves onto production, and expected production growth, may constitute forward-looking statements under applicable
securities laws and necessarily involve substantial known and unknown risks and uncertainties. With respect to the Company’s 2021 production guidance, the key
assumptions are that: the 2021 Capital Program will be carried out as currently contemplated; no unexpected outages occur in the infrastructure that the
Company relies on to produce its wells and that any transportation service curtailments or unplanned outages that occur will be short in duration or otherwise
insignificant; existing wells continue to meet production expectations; and future wells scheduled to come on production meet timing, production and capital
expenditure expectations. These forward-looking statements are subject to numerous risks and uncertainties, certain of which are beyond the Company's control,
including without limitation, risks associated with oil and gas exploration, development, exploitation, production, marketing and transportation, loss of markets,
failure of foreign markets to become accessible, the impact of general economic conditions, industry conditions, volatility of commodity prices, currency
fluctuations, environmental risks, competition, the lack of availability of qualified personnel or management, inability to obtain drilling rigs or other services,
capital expenditure costs, including drilling, completion and facility costs, unexpected decline rates in wells, wells not performing as expected, stock market
volatility, delays resulting from or inability to obtain required regulatory approvals and ability to access sufficient capital from internal and external sources, the
impact of general economic conditions in Canada, the United States and overseas, industry conditions, changes in laws and regulations (including the adoption of
new environmental laws and regulations) and changes in how they are interpreted and enforced, increased competition, fluctuations in foreign exchange or
interest rates and market valuations of companies with respect to announced transactions and the final valuations thereof. Readers are cautioned that the
foregoing list of factors is not exhaustive. The Company's actual results, performance or achievement could differ materially from those expressed in, or implied
by, these forward-looking statements and, accordingly, no assurance can be given that any of the events anticipated by the forward-looking statements will
transpire or occur, or if any of them do so, what benefits the Company will derive therefrom. All subsequent forward-looking statements, whether written or oral,
attributable to the Company or persons acting on its behalf are expressly qualified in their entirety by these cautionary statements. Additional information on
these and other factors that could affect the Company's operations and financial results are included in reports on file with Canadian securities regulatory
authorities and may be accessed through the SEDAR website (www.sedar.com) or the Company's website (www.yangarra.ca), including the Company's MD&A for
the year ended December 31, 2020.
yangarra resources ltd. NOVEMBER 2021| PG 19
(Refer to end of presentation for slide notes & advisories)FORWARD LOOKING STATEMENTS
(CONT.)
The forward-looking statements contained in this presentation are made as of the date on the front page and the Company assumes no obligation to update
publicly or to revise any of the included forward-looking statements, whether as a result of new information, future events or otherwise, except as may be
required by applicable securities laws. Certain information contained herein is based on, or derived from, information provided by independent third-party
sources. The Company believes that such information is accurate and that the sources from which it has been obtained are reliable. The Company cannot
guarantee the accuracy of such information, however, and has not independently verified the assumptions on which such information is based. The Company
does not assume any responsibility for the accuracy or completeness of such information.
This presentation also contains future-oriented financial information and financial outlook information (collectively, "FOFI") about prospective results of
operations, cash flow, capital expenditures, net debt and components thereof, all of which are subject to the same assumptions, risk factors, limitations, and
qualifications as set forth in the above paragraphs. FOFI contained in this presentation was made as of the date of this presentation and was provided for the
purpose of providing information about management's current expectations and plans relating to the future, including with respect to the Company's ability to
fund its expenditures. The Company disclaims any intention or obligation to update or revise any forward-looking statements or FOFI contained in this
presentation, whether as a result of new information, future events or otherwise, unless required pursuant to applicable securities law. Readers are cautioned
that the forward-looking statements and FOFI contained in this presentation should not be used for purposes other than for which it is disclosed herein. The
forward-looking statements and FOFI contained in this presentation are expressly qualified by this cautionary statement.
yangarra resources ltd. NOVEMBER 2021| PG 20
(Refer to end of presentation for slide notes & advisories)FORWARD LOOKING STATEMENTS
NON-GAAP MEASURES & ANALOGOUS INFORMATION
This presentation contains references to measures used in the oil and natural gas industry such as “netback”, “net debt” and “cash flow”. These measures do not
have standardized meanings prescribed by International Financial Reporting Standards (“IFRS”) and therefore should not be considered in isolation. These
reported amounts and their underlying calculations are not necessarily comparable or calculated in an identical manner to a similarly titled measure of other
companies where similar terminology is used. Where these measures are used they should be given careful consideration by the reader. These measures have
been described and presented in this presentation in order to provide shareholders and potential investors with additional information regarding the Company's
liquidity and its ability to generate funds to finance its operations. Netback denotes petroleum and natural gas revenue and realized gains or losses on financial
instruments less royalty expenses, operating expenses and transportation and marketing expenses calculated on a per boe basis. Cash flow should not be
considered an alternative to, or more meaningful than, cash provided by operating, investing and financing activities or net earnings as determined in accordance
with IFRS, as an indicator of the Company's performance or liquidity. Cash flow is used by the Company to evaluate operating results and the Company's ability to
generate cash flow to fund capital expenditures and repay debt. Included in this presentation are estimates of the Company’s 2021 cash flow which are based on
various assumptions as to production levels, commodity prices and other assumptions, are provided for illustration only and are based on budgets and forecasts
that have not been finalized and are subject to a variety of contingencies including prior years' results. To the extent such estimates constitute a financial outlook,
they were approved by management of the Company and are included to provide readers with an understanding of the Company's anticipated cash flow based
on the capital expenditures and other assumptions described and readers are cautioned that the information may not be appropriate for other purposes. The
Company uses net debt as a measure to assess its financial position. Net debt includes current liabilities (including the Company's credit facility and excluding the
current portion of decommissioning obligations) less current assets (excluding property, plant and equipment, held for sale and risk management contracts).
Certain information provided in this news release may constitute "analogous information" under applicable securities legislation, such as reserve and resource
estimates or the reserves and resources present on the Company's lands, and nearby lands, total production and production-rates from wells drilled by the
Company or other industry participants located in geographical proximity to lands held by the Company. This information is derived from publicly available
information sources (as at the date of this news release) that the Company believes are predominantly independent in nature. The Company believes this
information is relevant as it helps to define the reservoir characteristics in which the Company may have an interest. The Company is unable to confirm that the
analogous information was prepared by a qualified reserves evaluator or auditor or in accordance with the Canadian Oil and Gas Evaluation Handbook and
therefore, the reader is cautioned that the data relied upon by the Company may be in error, may not be analogous to the Company's land holdings and/or may
not be representative of actual results of wells anticipated to be drilled or completed by the Company in the future.
yangarra resources ltd. NOVEMBER 2021| PG 21
(Refer to end of presentation for slide notes & advisories)FORWARD LOOKING STATEMENTS
RESERVE DEFINITIONS
Natural gas has been converted to a barrel of oil equivalent (Boe) using 6,000 cubic feet (6 Mcf) of natural gas equal to one barrel of oil (6:1), unless otherwise
stated. The Boe conversion ratio of 6 Mcf to 1 Bbl is based on an energy equivalency conversion method and does not represent a value equivalency; therefore
Boe's may be misleading if used in isolation. References to natural gas liquids ("NGLs") in this presentation include condensate, propane, butane and ethane and
one barrel of NGLs is considered to be equivalent to one barrel of crude oil equivalent (Boe). One ("BCF") equals one billion cubic feet of natural gas. One
("Mmcf") equals one million cubic feet of natural gas.
Reserve Definitions:
"Proved" reserves are those reserves that can be estimated with a high degree of certainty to be recoverable. It is likely that the actual remaining quantities
recovered will exceed the estimated proved reserves.
"Probable" reserves are those additional reserves that are less certain to be recovered than proved reserves. It is equally likely that the actual remaining
quantities recovered will be greater or less than the sum of the estimated proved plus probable reserves.
"Developed" reserves are those reserves that are expected to be recovered from existing wells and installed facilities or, if facilities have not been installed, that
would involve a low expenditure (e.g. when compared to the cost of drilling a well) to put the reserves on production.
"Developed Producing" reserves are those reserves that are expected to be recovered from completion intervals open at the time of the estimate. These
reserves may be currently producing or, if shut-in, they must have previously been on production, and the date of resumption of production must be known with
reasonable certainty.
"Developed Non-Producing" reserves are those reserves that either have not been on production, or have previously been on production, but are shut-in, and
the date of resumption of production is unknown.
"Undeveloped" reserves are those reserves expected to be recovered from known accumulations where a significant expenditure (for example, when compared
to the cost of drilling a well) is required to render them capable of production. They must fully meet the requirements of the reserves classification (proved,
probable, possible) to which they are assigned.
The Net Present Value (NPV) is based on Deloitte AJM Forecast Pricing and costs. The estimated NPV does not necessarily represent the fair market value of our
reserves. There is no assurance that forecast prices and costs assumed in the Deloitte AJM evaluations will be attained, and variances could be material.
This presentation contains references to measures used in the oil and natural gas industry such as “netback”. These measures do not have standardized meanings
prescribed by GAAP and therefore should not be considered in isolation. These reported amounts and their underlying calculations are not necessarily
comparable or calculated in an identical manner to a similarly titled measure of other companies where similar terminology is used. Where these measures are
used they should be given careful consideration by the reader. These measures have been described and presented in this presentation in order to provide
shareholders and potential investors with additional information regarding the Corporation's liquidity and its ability to generate funds to finance its operations.
Netback denotes petroleum and natural gas revenue and realized gains or losses on financial instruments less royalty expenses, operating expenses and
transportation and marketing expenses calculated on a per boe basis.
yangarra resources ltd. NOVEMBER 2021| PG 22
(Refer to end of presentation for slide notes & advisories)You can also read