AUGUST 2019 - Vista Oil & Gas
←
→
Page content transcription
If your browser does not render page correctly, please read the page content below
I N V E S TO R
P R E S E N TAT I O N

                        AUGUST 2019
Disclaimer

Confidentiality and Disclosures
Additional information about Vista Oil & Gas, S.A.B. de C.V., a sociedad anónima bursátil de capital variable organized under the laws of Mexico (the “Company” or “Vista”) can be found in the “Investors” section on the website at
www.vistaoilandgas.com.
This presentation does not constitute an offer to sell or the solicitation of any offer to buy any securities of the Company, in any jurisdiction. Securities may not be offered or sold in the United States absent registration with the U.S. Securities
Exchange Commission or an exemption from such registration.
This presentation does not contain all the Company’s financial information. As a result, investors should read this presentation in conjunction with the Company’s consolidated financial statements and other financial information available on
the Company’s website.
Rounding amounts and percentages: Certain amounts and percentages included in this presentation have been rounded for ease of presentation. Percentage figures included in this presentation have not in all cases been calculated on the
basis of such rounded figures, but on the basis of such amounts prior to rounding. For this reason, certain percentage amounts in this presentation may vary from those obtained by performing the same calculations using the figures in the
financial statements. In addition, certain other amounts that appear in this presentation may not sum due to rounding.
This presentation contains certain metrics that do not have standardized meanings or standard methods of calculation and therefore such measures may not be comparable to similar measures used by other companies. Such metrics have
been included herein to provide readers with additional measures to evaluate the Company’s performance; however, such measures are not reliable indicators of the future performance of the Company and future performance may not
compare to the performance in previous periods.

No reliance may be placed for any purpose whatsoever on the information contained in this document or on its completeness. No representation or warranty, express or implied, is given or will be given by or on behalf of the Company, or any
of its affiliates (within the meaning of Rule 405 under the Act, “Affiliates”), members, directors, officers or employees or any other person as to the accuracy, completeness or fairness of the information or opinions contained in this
presentation or any other material discussed verbally, and any reliance you place on them will be at your sole risk. In addition, no responsibility, obligation or liability (whether direct or indirect, in contract, tort or otherwise) is or will be
accepted by the Company or any of its Affiliates, members, directors, officers or employees or any other person in relation to such information or opinions or any other matter in connection with this presentation or its contents or otherwise
arising in connection therewith.
This presentation also includes certain non-IFRS (International Financial Reporting Standards) financial measures which have not been subject to a financial audit for any period.
The information and opinions contained in this presentation are provided as at the date of this presentation and are subject to verification, completion and change without notice.
This presentation includes “forward-looking statements” concerning the future. The words such as “believes,” “expects,” “anticipates,” “intends,” “should,” “seeks,” “estimates,” “future” or similar expressions are included with the intention of
identifying statements about the future. We have based these forward-looking statements on numerous assumptions, including our current beliefs, expectations and projections about present and future events and financial trends affecting
our business. These expectations and projections are subject to significant known and unknown risks and uncertainties which may cause our actual results, performance or achievements, or industry results, to be materially different from any
expected or projected results, performance or achievements expressed or implied by such forward-looking statements. Many important factors could cause our actual results, performance or achievements to differ materially from those
expressed or implied in our forward-looking statements, including, among other things: uncertainties relating to future government concessions and exploration permits; adverse outcomes in litigation that may arise in the future; general
political, economic, social, demographic and business conditions in Argentina, Mexico and in other countries in which we operate; uncertainties relating to future election results in Argentina and Mexico, particularly presidential elections in
Argentina and congressional elections in Mexico; changes in law, rules, regulations and interpretations and enforcements thereto applicable to the Argentine and Mexican energy sectors, including changes to the regulatory environment in
which we operate and changes to programs established to promote investments in the energy industry; any unexpected increases in financing costs or an inability to obtain financing and/or additional capital pursuant to attractive terms; any
changes in the capital markets in general that may affect the policies or attitude in Argentina and/or Mexico, and/or Argentine and Mexican companies with respect to financings extended to or investments made in Argentina and Mexico or
Argentine and Mexican companies; fines or other penalties and claims by the authorities and/or customers; any future restrictions on the ability to exchange Mexican or Argentine Pesos into foreign currencies or to transfer funds abroad; the
revocation or amendment of our respective concession agreements by the granting authority; our ability to implement our capital expenditures plans or business strategy, including our ability to obtain financing when necessary and on
reasonable terms; government intervention, including measures that result in changes to the Argentine and Mexican, labor markets, exchange markets or tax systems; continued and/or higher rates of inflation and fluctuations in exchange
rates, including the devaluation of the Mexican Peso or Argentine Peso; any force majeure events, or fluctuations or reductions in the value of Argentine public debt; changes to the demand for energy; environmental, health and safety
regulations and industry standards that are becoming more stringent; energy markets, including the timing and extent of changes and volatility in commodity prices, and the impact of any protracted or material reduction in oil prices from
historical averages; changes in the regulation of the energy and oil and gas sector in Argentina and Mexico, and throughout Latin America; our relationship with our employees and our ability to retain key members of our senior management
and key technical employees; the ability of our directors and officers to identify an adequate number of potential acquisition opportunities; our expectations with respect to the performance of our recently acquired businesses; our expectations
for future production, costs and crude oil prices used in our projections; increased market competition in the energy sectors in Argentina and Mexico; and potential changes in regulation and free trade agreements as a result of U.S., Mexican
or other Latin American political conditions.
Forward-looking statements speak only as of the date on which they were made, and we undertake no obligation to release publicly any updates or revisions to any forward-looking statements contained herein because of new information,
future events or other factors. In light of these limitations, undue reliance should not be placed on forward-looking statements contained in this prospectus.
This presentation also includes certain financial estimates which have not been subject to a financial audit for any period. The financial estimates set forth in this presentation are based on assumptions made, and information available to us,
at the time they were prepared. We do not know whether such assumptions will prove to be correct. If one or more of these assumptions prove inaccurate or if future results differ from expected results, then our actual future results could be
less favorable, and could be materially less favorable, than the above-referred projections. Any or all of such estimates may not necessarily be realized. Such estimates can be adversely affected by inaccurate assumptions or by known or
unknown risks and uncertainties, many of which are beyond our control. Many factors will be important in determining our future results. As a result of these contingencies, actual future results may vary materially from our estimates. In view
of these uncertainties, the inclusion of our financial estimates in this presentation is not and should not be viewed as a representation that the projected results will be achieved.
You should not take any statement regarding past trends or activities as a representation that the trends or activities will continue in the future. Accordingly, you should not put undue reliance on these statements. This presentation is not
intended to constitute, and should not be construed as investment advice.

                                                                                                                                                                                                                                                             2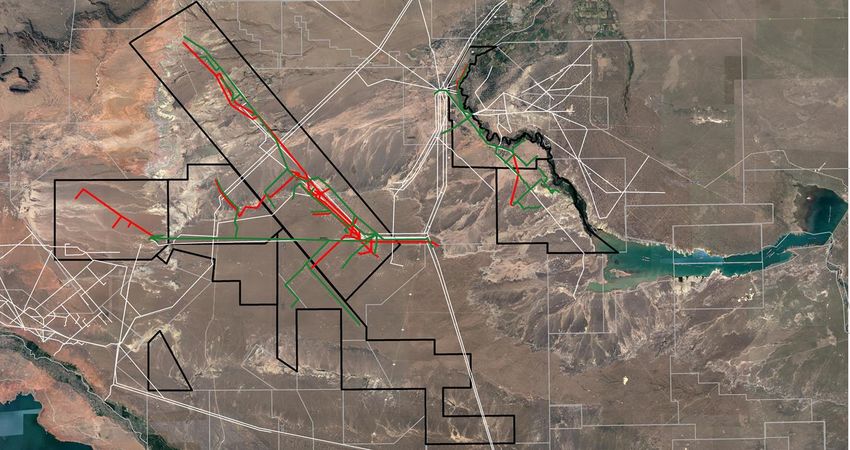
Company overview

  Strong operating and financial performance                                                                      Concentrated in Argentina’s Premier Basin
                                                                                                                Neuquina Basin blocks(5)
                                                                                                  29.0
  LTM Revenue(1)                      $435MM             2Q19 Production
                                                                                                Mboe/d

                                                                                                  57.6
  LTM Adj. EBITDA(1)(2)               $186MM             2018 1P Reserves(4)
                                                                                                MMboe

  Net debt                            $292MM             2Q19 Lifting cost                   $12.3/boe

  Gross / net leverage                                                                       ~134,000
                                   2.0x / 1.6x           Vaca Muerta acreage
  ratio(3)                                                                                   net acres

                                                                                                                                                                                           Águila Mora
  Profitable operated asset base with growth potential

  ◼   Operational platform in Argentina acquired in April 2018

  ◼   Conventional assets with production base and infrastructure in place,
      with spare capacity to treat and evacuate incremental production                                                                                                                                      25 de Mayo
                                                                                                                                                                                                             Medanito

  ◼   Top-quality Vaca Muerta acreage already producing, and leveraged
      by existing asset base

  ◼   Key positions staffed with top-notch professionals with proven
      experience in Neuquina Basin and Vaca Muerta development

  ◼   Actionable and profitable growth plan consisting of almost 100%
      operated assets and over 400 Vaca Muerta identified prime drilling
      locations

                                                                                                                                   Coirón Amargo Sur
  ◼   JV over 3 on-shore blocks in Mexico, of which 2 will be operated by                                                                      Oeste
                                                                                                                                                                        Coirón Amargo Norte

      Vista
                                                                                                                      Vista blocks with unconventional potential   Vista conventional blocks

(1)    Based on 3Q18, 4Q18, 1Q19 and 2Q19 actual figures in Financial Statements.                               (4)     Reserves as of December 31, 2018, as audited by Gaffney, Cline & Associates.
(2)    Adj. EBITDA = Net (loss) / profit for the period + Income tax (expense) / benefit + Financial results,   (5)     Two non-operated blocks in Noroeste and Golfo San Jorge basins (Argentina), one operated block
       net + Depreciation + Restructuring expenses + Other adjustments                                                  in Sureste basin (Mexico), one operated block and another non-operated block in Tampico-         3
(3)    Gross leverage ratio calculated as total financial debt divided by LTM Adj. EBITDA. Net leverage                 Misantla basin (Mexico) not shown.
       ratio calculated as total financial debt minus cash & equivalents divided by LTM Adj. EBITDA.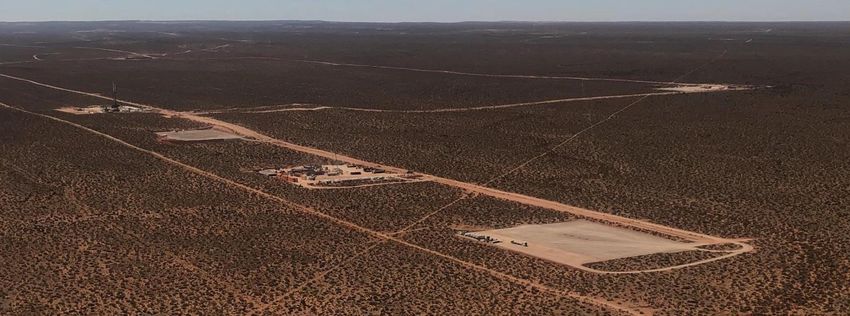
Platform poised for growth
Delivered on 2018 guidance and confirmed 2022 targets

  High-growth organic development plan, based on current premium asset base

                                        2018                           2018                                                                2019
                                                                                                           %                                                               Target production growth
                                     Guidance(1)                     Actuals(2)                                                          Guidance
                                                                                                                                                                   boe/d
            Daily
                                    24,100 boe/d                   24,500 boe/d                      1.7%                             29,900 boe /d
       Production                                                                                                                                                                                       65,000
              Adj.
                                       $190MM                         $195MM                         2.6%                                 $225MM
         EBITDA(3)
      Adj. EBITDA
                                          43%                            45%                        2 p.p.                                    47%
            Margin                                                                                                                                                          24,500

        Operating
                                      $17.3/boe                      $13.9/boe                     (19.7)%                               ∼$13/boe
        Expenses

              Capex                    $143MM                         $130MM                        (9.1)%                                $300MM                         2018 Actual                2022 Target

                                                                                        LTM operational highlights

                                                              Achieved 18% production growth since beginning of operations

                                                          Reduced average operating cost from US$16.9/boe to US$12.3/boe(5)

                                                Increased proved reserves from 52.2 MMboe to 57.6 MMboe - implied RRR of 161%

                                              Bajada del Palo Oeste first 4-well pad already in production with 4,823 boe/d in 2Q19

(1)      As presented at the Shareholders Meeting on March 2, 2018.                                             (4)      2018A-2022E Compounded Annual Growth Rate.
(2)      All FY 2018 figures were calculated with the 1Q pro forma results from the acquired entities and       (5)      From the three-month period ended March 31, 2018 (information corresponding to all assets
         assets plus Vista’s results for 2Q, 3Q and 4Q.                                                                  acquired in the Initial Business Combination) to the three-month period ended June 30, 2019.
(3)      Adj. EBITDA = Net (loss) / profit for the period + Income tax (expense) / benefit + Financial results,
         net + Depreciation + Restructuring expenses + Other adjustments                                                                                                                                                   4
Important Note: Projections are forward-looking statements that are based on assumptions that are inherently subject to significant uncertainties and contingencies, many of which are beyond our control. There will be
differences between actual and projected results, and actual results may be materially greater or materially less than those contained in the projections.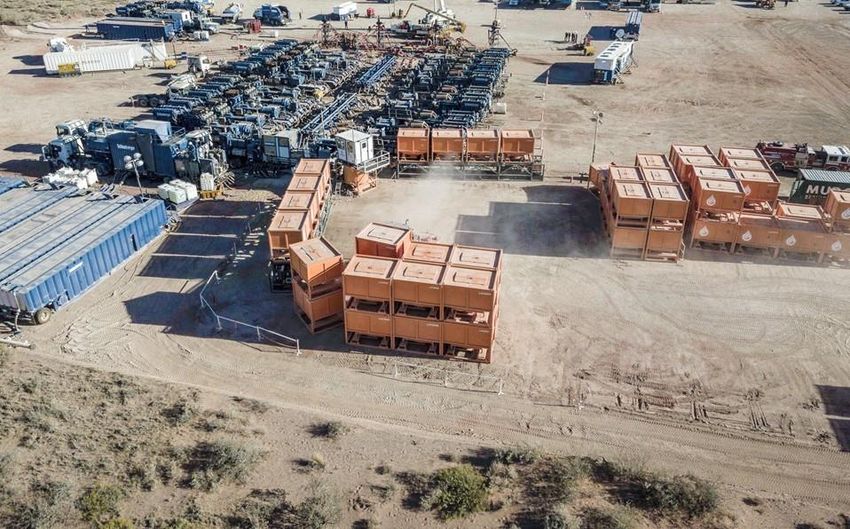
Investment highlights

   Low-cost and stable conventional operation

   Prime Vaca Muerta locations already under development
   with solid results

   Strong cash flow generation with significant upside potential

   Flat and agile organization led by experienced Oil & Gas
   team

             Only “pure-play” Vaca Muerta public investment opportunity
                                                                          5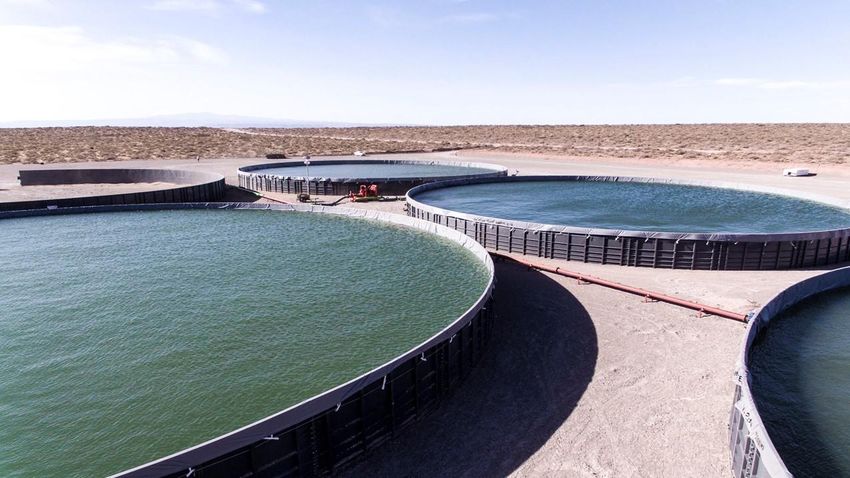
Low-cost and stable
conventional
operation
Low-cost and stable conventional operation
Conventional assets operating milestones

  Reverted decline in conventional production
 Total production
 (Mboe/d)                  Pro forma                                                                                                 Actual
                                                                                                                      +18%                                                               29.0
              27.2
                                                                                                                                                                   25.7
                                           24.6                          24.4                          24.2                          24.7

              2017                        1Q18                          2Q18                          3Q18                           4Q18                          1Q19                  2Q19

                                                                                     Conventional        Unconventional

      24.1                                                                             24.1
  Reduced operating expenses                                                                                       Achieved a YE 2018 reserve replacement ratio of 161%(2)
                                                                                                                     57.1
 Lifting cost                                                                                                      Proved reserves
 ($/boe)                                                                                                           (MMboe)
      Pro forma                                         Actual
       16.9                                    (27%)                                                                                                                                      57.6(2)
                                                                                                                                 52.2
                       14.1                                                                                                                                                        (4)
                                                                                                                                                                            14.3
                                                         12.6                              12.3                                                         (8.9)(3)                           23.4
                                        11.8                              12.0
                                                                                                                                 19.6

                                                                                                                                 32.6                                                      34.2

      1Q18            2Q18             3Q18             4Q18             1Q19             2Q19                                 YE 2017(1)           Production            Additions      YE 2018

                                                                                                                                                         Oil                 Gas

(1)     The information for 2017 includes estimated quantities of proved reserves based on information provided by the previous owners of the blocks acquired by Vista.
(2)     Includes 3.4 MMboe of total proved unconventional reserves.
(3)     Production excludes natural gas consumption of 0.7 MMboe.                                                                                                                                   7
(4)     Additions are calculated as the difference between YE 2018 reserves less YE 2017 reserves plus FY2018 production.
Low-cost and stable conventional operation
High-quality oil-weighted production cluster
Asset profile
2018 1P Net 2Q 2019
Total production 1P Reserves(1) Reserves
(1)
Net production
(5)
Concession
Block W.I. (%) (MMboe) Acreage (Mboe/d) term Operator
(2Q19) (YE 2018)
(6)
Entre Lomas (EL) 100% 18.8 183,014 8.6 2026 Yes
Bajada del Palo Oeste
100% 15.9 62,641 8.9 2053 Yes
(BPO)
65% Bajada del Palo Este
100% 3.1 48,853 1.4 2053 Yes
(BPE)
29.0 Mboe/d 33% 59% 57.6 MMboe 41%
(7)
Agua Amarga 100% 1.8 95,580 0.7 2034/2040 Yes
Neuquina
3% 25 de Mayo Medanito 100% 8.6 32,247 3.7 2026 Yes
Jaguel de los Machos 100% 7.0 48,359 4.6 2025 Yes
Argentina
Oil Gas NGL Oil(2) Gas
Coirón Amargo Norte
55% 0.6 14,629 0.3 2037 Yes
(CAN)
◼ Oil and gas production from well-understood reservoirs
Aguila Mora 90% – 21,128 – 2019 (8) Yes
◼ Primary and secondary recovery showing attractive returns
Coirón Amargo Sur Oeste
10% 1.3 1,644 0.3 2053 Yes
(CASO)
◼ Light crude oil production sold mainly to domestic off-takers(3)
Jorge
Golfo
San
Sur Río Deseado Este 16.9% – 12,807 0 2021 No
◼ Gas production sold to industrial clients (74%), distributors & CNG
(20%) and spot sales to power generation and traders (6%)(4)
Noroeste
Acambuco 1.5% 0.5 4,406 0.2 2036/2040 No
◼ Treatment and evacuation infrastructure in place with spare
capacity
Sureste
(9)
CS-01 50.0% – 11,758 0.2 2047 Yes
~1,100 active Medanito type crude oil
Mexico
producing wells production with API >30 (9)
Tampico -
Misantla
A-10 50.0% – 42,915 0.1 2047 Yes
TM-01 50.0% – 8,944 – 2047 No
2018 Reserve Replacement
+200 injector wells
Ratio of 161% Total 57.6 588,925 29.0
(1) Includes 3.4 MMboe of total proved unconventional reserves. (6) Includes Entre Lomas Neuquén and Entre Lomas Río Negro.
(2) Represents crude oil, condensate, gasoline and LPG. (7) Includes Jarilla Quemada and Charco del Palenque.
(3) In 2Q19, Vista completed its first export sale. (8) A 35-year unconventional concession request was filed with the Province of Neuquén on June 11th,
(4) As of LTM 2Q19. 2019. Provincial Decree authorizing such request is expected in August. 8
(5) Includes 4.8 Mboe/d of unconventional production in Bajada del Palo Oeste and 0.3 Mboe/d of (9) Vista will operate the field once approved by the National Hydrocarbons Commission “CNH”.
unconventional production in Coirón Amargo Sur Oeste.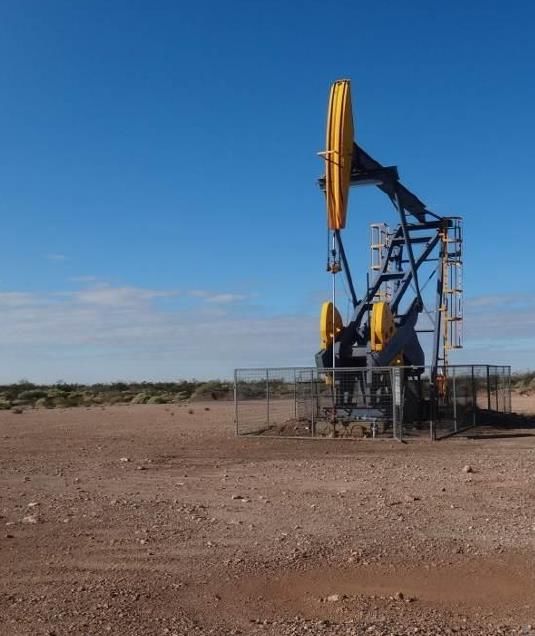
Prime Vaca Muerta
locations already
under development
with solid results
Vaca Muerta history recap
Building momentum
(Mboe/d)
300
May-2013: First
unconventional EPF in
Loma La Lata Norte
250 Jun-2013: EIA report Mar-2017: Tecpetrol
states Vaca Muerta is starts field development in
the 2nd largest shale Fortin de Piedra
gas and 4th largest
200 shale oil resource Apr-2017: YPF signs
worldwide agreement with Jun-2018: Exxon signs
Schlumberger agreement with Qatar
Jul-2013: New Loma Petroleum
Campana concession May-2017: YPF signs
150 approved (35 years) agreement with Shell Dec-2018: YPF starts
Mar-2014: YPF introduces full field development
walking rigs to Vaca Muerta Aug-2017: YPF signs in La Amarga Chica
Aug-2013: YPF signs
agreement with agreement with Equinor
100 Apr-2014: YPF starts full field Dec-2018: YPF signs
Chevron
development in Loma agreement with Petronas
Campana
Sep-2013: YPF signs
agreement with Dow Feb-2019: Vista ties-in
first pad in Bajada del
50 Palo Oeste
0
2012 2013 2014 2015 2016 2017 2018 2019
Aug-2012: YPF Jul-2014: First Jun-2015: YPF discovers Apr-2018: Vista acquires assets
announces its 100- walking rigs start unconventional gas in La from Pampa and Pluspetrol
Days Plan, with VM operating in Ribera
as the key driver for Argentina Jul-2018: Vista starts full field
growth development in Bajada del Palo
Oct-2014: Congress Oeste
Oct-2012: YPF sanctions New
announces the Plan Hydrocarbons Law Aug-2018: Vista and Shell
Exploratorio announce asset swap
Argentino (PEA) Dec-2014: YPF
signs deal with Nov-2018: Vista obtains CENCH
Dec-2012: YPF signs Petronas for Bajada del Palo Este and
MOU with Chevron Oeste
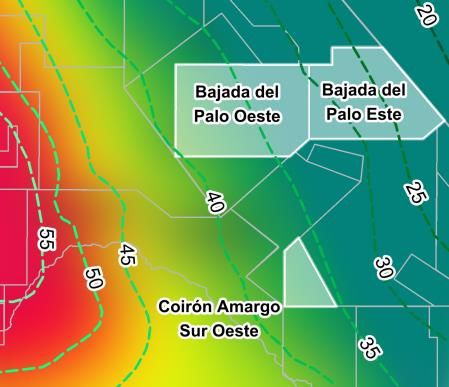
10Vista’s Vaca Muerta acreage
Four blocks in the epicenter of prominent developments
Bajada del Palo Oeste
◼ Net acres: 62,641 (100% WI)
◼ License term: 2053
◼ 2019 plan: 12 new wells in production (8 wells already
producing)
◼ Operator: Vista
◼ Commitment: capital expenditure of $106MM until June
2020 (fulfilled as of 2Q19)
◼ Production reached 4,823 boe/d with 4 wells in 2Q19
Coirón Amargo Sur Oeste
◼ Net acres: 1,644 (10% WI)
◼ License term: 2053
◼ 2019 plan: 3 new wells in production (completed in 1Q19)
◼ Operator: Shell
◼ Four wells currently in production supporting Vista’s view
on type curve
Bajada del Palo Este
◼ Net acres: 48,853 net acres (100% WI)
◼ License term: 2053
◼ Operator: Vista
◼ Commitment: capital expenditure of $52MM until
December 2021
Contour lines numbers denote API degrees Águila Mora
◼ Net acres: 21,128 (90% WI)
◼ License term: Requested unconventional concession on
De-risked areas adjacent to developed fields from global O&G players June 11th – Provincial Decree authorizing request
including ExxonMobil, Chevron, Shell and YPF, among others expected in August
◼ Operator: Vista
Producing areas Pilot / Delineation areas
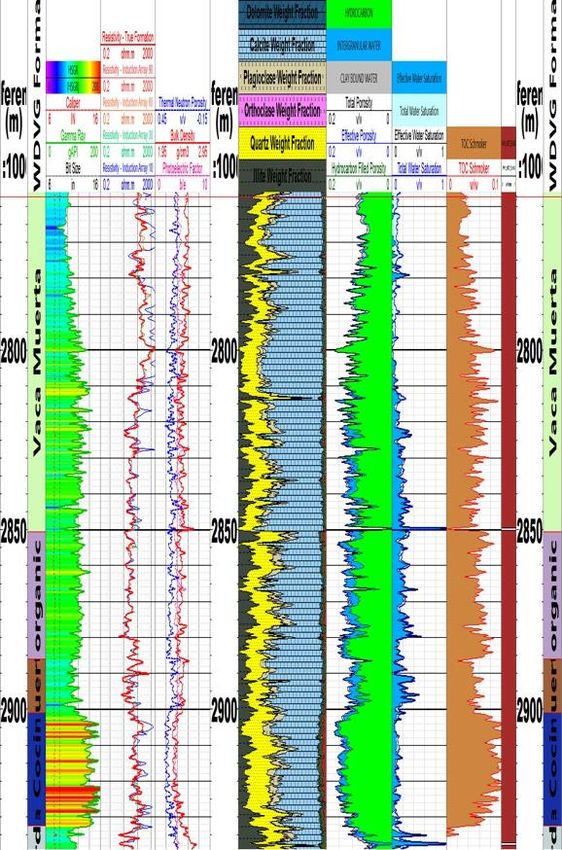
11Vista’s Vaca Muerta development
Bajada del Palo Oeste prime acreage
Potential Best-in-Class Resource Properties(1) Cube development scheduled to minimize parent-child effect
Bajada del Permian
Eagle Ford
Palo Oeste (Wolfcamp)
TOC (%) 4.2 3 3-5
Location
250 200 - 300 30 - 100 of Vista’s
Thickness (m) first pads
Pressure (psi/ft) 0.9 0.6 0.5 – 0.9
Stacked pay potential across multiple zones
Conceptual cube development
Drilling inventory
Base plan +400 wells ▪ Consistent strong results across 4 wells in first pad
▪ Finalized drilling and completion of second 4-well pad with
800 – 900ft / 250 – 300m
lateral spacing improved efficiency
Upper
Carbonate Achieved ramp-up in unconventional production
Mboe/d
Mid 7.0
Carbonate
6.0
5.0
~250m 4.0
Lower
Carbonate 3.0
2.0
1.0
Organic
0.0
1-Mar-19 21-Mar-19 10-Apr-19 30-Apr-19 20-May-19 9-Jun-19 29-Jun-19 19-Jul-19
La 153 days
Cocina Oil Gas
In base plan Potential 12
(1) Based on Company estimates, Ministerio de Hacienda, Secretaría de Energía and the EIA.Vista’s Vaca Muerta development
Bajada del Palo Oeste fast track to full-scale development in factory-mode
Fast track development plan supported by novel One-Team approach
Year 1 Year 2 Year 3 Year 4 Year 5 Year 6 Year 7
Typical
development Delineation Phase Pilot Phase 1 Field Development in Factory Mode
BAJADA DEL Current stage
PALO OESTE Ramp-up Field Development in Factory Mode
Fast track
development
Walking rig drilling
horizontal sections in
2nd PAD Spudder rig already
drilled surface and
intermediate sections
Frac set
completing 1st PAD
Location ready
Drilling Completions 13Vista’s Vaca Muerta development
Bajada del Palo Oeste fast track to full-scale development in factory-mode (cont’d)
22 Km flat-hose water transfer to tanks
on location
• 100% guaranteed water availability during frac activities
• Reduced cost
• Minimal environmental impact
• 7,500 truck trips avoided
14Vista’s Vaca Muerta development
Bajada del Palo Oeste fast track to full-scale development in factory-mode (cont’d)
100% of completion using sand boxes
• Minimal exposure to sand dust
• Improved logistics and reduced trucking costs
• Improved productivity by increasing sand available
on location
15Vaca Muerta development (1/2)
Significant drilling and completion improvement between first and second pads
State-of-the-art technology Improved efficiency in second pad
Drilling: Drilling speed Completion speed
◼ Drilled surface and intermediate sections with spudder rig ft/day stages/day
◼ Rotary Steering System during the build-up section +52% 726 +52% 7.6
Completion: 477 5.0
◼ Silobags to store proppant near the pad’s location
◼ Monoline frac-manifold system to connect all 4 wells
◼ Rig-lock wireline connection and frac valves remote greasing
First pad Second pad First pad Second pad
Drilling and completion cost within budget Significant cost reduction in second pad
D&C cost per well Completion cost
Metric Average per well
$MM $/stage
First pad Second pad 13.8 (9%) (9%)
Lateral length 0.22
2,550 / 8,366 2,117 / 6,946 12.6 0.20
(meters/ft)
Stages (#) 34 36
Frac spacing
75 / 246 60 / 197
(meters/ft)
First pad Second pad First pad Second pad
First pad highlights Second pad highlights
◼ 5 average stages per day (136 stages in 27 days) ◼ 7.6 average stages per day (143 stages in 18.8 days)
◼ Pumping time reached 19.3 hours and 8 stages in a 24-hour period ◼ Pumping time reached 22.0 hours and 11 stages in a 24-hour period
◼ Fluids and sand reached 12,697 m 3 / 42,856 sxs
◼ Reduced frac spacing from 75 to 60 meters
◼ 10 clusters per stage
16Vaca Muerta development (2/2)
Strong results from the first 4-well pad in Bajada del Palo Oeste
Outstanding production performance above Vista’s type curve
Mboe Mboe/d
2.4
180 Peak IP-30 (boe/d) 180.1 2.1
177.6
1.8
MdM-2013h 1,310
1.5
160 1.2
MdM-2014h 1,884
0.9
MdM-2015h 1,392 0.6
140 138.1
133.3 0.3
MdM-2016h 1,670
0
120 0 10 20 30 40 50 60 70 80 90 100 110 120 130 140 150 160 170
Average 1,564 Days
MdM-2013h MdM-2014h MdM-2015h MdM-2016h Vista's type curve (1.1 Mmboe)
100
Two successfully tested landing zones
80
Formation First pad Second pad
60 Upper Carbonate To be tested by Vista
On average, cumulative
40 Mid Carbonate To be tested by Vista
production of 4 wells is
22% above type curve
20 Lower Carbonate To be tested by Vista
after 150 days
MdM-2013h MdM-2015h MdM-2029h MdM-2032h
0 Organic
0 10 20 30 40 50 60 70 80 90 100 110 120 130 140 150 160 170 MdM-2014h MdM-2016h MdM-2030h MdM-2033h
Days La Cocina
(1)
MdM-2013h MdM-2014h MdM-2015h MdM-2016h Vista's type curve (1.1 Mmboe)
Oil EUR (Mboe) 972 Gas EUR (Bcf) 0.6 Total EUR (Mboe) 1,079
Vaca Muerta Dry gas Peak IP 30
Peak IP 30 (boe/d) 1,017 0.6 Peak IP 30 (boe/d) 1,119
Type Curve(1) (MMcf/d)
180-day cum
147 180-day cum (Bcf) 0.09 180-day cum (Mboe) 163
(Mboe)
17
(1) Type curve defined in 2018 without reflecting data acquired in Bajada del Palo Oeste first pad.Vista’s Vaca Muerta development
Strong results from the first 4-well pad in Bajada del Palo Oeste tied-in late 1Q19 (cont’d)
First 4 wells are performing in line with top quartile wells in the basin(1)…
Mboe/d
2.0
1.8
1.6
1.4
1.2
1.0
0.8
0.6
0.4
0.2
0.0
Month 1 Month 2 Month 3 Month 4 Month 5
….and compare favorably to the top 100 wells in the Permian(2)
Mboe/d
3,000
2,500
2,000
1,500
1,000
500
0
1
2
3
2
4
3
4
5
3
6
4
7
1
3
4
7
7
2
1
7
4
2
7
2
8
7
6
7
4
7
6
7
1
1
7
3
7
3
4
9
8
4
8
7
2
1
7
4
8
8
8
8
3
8
8
8
4
7
3
8
8
4
7
3
5
8
4
2
8
4
2
8
5
9
9
5
4
8
10
10
11
11
12
10
13
11
11
10
14
13
10
15
10
10
13
16
10
11
15
10
Vista
Vista
Vista
Vista
Companies
(1) Capítulo IV – Argentine Secretariat of Energy; Vista’s month 5 preliminary information; 90 top performing wells in the basin.
(2) Based on IP30 curves. Wells normalized to Vista average lateral length of 8,366 ft. Only includes Permian oil weighted wells with lateral lengths over 7,500 ft. drilled by public operators since October 2018.
100 Permian wells shown out of 129 wells with lateral length adjusted production above 500 boe/d. 18Strong cash flow
generation with
CUSTOM LAYOUT
significant upside
potential
Unsaved Document / 3/6/2019 / 23:41Funding Aleph Midstream joint-venture
Strategic transaction frees up capital for higher return upstream activities
Transaction Summary
◼ Vista, Riverstone and Southern Cross created an independent midstream company to
operate in the Neuquina basin focused on Vaca Muerta shale oil
◼ Vista is expected to contribute a majority of its existing midstream assets to Aleph in
exchange for a equity interest of at least 21.6% in the company
◼ Financial Sponsors are expected to contribute up to $160 million to Aleph in exchange for an
equity interest in the company of up to 78.4%
◼ Aleph Midstream is managed by an independent management team and its board is chaired
by an independent chairman
◼ Aleph Midstream is expected to deploy necessary capital to build additional facilities required
to service Vista’s projected increase in oil and gas production
◼ Vista expects to commit and deliver a minimum volume of hydrocarbons to Aleph Midstream
at an agreed tariff, plus operational expenses
Business case
◼ Aleph is the first midstream player focused on providing gathering, processing, and
evacuation services for oil and gas production in the Neuquina basin
◼ History of unconventional play in the United States shows that offloading midstream capital
to a third party can allow for a potential more rapid production growth
− Aleph Midstream could allow upstream players to focus on core E&P activities
20Funding: capital markets activity
Raised $200 million through dual listing in NYSE and two-tranche Argentine bond
issuances
Vista closed and settled a global offering of 10,906,257 Vista Argentina raised $50 million in 24-month local bond
shares in NYSE and BMV and began trading on the NYSE issuance and raised additional $50 million in 36-month
subsequent local bond issuance
• Gross proceeds totaled approximately $ 101 million
• 7.88% and 8.50% annual interest rate for the 24-month and
• Following the closing of the transaction, Vista’s outstanding 36-month class, respectively
shares reached 86,835,259
• Bullet at maturity on July 31, 2021 and August 7, 2022
• Shares were issued at 9.25 $/share
• Quarterly interest payments
• After the offering, shares are traded under the ticker VIST in
NYSE
21Financial overview
Solid financial position
Q2 2019 Vista consolidated cash flow
$MM
(3) (4) (5)
Cash flow from operating activities Cash flow from investing activities
Financial debt breakdown As of June 30, 2019 Quarterly leverage ratios as of June 30, 2019(1)
5-year unsecured term loan 305.6
Gross leverage ratio 2.0 x
Local debt in Argentina (US dollar denominated) 60.6
Net leverage ratio 1.6 x
Total financial debt(2) 366.2
(-) cash and cash equivalents 74.5 Pro forma net leverage ratio(6) 1.1 x
Net debt $291.8
1) Vista’s LTM Adj. EBITDA 4) FY 2018 income tax payment
2) Current borrowings total 85.9 $MM while non current borrowings total $MM 280.3 5) Reversal of acquisition of property, plant and equipment pending to be paid as of June
3) Excludes tax payments; Includes acquisition of property, plant and equipment pending to 30, 2019 22
be paid as of June 30, 2019 6) Pro forma $100 million equity issuance; estimated net proceeds of $93.24 millionPositive outlook for future growth
Vaca Muerta-driven growth plan leveraged by conventional operating platform
Drilled wells Capex Production
(#) ($MM) (Mboe/d)
+22%
+131% 300 29.9
+42%
24.5
34
24 130
2018A 2019E
2018A 2019E 2018A 2019E
Conventional Unconventional
Revenues(1) Lifting cost Adj. EBITDA(1)
($MM) ($/boe) ($MM) Adj. EBITDA
+10% (6%) Margin (%)
+15%
480 16
13.9 ~13.0
250
225
90%
436 14
200
195
80%
70%
12
60%
10
150
50%
8
40%
100
47%
6
4
45% 30%
20%
50
2
10%
0 0 0%
2018A 2019E 2018A 2019E 2018A 2019E
(1) 2019 projections at average oil sales price $60/boe and natural gas @ $3.7/MMBtu. 23
Important Note: Projections are forward-looking statements that are based on assumptions that are inherently subject to significant uncertainties and contingencies, many of which are beyond our control. There will be
differences between actual and projected results, and actual results may be materially greater or materially less than those contained in the projections.Flat and agile organization led by experienced Oil & Gas team
Lean organization led by one of the most experienced O&G teams in
the region
▪ +25 years of energy experience across five continents (integrated oil and gas and oilfield services)
Miguel Galuccio
Chairman and CEO ▪ Independent board member of Schlumberger
▪ Former Chairman and CEO of YPF and President of Schlumberger SPM/IPM(1)
▪ Petroleum Engineering degree from Instituto Tecnológico de Buenos Aires
Top performing executive team Board of directors of world class professionals
Pablo Vera Pinto – Chief Financial Officer
+15 years of international business development, consulting and investment banking
Kenneth Ryan – Non-independent
experience Partner, Head of Corporate Development, Capital Strategies and Investor Relations at
▪ Former Business Development Director at YPF; board member at Profertil (Agrium-YPF), Riverstone in New York
Dock Sud (Enel-YPF) and Metrogas (YPF) ▪ University of Dublin Law School, Trinity College
▪ Prior experience at McKinsey and Credit Suisse
▪ MBA INSEAD; Economics degree from Universidad Di Tella
Susan L. Segal – Independent
Member of the Board of Americas Society / Council of the Americas, the Tinker
Juan Garoby – Chief Operating Officer Foundation, Scotiabank and MercadoLibre, as well as President of the Board of
+20 years of E&P and oilfield services experience Scotiabank USA
▪ Former Interim VP E&P, Head of Drilling and Completions, Head Unconventionals at YPF and ▪ Sarah Lawrence University and MBA from Columbia University
former President for YPF Servicios Petroleros (YPF owned drilling contractor)
▪ Prior experience in Baker Hughes and Schlumberger
Mauricio Doehner Cobián – Independent
▪ Petroleum Engineer from Instituto Tecnológico de Buenos Aires
Executive Vice President of Corporate Affairs & Risk Management at Cemex since 2014
▪ Bachelor’s degree in Economics from Tecnológico de Monterrey, MBA from IESE/IPADE, and
Alejandro Cherñacov – Strategic Planning & Investor Relations Officer a Professional Certificate in Competitive Intelligence by the FULD Academy of Competitive
+13 years of LatAm E&P strategy, portfolio management and investor relations Intelligence in Boston, Massachusetts
experience
▪ Former CFO of small-cap Canada-listed E&P company Pierre-Jean Sivignon – Independent
▪ Prior experience as Investor Relations Officer at YPF Advisor to the Chairman and CEO of Carrefour Group in Paris until December 2018,
▪ Masters in Finance from Universidad Di Tella, Strategic Decision & Risk Management where he previously held the position of Deputy CEO, CFO and Member of the Executive
Professional Certificate from Stanford, Economics degree from Universidad de Buenos Aires Board
▪ French baccalaureate with honors in France and MBA from ESSEC (Ecole Superieure des
Sciences Economiques et Commerciales)
Gastón Remy – Argentina General Manager
+15 years of energy industry experience
Mark Bly – Independent
▪ Former president of Dow Argentina and southern region of Latin America +30 years of experience in the O&G industry
▪ Occupied various executive positions internationally at BP
▪ President of the Instituto para el Desarrollo Empresarial de la Argentina (IDEA)
▪ Master’s degree in Structural Engineering from the University of California and a Bachelor’s
▪ Lawyer from Universidad de Buenos Aires and LLM from University of Columbia degree in Civil Engineering from the University of California
25
(1) Schlumberger Production Management and Schlumberger Integrated Project Management, business segments of Schlumberger Ltd.Closing remarks
Low-cost and stable conventional operation
Prime Vaca Muerta locations already under development
with solid results
Strong cash flow generation with significant upside potential
Flat and agile
organization led by
experienced Oil &
Gas team
Only “pure-play” Vaca Muerta public investment opportunity
26CUSTOM LAYOUT
Appendix
Unsaved Document / 3/6/2019 / 23:41Revenues and pricing
Revenues growth driven by higher production
Revenues Crude oil average price Natural gas average price
$MM $/bbl $/MMBtu
+9% (12)%
(21)%
120.4 68.0
110.3 59.8
93.7 56.7 4.8
3.7 3.8
Q2 2018 Q1 2019 Q2 2019 Q2 2018 Q1 2019 Q2 2019 Q2 2018 Q1 2019 Q2 2019
▪ Driven by higher volumes sold, ▪ Main off-takers were Trafigura ▪ Softer sales prices mainly driven
partially offset by lower realized and Shell by over-supplied domestic natural
prices ▪ Sales prices impacted by a lower gas market
average Brent price and export
parity based pricing formula
28Opex
Strong y.o.y. lifting cost reduction
Total Opex Opex per boe
$MM $/boe
+4%
(13)%
31.3 32.5 14.1
27.8 12.0 12.3
(1) (1)
Q2 2018 Q1 2019 Q2 2019 Q2 2018 Q1 2019 Q2 2019
▪ Continued focus on controlling costs with new contracting model; decrease in lifting cost versus Q2 2018
driven by shale production ramp-up with minimal incremental cost
(1) Includes crude oil stock fluctuation for $MM 0.4
29Adjusted EBITDA
Y.o.y. growth driven by shale oil production ramp-up
Adj. EBITDA(1) Adj. EBITDA Margin
$MM %
+5%
49.1 51.5 45% 43%
40%
37.1
Q2 2018 Q1 2019 Q2 2019 Q2 2018 Q1 2019 Q2 2019
▪ Production growth more than offsets lower realized prices
(1) Adj. EBITDA = Gross profit + Fix assets depreciation + Other assets depreciation + Extraordinary expenses (Income)
30Consolidated Balance Sheet
Amounts expressed in $MM
As of As of
Consolidated Balance Sheet
June 30, 2019 December 31, 2018
Cash and cash equivalents 74.5 80.9
Trade and other receivables 109.5 86.1
Inventories 16.8 18.2
Total current assets 200.8 185.1
Property, plant and equipment 898.1 820.7
Goodwill 28.5 28.5
Right-of-use assets 9.8 -
Other intangible assets 32.0 31.6
Other non current assets - -
Trade and other receivables 18.4 20.2
Total non-current assets 986.8 901.0
Total assets 1,187.6 1,086.1
Provisions 4.7 4.1
Borrowings 85.9 10.4
Salaries and other contributions 6.2 6.3
Income tax liability - 22.4
Leases liabilities 4.5 -
Other taxes and royalties payable 7.4 6.5
Trade and other payable 73.8 84.3
Total current liabilities 182.5 134.1
Deferred income tax liabilities 134.4 133.8
Provisions 16.0 16.2
Leases liabilities 5.5 -
Borrowings 280.3 294.4
Warrants 35.7 23.7
Defined employees’ benefit plans 4.5 3.3
Trade and other payable 0.8 1.0
Total non-current liabilities 477.3 472.4
Total liabilities 659.8 606.5
Total equity 527.8 479.7
Total liabilities and equity 1,187.6 1,086.1
31Consolidated Income Statement
Amounts expressed in $MM
April 1, 2019 to April 1, 2018 to
Income Statement June 30, 2019 June 30, 2018 Adjusted EBITDA(1) reconciliation
Revenues 120.4 110.3 Adjusted EBITDA for Q2 2019 was 51.5$MM, with an Adjusted
EBITDA margin of 43%
Revenues from crude oil sales 97.5 85.3
Revenues from natural gas sales 20.2 22.7
Revenues from gas liquids 2.7 2.3 Adjusted EBITDA Reconciliation April 1, 2019 to April 1, 2018 to
($MM) June 30, 2019 June 30, 2018
Cost of sales 92.9 79.1
Operating expenses 32.5 30.9
Net Result 3.7 -40.9
Stock fluctuation -2.0 0.4
Income taxes (deferred and current) -1.3 31.4
Depreciation 44.3 30.9
Financial results, net 4.8 19.1
Royalties 18.2 16.9
Operating profit 7.2 9.7
Gross profit 27.4 31.2
Depreciation 44.3 30.9
Selling and administrative expenses 20.0 13.4
Restructuring expenses 0 6.2
Exploration expenses 0.8 0.3
Other adjustments - 2.4
Other operating income/expenses, net -0.6 7.8
Adjusted EBITDA(1) 51.5 49.1
Operating profit (loss) 7.2 9.7
Adjusted EBITDA Margin (%) 43% 45%
Interest income 0.2 -0.5
Interest expense -6.5 -2.7
Other financial results 1.5 -15.9
Financial results, net -4.8 -19.1
Profit (Loss) before income taxes 2.4 -9.5
Income taxes (deferred and current) 1.3 -31.4
Net Result 3.7 -40.9
(1) Adj. EBITDA = Net (loss) / profit for the period + Income tax (expense) / benefit + Financial results, net + Depreciation + Restructuring expenses + Other adjustments 32Vista’s existing facilities
Facilities capacity in place allow for initial development phase startup
Vista holds enough treatment and transportation capacity to increase oil production to ~32Mboe/d with minimal investments in facilities
Entre Lomas (EL) Capacity Oil Facilities
Oil treatment ~25 Gas Facilities
1EC plant Mbbl/d TGS/TGN &
s1LO Oldelval
1LO Gas processing ~45 Pipelines
s2EL (LPG-HRU) Mscf/d EL
25 de Mayo Medanito
2EL PTC Oil treatment
5
plant (OTP)
Water treatment ~80 PIAS
1EL
plant Mbbl/d Water &
Entre Lomas effluent
treatment
PIAS
6PB Medanito / Jaguel de los
4PB Capacity Gas
s1BP
Machos (MED-JDM) processing
4PB 3CB
Bajada del Bajada del Oil treatment plant ~19 (LPG – HRU)
2sBP sLPi
Palo Oeste Palo Este Mbbl/d
1BP s1BoMo Battery
6CB
8PB 7PB
2BMo 2CB Water treatment plant ~70 MED - JDM
5 Jaguel de los Machos
N1 N2 Mbbl/d Crude
s1BMo LPG-HRU Conditioning
Coirón ULACT
Amargo 4CB Plant (PTC)
s5CB
Norte 7
Salt Water
sChdPS Injection Plant
(PIAS)
Battery
Coirón Amargo
Sur Oeste Agua Amarga Satellites
Lease
automated
custody
transfer
(LACT) unit
These assets will be contributed to Aleph Midstream in exchange for an equity interest in the company (next slide)
33Mexican assets overview
First steps towards platform regionalization
C
B A
Key facts Operator Location Background / development strategy
◼ State: Tabasco Vista
A ◼ Incremental production through workover
◼ Net area: 11,758 acres(1) activities and new drilling prospects to
◼ Fluid: Oil and Condensate produce undeveloped reserves at upper
Zargazal and Amate formations which have
◼ Fields: 2
CS-01 original pressure and hydrocarbon saturation
◼ Wells Drilled: 50
◼ Future upside will come from field
◼ Lithology: Sandstone
redevelopments, infrastructure upgrades and
◼ 1Q19 net production: 0.2 Mboe/d(1) exploration of untested deeper formations
B ◼ State: Tabasco Vista ◼ 13 wells have been drilled supporting
◼ Net area: 42,915 acres(1) assessment potential
◼ Fluid: Gas ◼ Exploratory area with gas potential in Amate
A-10 ◼ Fields: 4 Formation
◼ Drilled Wells: 19 ◼ Tepetitán Field (Pemex) is used as
◼ Lithology: Coarse Grained Sands analogous
◼ 1Q19 net production: 0.2 Mboe/d(1)
C ◼ State: Veracruz Jaguar ◼ Quick production with workovers in existing
◼ Net area: 8,944 acres(1) wells and new drilling in Abra, Tamabra and
San Andrés formations
◼ Fluid: Oil
◼ Exploration potential in underexploited,
TM-01 ◼ Fields: 3 shallower sandstone reservoirs
◼ 3D Seismic coverage ◼ Upside through EOR implementation and
◼ Wells Drilled: 40 facilities upgrades
◼ Lithology: Reef limestone
34
(1) At Vista’s 50% working interest.You can also read