Investor & Analyst Presentation - 27 September 2019 - M&G Investments
←
→
Page content transcription
If your browser does not render page correctly, please read the page content below

Investor & Analyst
Presentation
27 September 2019

                     1
M&G plc Investor & Analyst Presentation
Disclaimer
This presentation is made by M&G plc (“M&G”). For the purposes of this notice, ‘presentation’ shall mean and include the document that follows and any oral presentation, any question-and-answer session
and any other written or oral material delivered or distributed by M&G in connection with it.

This presentation is for informational purposes only and does not constitute a prospectus or offering memorandum or an offer or solicitation in respect of any securities and is not intended to provide the basis
for any evaluation of any securities of M&G and should not be considered as a recommendation that any person should purchase any such securities in any jurisdiction. The shares of M&G have not been, and
will not be, registered under the US Securities Act of 1933 (the “US Securities Act”) or under the securities laws of any state or other jurisdiction of the United States and may not be offered or sold within the
United States, except pursuant to an applicable exemption from, or in a transaction not subject to, the registration requirements of the US Securities Act and in compliance with any applicable securities laws of
any state or other jurisdiction of the United States. There will be no public offering of the shares in M&G in the United States for the purposes of the US Securities Act.

No representations or warranties, express or implied are given in, or in respect of, the presentation. In no circumstances, to the fullest extent permitted by law, will M&G or any of its subsidiaries, shareholders,
affiliates, representatives, partners, directors, officers, employees, advisers or agents, or any other person be responsible or liable for any direct, indirect or consequential loss or loss of profit arising from the
use of the presentation, its contents, or its omissions, or reliance on the information contained herein or on opinions communicated in relation thereto or otherwise arising in connection therewith.

This presentation may contain certain statements relating to the future, including forward-looking statements relating to M&G’s financial position and strategy. In some cases, these forward-looking
statements can be identified by the use of forward-looking terminology, including the terms ‘intend’, ‘aim’, ‘project’, ‘anticipate’, ‘estimate’, ‘plan’, ‘believe’, ‘expect’, ‘may’, ‘should’, ‘will’, ‘continue’ or other
similar words. These statements discuss future expectations concerning M&G’s results of operations or financial condition, or provide other forward-looking statements.

These forward-looking statements are not guarantees or predictions of future performance, and involve known and unknown risks, uncertainties and other factors, many of which are beyond M&G’s control,
and which may cause the actual results to differ materially from those expressed in the statements contained in this presentation. M&G’s actual results of operations, financial condition and the development
of the business sectors in which M&G operates may differ materially from those suggested by the forward-looking statements contained in this presentation due to certain factors including, but not limited to,
domestic and global economic and business conditions, market-related risks pertaining to the financial services industry as a whole, the policies and actions of regulatory authorities, market developments
regarding financial services products, the impact of competition, technological development, inflation, deflation, the timing, impact and other uncertainties of any future acquisitions, combinations or
divestments within relevant industries, as well as the impact of tax and other legislation and other regulations in the jurisdictions in which M&G operates. In addition, even if M&G’s actual results of
operations, financial condition and the development of the business sectors in which it operates are consistent with the forward-looking statements contained in this presentation, those results or
developments may not be indicative of results or developments in subsequent periods. Recipients of this presentation are cautioned not to put undue reliance on forward-looking statements.

Any forward looking-statements contained in this presentation speak only as of the date on which they are made. M&G expressly disclaims any obligation to update any of the forward-looking statements
contained in this presentation or any other forward-looking statements it may make, whether as a result of future events, new information or otherwise except as required pursuant to applicable laws and
regulations.

Note: Throughout this presentation totals in tables and charts might not sum as a result of rounding

                                                                                                                                                                                                                              2
Agenda

 Session                              Time          Presenter

 Business overview and strategy   10.00 - 10.30     John Foley

 Finance and capital management   10.30 - 11.15   Clare Bousfield

 Coffee break                     11.15 - 11.30

 Q&A                              11.30 - 12.15   John and Clare

 Lunch                            12.15 - 13.30

                                                                    3
Business overview
and strategy
John Foley – Chief Executive

                               4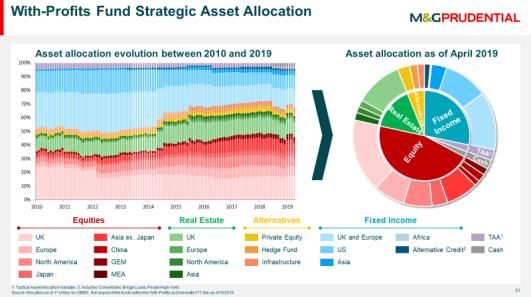
What we will cover today
How we create value for shareholders

 1    Recap on
     our business
                    2competitive
                          Sources of
                                 advantage
                                                      3       Growth
                                                            opportunities
                                                                                   4   Attractive
                                                                                       financials

                                                      Our principles for growth

                                                        1      Disciplined

                                                        2
                        Depth of        Scale of
                      investment     Private Assets            Capital-efficient
                      capabilities     franchise

                                                        3      Profitable

                     Uniqueness of
                       PruFund
                        offering
                                       Reach of
                                     distribution
                                      footprint
                                                        4      Responsible

                                                                                                    5
1. Recap on our business

                           6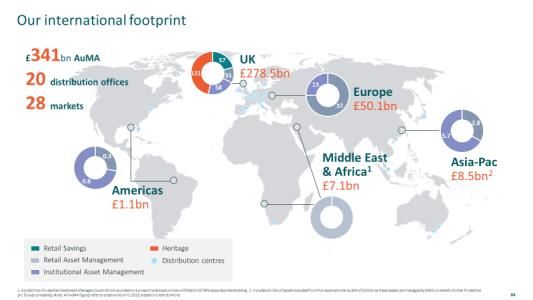
Who we are
A unique business mix
                                                    an Asset Manager and Asset Owner…
                                                  … focused on delivering great customer outcomes
                                                                                                             CARE
                                                      through active, high-value added solutions

              Our History                            Customers                Geographies            AuMA1

        2017                                    c. 5.5 million            20 distribution           £341bn
                                                retail customers          offices…                   (H1 2019)
        1931                                                                     …serving 28
                                                more than 800
        1848                                    institutional clients                markets

1. Assets under Management and Administration
                                                                                                                    7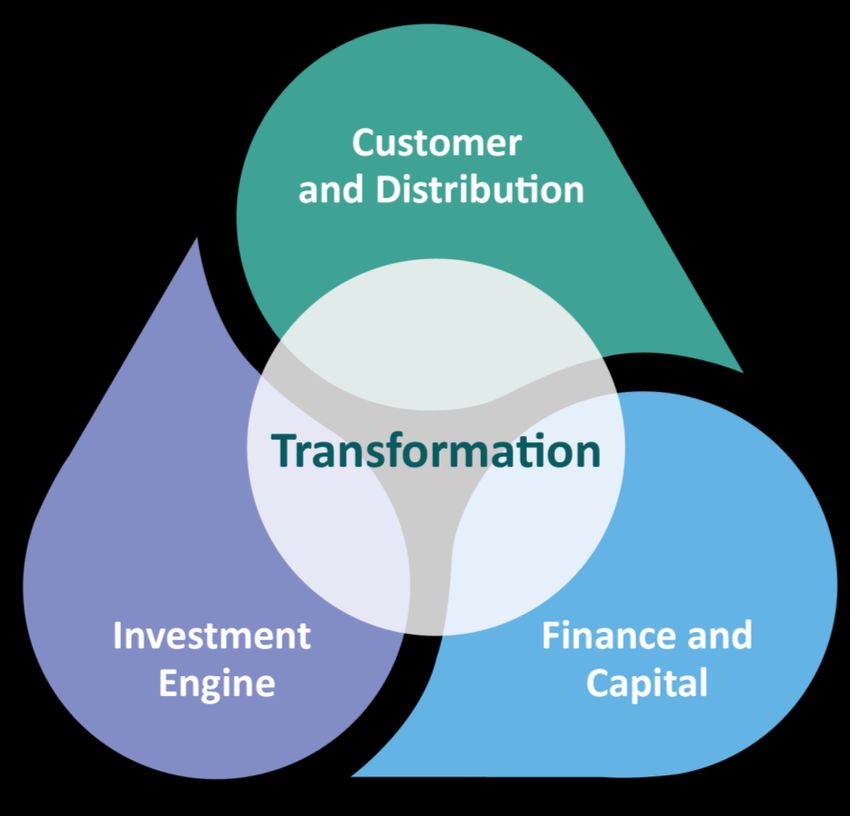
What drives our business

                           Managed for profitable growth                                                  Savings & Asset                                            Heritage                                Managed for capital and efficiency
                              Sustainable value creation
                                                                                                           Management                                                                                        Sticky assets, earnings and cashflows
                              Includes all open products                                                             £210bn                                             £131bn                               Closed to new customers

   Unique proposition expanding beyond PruFund
                                                                                                              Retail Savings                                       Traditional                               Integral to the WPF3 providing investment scale
  Continued strong inflows despite volatile market
                                                                                                             (incl. PruFund)1                                      With-Profits                              Stable earnings contribution for 10+ years4
          Embedded growth of PruFund earnings

                                                                                                                                   With-Profits Fund

      Comprehensive offering in active asset mgmt.                                                                                                                                                           Stable earnings and capital generation
                                                                                                               Retail Asset                                        Shareholder
      Established track record of product innovation                                                                                                                                                         Potential upside from management actions
                                                                                                               Management                                           Annuities
                       Playing at scale across Europe                                                                                                                                                        Financial play providing strategic optionality

          Leading solutions and private assets offering                                                                                                              Corporate
                                                                                                           Institutional                                                                                     Mostly unit-linked products
            Diversified capabilities built over 20+ years                                                                                                            Pensions
                                                                                                        Asset Management                                                                                     Closed to new schemes but open for top-ups
            Attractive and resilient management fees2                                                                                                                and Other

1. Includes a small amount, £4bn, of non With-Profits AuMA; 2. Performance fees account for a minimal part of Institutional Asset Management income (£15m in FY 2018); 3. With -Profits Fund; 4. Assuming normal financial market development and policyholder behaviour
Note: All AuMA figures refer to position as of H1 2019                                                                                                                                                                                                                     8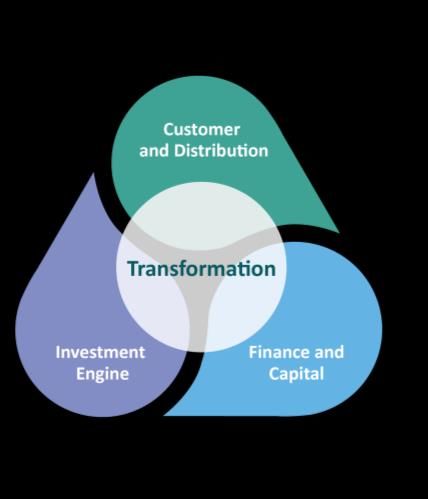
M&G plc at a glance
Our investment case

• Leading house offering deep                                                                                            • Unique PruFund offering with fast
  expertise in high-value added                                                                                            growing asset base (£50bn H1 2019)
  solutions with resilient margins                                                                                       • One of UK and Europe’s strongest
• World class Private Asset                                                                                                brands for institutional asset mgmt.
  franchise with £60bn AuM and an                                                                                        • Leading retail cross-border player in
  attractive fee model1                                                                                                    Europe with £37bn AuM
• UK’s largest With-Profits Fund
  (£144bn with £11bn Own Funds)                                                                                          • Expanding international network of 20
                                                                                                                           distribution offices serving 28 markets

                                                                                                                             • Diversified sources of
                                                                                                                               earnings
                                                                                                                             • Capital-efficient growth
                                                                                                                               opportunities
                                                                                                                             • Strong cash generation over
                                                                                                                               the long-term
1. Fee income is mostly management fees; performance fees account for a minimal proportion of income (£15m in FY 2018)
Note: All AuMA figures refer to position as of H1 2019                                                                                                               9
Why the total is greater than the sum of the parts
Developing high-value added solutions as Asset Owner and Asset Manager

• Provide scale to our asset                    • Understand the needs of
  management operations                           complex institutional clients
• Rapidly deploy seed funding                   • Develop unique new
  in innovative investment solutions              propositions
• Adopt a truly long-term                       • Co-invest with clients thus
  investment perspective                          aligning incentives

                                                    • Differentiated capabilities
                                                      underpinning sustainable growth
                                                    • More resilient earnings
                                                      with long-term stable cashflows
                                                    • Upside potential from
                                                      capital optimisation actions
                                                                                        10
2. Sources of competitive advantage
11What differentiates us Sources of competitive advantage Depth of investment Scale of Private Uniqueness of Reach of distribution capabilities Assets franchise PruFund offering footprint Specialist coverage in One of the world’s largest Part of our £144bn With- Established international high-value added areas of private asset investors; Profits Fund, one of UK’s network of 20 distribution active mgmt., e.g. £140bn in 36% AuM increase since largest with an enviable offices, with new openings multi-asset solutions1 2015 (to £60bn) performance track record in US and Australia See appendix for more details 1. Of which £124bn through Prudential UK & Europe Strategic Asset Allocation and £16bn through 3rd party assets Note: All AuMA figures refer to position as of H1 2019 12
How we generate value for our customers and shareholders
Competitive advantages at play

  Depth of investment                             Scale of Private             Uniqueness of                  Reach of
  capabilities                                    Assets franchise             PruFund offering               distribution footprint
  • Enables in-house                              • Empowers us to invest      • Acts as an anchor for our    • Opens up international
    implementation of                               rapidly and at scale to      broader offering in Retail     markets to pursue
    the WPF SAA1 retaining                          take advantage of market     Asset Management,              organic growth
    value for shareholders                          opportunities                e.g. PruFolio                  opportunities
  • Caters to retail and                          • Gives us access to 3rd     • Provides superior            • Provides comprehensive
    institutional customer                          party sticky assets and      outcomes to retail             coverage of the UK and
    needs through a wide                            resilient margins            customers                      Europe to offer our
    range of solutions                                                                                          products to retail and
                                                  • Powers PruFund             • Generates long-term
                                                                                                                institutional customers
  • Supports continuous                             performance and our          value and earnings for
    product innovation                              institutional solutions      shareholders
                                                  • Underpins significant
                                                    portion of annuity book
1. With-Profits Fund Strategic Asset Allocation
                                                                                                                                          13
How we will be known
A new corporate identity and two strong market brands
One Corporate Identity Two Market Brands
Region:
Europe
Global
South Africa
Audience: • Direct consumer • Intermediated consumer
• Intermediated consumer • Wholesalers
• Introducer • Institutional clients
143. Growth opportunities
15Established track record
Key drivers of growth over the past 10 years
All charts show AuMA in £bn
PruFund International Retail Institutional
Asset Management Asset Management1 74 74
71
64
53 55 55
50 50 51
43 44 46
41
38
36 36 35
33 32 30
25 24
21 23 22
17 17
12 11
8 9
3 4 5
1
2008 2010 2013 2016 H1 2008 2010 2013 2016 H1 2008 2010 2013 2016 H1
2019 2019 2019
1. “PPL GILP” has been reclassified from Institutional to UK Retail from 2015 onwards
16Our principles and focus
Sustainable growth
Supportive Trends Our principles for growth Our Focus
Disciplined
1
Multi- Develop investment solutions
leveraging our assets tailored to client needs
Investment
Ageing
core competencies
Engine
population
globally Private Expand sourcing capacity
Assets leveraging existing expertise
Widening
2 Capital-efficient
for shareholders Public Strengthen capabilities in high-
Assets value added areas for active mgmt.
savings gap
Profitable
3 no ‘loss-leader’
Customer and
Distribution
approach Retail Broaden and
€10tn+ of customers digitise proposition
cash in Responsible
Europe
4 Aligned with our
core value of care
Institutional
clients
Expand partnership model
across and outside Europe
See July 2019 presentation
17Investment Engine
Building capabilities in high-value added areas of the market
Multi-Asset Manager of one of Europe’s largest multi-asset funds (our With-Profits Fund)
Our priority: Leverage in-house asset allocation, private and public asset capabilities to
£140bn address client needs through outcome-oriented investment solutions
Private Assets £60bn Public Assets £217bn
One of the world’s largest Private Asset An established active manager
managers, with sourcing mostly in the UK and Europe with critical scale across major Public Asset classes
Our priority: Expand sourcing capacity internationally Our priority: Strengthen capabilities in asset classes and
strengthening existing areas of expertise regions where we can provide value as an active manager
• Continued focus on expanding presence in the US syndicated • Enhanced Emerging Market Equity expertise acquiring a 7-strong
loans market building on success in Europe Asia specialist team through lift-out in September 2019
• Enhancing Private Debt capabilities; targeting a c. 33% increase • Strengthening Emerging Market Debt team to broaden
in origination and analyst staff over the medium term proposition and capitalise on existing strong track record
• Relocating and hiring investment staff in the US and Asia • Ongoing development of systematic and thematic equity product
offering; fund launches in 2017 and 2018 with further planned
• Broadening Real Estate offering into higher risk-return strategies
Already launched a number of funds within Private, Public and Multi-Asset
ESG Our priority: Develop a consistent and comprehensive approach to ESG across asset classes
Note: All AuMA figures refer to position as of H1 2019
18Customer and Distribution
Expanding our proposition at home and internationally
UK retail customers Institutional clients
An established player with a unique offering, including One of the most highly regarded institutional
both with-profits and asset management products asset managers in Europe and one of the market
leaders in the UK
Our priority: Broaden and digitise proposition
• Improving tied agents’ productivity through technology upgrades Our priority: Expand our proven client partnership
• Investing to enhance customer and advisor experience
model to key institutions across and outside Europe
• Leveraging PruFund as an anchor to broaden retail proposition; • Strengthening local distribution coverage in key institutional
launched PruFolio and M&G OEICs on own platform in H1 2019 markets; e.g. hires in the US and Asia
• Adding dedicated solutions specialist resources to capitalise on
International retail customers the need of European insurance companies to outsource
investment management post Solvency II
A leading European cross-border manager • Leverage the expanding ‘Investment Engine’ capabilities to
broaden institutional investment proposition and tailor it to the
Our priority: Leverage existing local presence and needs of global clients
relationship with global banks to extend distribution reach
• Combine existing asset management and insurance expertise to
• Capitalising on sub-advisory market growth establish M&G as a leading CDI provider in a maturing UK Defined
Benefit market
• Significant wins in southern Europe
• Ongoing project to distribute PruFund outside the UK
Leverage international retail distribution footprint to cross-sell institutional products and vice versa
e.g. Italy has traditionally been a retail market for M&G but has added £0.5bn institutional AuM in 2017 and 2018
19Transformation
A fundamental enabler across all areas of our business
Savings & Asset Management Heritage
• Create a multi-channel, multi-wrapper, digital • Improve customer outcomes
environment broadening our existing through a fundamental transformation of our
customer proposition operational environment
• Lead market on experiential innovation, to • Simplify IT and systems landscape to reduce
offer superior critical customer outcomes cost to serve and change (includes reduction
(e.g. vulnerability and advice), on top of from 14 policy administration systems to just
traditional ones (e.g. price) one)
• Deliver a simplified and scalable distribution • Variabilise cost base to maintain profitability as
and investment model to improve efficiency book runs-off through the outsourcing deal with
and lower marginal costs to serve TCS1 / Diligenta
Do the right thing for customers while strengthening controls and reducing ongoing change cost
1. Tata Consultancy Services
204. Attractive financials
21Rewarding our shareholders
Capital generation underpins attractive dividend
Business target Dividend policy
Expectations for ordinary dividends:
3-year cumulative
capital generation1
1 Stable or increasing
in absolute terms over time
2020-22
2 Two dividend payments per year
interim dividend being 1/3 of the previous full year
mid-point
target2
£2.2bnAfter debt financing
3 2019 final ordinary dividend of £310m3
implying an “as-if” full year ordinary dividend of c. £465m3,4
costs, other Corporate
Centre costs and tax
4 To develop broadly in line with capital
generation over the longer term
1. Total change in Solvency II surplus before capital movements and dividends; 2. Provisional target subject to further consideration by the Remuneration Committee of appropriate 2020 incentive plan targets at year-end 2019; 3. Subject to the Company’s financial performance and overall financial position remaining in line with expectations;
4. M&G plc expects3 to declare a one-off demerger related dividend of £100m in recognition that, for the majority of 2019, it was operating without incurring certain costs, e.g. debt interest costs, which it would expect to bear in future and which have been allowed for in determining the initial level of ordinary dividend 22Target and compensation
Aligning remuneration with shareholders interests
Business target Executive Directors’ Compensation3
30% Non-financial
• Customer
70% Financial
Annual Bonus
3-year cumulative • Strategic
30% Capital
• People generation
capital generation1 • Diversity
20% 20%
With-Profits
2020-22 Pre-tax
£2.2bn
measure 4 operating profits
mid-point
Total
target2 After debt financing Shareholder 40%
LTIP
costs, other Corporate Returns Capital
Centre costs and tax 60%
generation
1. Total change in Solvency II surplus before capital movements and dividends; 2. Provisional target subject to further consideration by the Remuneration Committee of appropriate 2020 incentive plan targets at year-end 2019;
3. Both Annual Bonus and LTIP are subject to potential uncapped downward Risk Adjustments; 4. Includes With -Profits Fund investment performance and expense measures 23Key messages
1 Unique and compelling business mix being both an Asset Manager and an Asset Owner
2 Differentiated and high-value added savings & investments solutions to address customers’ needs
3 Proven track record for growing new franchises, at home and internationally
4 Well positioned to capture opportunities from demographic shifts and the search for yield
5 Attractive total return profile with capital discipline and profitable growth
24Finance and
capital management
Clare Bousfield – Chief Financial Officer
25What we will cover today
From earnings to dividends
1 Review of
H1 2019 results
2 PruFund
deep-dive
3 capital
Capital and
generation
4 mgmt.Financial
framework
Adjusted Operating Profit split (H1 2019) 1
Day 1
1 balance sheet Financial
strength and
Attractive
dividends
S/H flexibility
Asset
Capital generation
Annuities
& Other
Management
2 framework
With Invest in the Return of
profits business excess capital
Review of
3 key drivers
1. Total Adjusted Operating Profit before corporate centre expenses. Mix excludes £127m longevity assumption change from annu ity book
261. Review of H1 2019 results
27H1 2019 Results summary
Adjusted Pro forma Group
AuMA Operating Profit Solvency II ratio
£341bn £715m 170%
• Up 6% from FY 2018 driven by strong • Down from £772m in H1 2018 • Position at 30 June 2019 on the basis
market performance of £3.2bn subordinated debt
• Savings & Asset Management £34m
substitution
• PruFund AuMA up 15% to almost lower, due to lower asset
£50bn management fee income
• Headwinds remain in Retail Asset • Continued strong profitability
Management flows of Heritage
• Corporate centre cost up £14m,
increasing as expected ahead of listing
• Transformation programme on-track
28Our profit drivers
What underpins the earnings of each segment
Segments Sources of Key operating Adjusted Operating
earnings profit drivers Profit split (H1 2019)1
Asset Management Fees minus
(Institutional and Retail) expenses
Savings & Asset With-Profits Shareholder transfers,
Management (PruFund) net of hedging
S/H
Asset
Result of Annuities
Other Management
other business & Other
With
With-Profits Shareholder transfers, profits
(Traditional) net of hedging
Heritage
Asset returns, longevity
Shareholder
experience, results of
Annuities & Other
other businesses
1. Total Adjusted Operating Profit before corporate centre expenses. Mix excludes £127m longevity assumption change from annu ity book
29Net client flows and AuMA
Net client flows £bn Movement in AuMA £bn
4.1
1.4 24 341
2.1 321
(4.5) Institutional (1) (3) 74
Asset Mgmt.
71
4.3 Retail Savings
3.2
Retail Asset 79
76
Mgmt.
(3.7) (3.1) Heritage
o/w 57
Retail Savings 51 o/w
PruFund:
Other Heritage 14 PruFund: 15
(3.8) Retail Asset Mgmt. £50bn 26
S/H Annuities 25 £43bn
(0.8) Institutional Asset Mgmt.
Traditional WP 85 91
H1 2018 H1 2019 AuMA at FY Net flows - Net flows - Market & AuMA at H1
2018 S&AM Heritage other 2019
movements
30Adjusted Operating Profit by source
H1 2018 H1 2019
YoY%
£m £m
Asset Management 265 216 (18)%
Savings & Asset
Management
With-Profits (PruFund1) 23 29 +26%
Other 8 17 +113%
Total Savings & Asset Management 296 262 (11)%
With-Profits 91 97 +7%
Heritage
Shareholder Annuities & Other 392 377 (4)%
Total Heritage 483 474 (2)%
Corporate centre (7) (21)
Total Adjusted Operating Profit 772 715 (7)%
1. Includes a small amount of PruFund predecessor unitised With-Profits contracts
31Sources of earnings
Asset Management
Savings & Asset Management
AuM (£bn) Profitability1 (£m) Key ratios
Average fee margin
(bps of average AuM incl. internal2)
Adj. Op. Profit
Adj. Op. Profit
39 39
265
216
120
118 124
Revenue
H1 2018 H1 2019
Revenue
563
514
90 Cost / Income ratio (%)
Expenses
Expenses
76 79
298
298
54 57
76 71 74
H1 2018 FY 2018 H1 2019 H1 2018 H1 2019 H1 2018 H1 2019
Institutional Retail Internal
1 Adjusted Operating Profit, excluding share of associate’s profit and investment income; 2 Fee margin calculated as fee based Adjusted Operating Income, excluding performance fees, over monthly average AuM. Performance fees were H1 2018: £8m; H1 2019: £7m
32Sources of earnings
Institutional Asset Management
Savings & Asset Management
Assets Fees Key points
3rd party Institutional net client flows (in £bn) Institutional Asset Mgmt. average fees (in bps)2 • Flows are less volatile than
6.6 retail due to long duration,
4.1
1.2 liability-linked mandates
(6.5) 1 (0.8) • Tenure is typically 7+ years vs.
2-3 years for retail customers
3rd party Institutional AuM (in £bn)
26 • 3rd party clients predominantly
25
74 74 22 22 UK-centric but ongoing
71 international expansion to
64
support growth
• Resilient fees underpinned by
gradual shift of product mix
towards high-value added
solutions and private assets
2016 2017 2018 2019 H1 2016 2017 2018 2019 H1
1. Outflow of one particular £6.5bn low-margin Institutional mandate as referred to in Prudential plc’s Full Year 2018 results; 2. Includes fees on Prudential Assurance Company internal assets managed by M&G
33Sources of earnings
Retail Asset Management
Savings & Asset Management
Assets Fees Key points
3rd party Retail net client flows (in £bn) Retail Asset Mgmt. average fees (in bps)1 • Negative flow picture in 2018
10.8 and 2019 due to challenging
macroeconomic environment
(3.8) 62 63 and retail investor confidence
(9.3) (7.5) 60 58
• Current focus on building
3rd party Retail AuM (in £bn) sub-advisory offering expected
to generate flows into stickier
90 mandates over time
73 76 79 • Fee pressure expected to
continue over the medium-term
• Gradual shift towards solutions
and multi-assets to partially
counterbalance this pressure
2016 2017 2018 2019 H1 2016 2017 2018 2019 H1
1. Includes fees on Prudential Assurance Company internal assets managed by M&G
34Sources of earnings
With-Profits / PruFund
Savings & Asset Management
PruFund AuMA (£bn) Adjusted Operating Profit (£m)1 Key Developments
H1 18 H1 19 • AuMA up 15% over first six
Inflow 6.0 5.5 36 months of 2019
Outflow (1.6) (2.0)
Net 4.4 3.5
32 • Net inflows 8%2 of opening
29 AuMA
3.1 49.6
3.5 23 (7) − Gross inflows remain
43.0
(9) strong at £5.5bn, though
slightly lower YoY due to
lower DB transfer activity
− Gross outflows continue to
increase moderately as
expected, as book matures
• Adjusted Operating Profit up
Shareholder
Shareholder
Op. Profit
Op. Profit
Hedge
Hedge
Adjusted
Adjusted
result
result
FY 2018 Net client Market & H1 2019
Transfer
Transfer
flow Other
26% with shareholder transfers
continuing to grow
H1 2018 H1 2019
1. Shareholder Transfer includes PruFund and a small amount of PruFund predecessor unitised With-Profits contracts; 2. Not annualised
35Sources of earnings
Traditional With-Profits
Heritage
Traditional WP AuMA (£bn) Adjusted Operating Profit (£m) Key Developments
• AuMA up 7% over first six
125 124 months of 2019, driven by strong
market performance
8.4 90.6 97 • Net client flow remains broadly
84.6 91
(27) stable YoY
(2.4) (34)
• Adjusted Operating Profit up 7%
due to improved hedge result;
pre-hedge shareholder transfers
stable as expected
Shareholder
Shareholder
Op. Profit
Op. Profit
Hedge
Hedge
Adjusted
Adjusted
result
result
FY 2018 Net client Market & H1 2019
Transfer
Transfer
flow Other
H1 2018 H1 2019
36Sources of earnings
Shareholder Annuities & Other
Heritage
Adjusted Operating H1 2018 H1 2019 Nature of earnings
Profit (£m) £392m £377m
Investment income from assets not backing
Return on excess assets
111 118 insurance liabilities and gradual release of
& margin release prudence in actuarial assumptions
Lower discounted annuity liabilities due to
Asset trading
92 63 trading into higher yielding assets and
& other optimisation optimising asset allocation
Longevity Change in mortality expectations for
127
assumption changes annuity customers
TRASP1 One-off indemnity insurance recovery for
166
insurance recovery Thematic Review of Annuity Sales Practices
Results of other activities
Other 23 69
(c. £50m positive one-offs in H1 2019)
1. Thematic Review of Annuity Sales Practices
37Sources of earnings – Expected development1
Key drivers of Adjusted Operating Profit
Savings & Asset Management
Asset Management With-Profits Other
• AuM & Flows: Market conditions difficult near term. Focused on • Shareholder transfers continue • Result from minor other
medium-term growth initiatives to rise as PruFund AuMA grow businesses (including Prudential
• Average fee margin: Pressure across industry especially on retail, and the book matures international branches) and
mitigated by focus on value-added solutions • Hedge result to remain a net service companies
• Costs: Beneficial impact of transformation; expected investment in cost under normal market • Expected to remain small in
growth initiatives dependent on market conditions conditions (actual outcome Group context
depends on market movements)
Heritage
With-Profits Shareholder Annuities & other
• Shareholder transfers expected to remain at around current levels • Return on excess assets and margin release expected to decline gradually
on average for medium term over the long-term as book runs off. Low double-digit £m reduction
• Hedge result to remain a net cost under normal market conditions expected in 2020 due to payment of dividend up to M&G plc at end 2019
(actual outcome depends on market movements) • Annuity asset trading expected to remain positive, but at lower levels than
previous years after bedding-down of Solvency II
• Longevity remains uncertain: Prudent approach with continued focus on
mortality trends; CMI17 already adopted at H1 stage for FY 2019
Corporate centre
Head office expense Debt interest cost
• Expected to be in the range of £80-100m p.a. • Coupons on post-demerger debt of £3.2bn amount to c. £190m 2 p.a.
1. Assumes no abnormal developments in financial markets, major regulatory changes, or other unexpected external developments; 2. Based on USD / GBP exchange rate as of the 30 of June 2019
38Continued With-Profits Transfer growth expected
Illustrative With-Profits Shareholder Transfer1 before tax
(£m)
600
Shareholder transfers from future new PruFund
NB Scenario 3 business, shown in 3 different scenarios2:
• Scenario 1: New business volume of £5bn p.a.
NB Scenario 2
400
• Scenario 2: New business volume of £10bn p.a.
NB Scenario 1
• Scenario 3: New business volume of £15bn p.a.
PruFund In-force book
200
Traditional WP In-force book
0
2020 2021 2022 2023 2024 2025 2026 2027 2028 2029 2030
1. Based on economic conditions at 30 June 2019, and assuming actual investment returns as per Expected Growth Rates (EGRs) in force at that date; 2. Alternative new business volume scenarios apply from 2020 onwards
39Mortality trends
CMI Q2 2019 update
Cumulative annual standardised mortality improvements
(%)
4.9% 4.8%
3.5% 3.4% 3.1%
1.9%
0.3% 0.1% 0.0%
2009 2010 2011 2012 2013 2014 2015 2016 2017 2018 H1-2019
(1.0)%
(3.8)%
Source: Institute and Faculty of Actuaries, Continuous Mortality Investigation Q2 2019 update
402. PruFund deep-dive
41Before we move onto the details
What is PruFund
For customers For the With-Profits Fund For Shareholders
A savings product similar to A proposition priced to recover the Strategically
traditional mutual funds… costs the With-Profits Fund
• Unique proposition
expects to incur:
• Multi-asset
• Element of differentiated growth
• Distribution and Admin expenses
• Daily unit price
• Anchor for our broader offering
• Investment management
• With a clear annual charge
• Smoothing and holding account Financially
… but with characteristics that
• Shareholder Transfer • Growing source of earnings
make it stand out from the crowd
(£54m in 2018, £29m in H1 2019)
• Low volatility Deviations from expectations are
• Store of value with back-end
absorbed by the With-Profits
• Smoothed returns loaded profit signature
estate
• Strong performance track record • Capital-efficient proposition
42Intro to PruFund
A unique proposition
What we covered in July To warm us up
Breadth and diversification of Historical performance
our With-Profits Fund SAA 1 and returns
…and what we will cover today
1 Functioning of the PruFund from a customer perspective
2 Role of the With-Profits Fund
3 Financial impact on shareholder earnings and balance sheet
1. Strategic Asset Allocation
43Customer perspective
PruFund components and investment returns
Flexible components Resulting features Investment returns
Three key choices for customers Determined by customer choices
1
customers’ funds
Accrue daily to
Wrapper Retirement On / Off- EGR
Pensions 2 ISA
type account1 shore bond
Expected Growth
Rate (EGR)
2 Risk PruFund PruFund PruFolio
PruFolio range
Set quarterly based on
expected long-term returns4
Annual Charges
Cautious Growth range
includes 5 different
profile levels of risk appetite
Applied based on
smoothing rules
Upward unit price
adjustments
3 Guarantee Without With
Annual Charges
Includes Fund, Wrapper, Downward unit price
option guarantee guarantee3 and Guarantee fees5 adjustments
1. Including Income Drawdown; 2. Flexible Retirement Plan and Trustee Investment Plan; 3. Less than 1% of new customers in the 18 months to June 2019 have selected guarantee option;
4. Having regard to the investment returns expected to be earned on the assets of the funds over the long-term (15 years); 5. The Annual Charges cover, amongst other things, the expected cost of Shareholder Transfers 44Customer perspective
Smoothing mechanism and Unit Price Adjustments 1 in theory
In theory 1 The smoothed unit
price increases each
Illustrative example day in line with the
EGR less Charges
2 Unsmoothed unit price is
below (above) the lower
(upper) smoothing limit
4 When exiting PruFund, the
difference between the
Smoothed unit price Smoothed and Unsmoothed
Price accrues to the With-
Unsmoothed unit price2 3 Smoothed unit price Profits Fund Estate
is adjusted to narrow
the gap
Upper smoothing limit
Lower smoothing limit
1. Smoothing mechanism can be temporarily suspended in exceptional circumstances to protect the With -Profits Fund; if it is suspended, the smoothed unit price of the affected fund is set equal to the unsmoothed price
2. The unsmoothed price increases or decreases each day in line with the performance for the underlying assets in the With -Profits Fund less the pro-rated Annual Charges 45Customer perspective
Smoothing mechanism and Unit Price Adjustments 1 in practice
Upward unit price
adjustment
In practice 92%
PruFund Growth actual returns
from inception to H1 2019
The combination of EGR and
Annual Charges2 defines the
slope of the curve
55%
45%
18%
PruFund Growth Fund
UK RPI Cumulative Rate
ABI Mixed Investment 20-60% shares
Sequence of downward
Cash SONIA Cumulative Rate
unit price adjustments
following the GFC3
1. Smoothing mechanism can be temporarily suspended in exceptional circumstances to protect the With -Profits Fund; if it is suspended, the smoothed unit price of the affected fund is set equal to the unsmoothed price
2. Charges refer to any charge allowed for in the unit pricing. Note that some charges may be taken by unit cancellation depending on product wrapper; 3. Global Financial Crisis 46From a customer to the With-Profits Fund perspective
Withdrawals and the Shareholder Transfer (SHT)
Single withdrawal With-Profits income and expenses6
Customer withdrawing 100% of funds in year 10
With-Profits surplus7
Net investment returns
of £480 by year 10
PruFund fees Shareholder Transfer
Shareholders Paid by the With-Profits Fund
receive a transfer upon customer withdrawal
120 from the WPF2
of 480 / 9 = c. £53
600
480 Distribution and
Wrapper fees Admin costs
Annual Charges are paid
Investment
to the With-Profits Fund management costs
1,000 and include the cost of 1,000 Guarantee fees
the SHT1 (if any, not included Smoothing and
in this example) holding account
Initial Assumed gross Assumed Withdrawal at With-Profits With-Profits
investment returns 3 charges 4 year-10 Income Expenses
1. Shareholder Transfer; 2. With-Profits Fund; 3. Based on 5% Expected Growth Rate and assuming no Unit Price Adjustments; 4. Based on 1% Annual Charge (including both fund and wrapper fees); 5. For simplicity, the charts assume EGR of 5% and Annual Charges of 1% remaining unaltered over the
entirety of the holding period with no Unit Price Adjustments; 6. With-Profits income and expenses shown on a present value basis; 7. This could be a surplus or deficit depending on how actual experience compares to that used in pricing new business, which is effected in accordance with FCA requirements 47Shareholder perspective
The Present Value of the Shareholder Transfer
Customer withdrawals Shareholder transfer Present value
Illustrative1 £10bn cohort and expected churn Transfer is 1/9 of the net investment return Present value of Shareholder Transfer (PVST)
Payment to customers over 30 years (in £bn) SHT2 based on expected returns (in £m)
100 Same shape of inv.
1.0 ∑ of investment ∑ of undiscounted
returns c. £7.5bn 6%
returns paid to
customers but 1/9 expected SHT PVST based on expected
∑ of principal paid 50
of magnitude c. £830m returns and discount rate4:
0.8
back c. £10.0bn 5%
0
c. £340m
0.6 4%
SHT2 based on risk-free3 returns (in £m)
3%
0.4 100
∑ of undiscounted
2% Assumes risk-free SHT PVST recognised under
customers only
0.2 50 earn risk-free c. £75m Solvency II on Day-13:
1% rate
0.0 0% 0
c. £55m
Principal Net inv. Yearly exit as % of
investment returns original cohort (RHS)
1. For simplicity, the charts assume EGR of 5% and Annual Charges of 1% remaining unaltered over the entirety of the holding period with no Unit Price Adjustments;
2. Shareholder Transfer; 3. Assumes risk-free rate of 1.5%; 4. Assumes 5% discount rate 48Shareholder perspective
Solvency II impact
Capital requirement turning into surplus Development over time
SCR generated by PVST2 is based on a 1/200 shock to PruFund’s assets Year-on-year movements in the balance sheet
PruFund impact on Shareholder balance sheet assuming a £10bn cohort 1 (in £m) Own funds
Unwind of the Always Positive (as long as
800
Day-1 SCR
assumed at
1 discount rate discount rates are not negative)
c. 1.8% of flows3
Realisation of Positive but only if real returns
600 New business
capital strain turns 2 ‘real’ returns are greater than risk-free
into surplus4
400
Payment of SHT PVST2 becomes cash on the
200 3 to shareholders balance sheet
0
Solvency Capital Requirement
(200)
Exposure to SCR changes as PVST2 and / or
PVST2
Cash paid to SCR generated Balance of
4 market risk asset allocation move over time
shareholders by PVST3 PVST and SCR4,5
1. For simplicity, the charts assume EGR of 5% and Annual Charges of 1% remaining unaltered over the entirety of the holding period with no Unit Price Adjustments; 2. Present Value of the Shareholder Transfer; 3. Day-1 SCR highly dependent on prevalent interest rates. Chart shown before the
impact of any hedging; 4. Balance of PVST and capital requirements highly dependent on prevalent interest rates and investment returns. Chart shown before the impact of any hedging; 5. Assumes Shareholders retain cash on balance sheet and do not pay it out 49PruFund mechanics
Summary
Customers With-Profits Fund Shareholders
• Invest initial saving and / or • Receives the actual investment • The PVST4 is recognised as an asset
retirement pot into the fund returns and accrues the Expected on the Solvency II balance sheet
Growth Rate to customers along with a related capital
• Investment grows in line with an requirement
EGR1 (reviewed on a quarterly basis) • Absorbs any positive or negative
difference between the Annual • The balance between the two
• Annual Charges, which cover the Charges and the expenses incurred elements evolves over time
expenses incurred by the WPF2, (which include the transfer paid to generating a surplus
including the cost of any Shareholder shareholders)
Transfer, are deducted from the • The Shareholder Transfer is paid by
investment • Pays the Shareholder Transfer at the With-Profits Fund when
point of customers’ withdrawal customers withdraw funds
• Downward / upward UPAs3 are
applied for significant market • The amount of the Shareholder
movements Transfer is equivalent to 1/9th of the
value created for the customer5
• Funds can be withdrawn in part
or in full when needed
1. Expected Growth Rate; 2. With-Profits Fund; 3. Unit Price Adjustments; 4. Present Value of the Shareholder Transfer;
5. In case the claim value is less than the initial premium, the shareholder transfer will be correspondingly negative for 1/9th of the loss 503. Capital and capital generation
51Pro forma M&G plc Group Solvency II1
• PAC represents the majority of the Group’s consolidated solvency capital position of 169% at 30 June 2019
• Shortly prior to demerger, M&G plc will assume £3.2bn of substitutable debt2 from Prudential plc, offset by a pre-demerger dividend
of £(3.2)bn3 and other closing adjustments of £0.1bn. Pro forma solvency ratio is 170%.
• Actual solvency ratio at demerger will depend on ongoing capital generation from the business, market movements and other
developments up until the demerger date
H1 2019, £bn
Pre-merger
M&G + M&G plc Assumption Pro forma
PAC dividend / closing
other subs Consolidated of debt Solvency II
adjustments3,4
Own Funds 8.9 0.5 9.5 3.2 (3.1) 9.6
SCR 5.2 0.4 5.6 - - 5.6
Solvency Ratio 173% 169% 170%
1. The Group has requested approval from the PRA to amend the Prudential Group internal model to apply at the level of the Group, rather than at the level of the Prudential Group. The decision is pending and is expected to be provided shortly before th e Demerger, such that the
Prudential Group internal model remains in place until the Demerger with the Group’s model commencing from that point; 2. At nominal value; 3. Includes £0.2bn paid on 20 of September 2019; 4. Not including £100m demerger related dividend expected to be paid in May 2020 52Pro forma M&G plc Group Solvency II
H1 2019, £bn 9.6
£3.2bn debt at
nominal value
£4.0bn surplus Own Funds
34% Solvency II
170% Solvency Ratio
Leverage Ratio1
6.9 5.6
Other Own Funds, including: 0.4 Sectoral (M&G)
£1.7bn TMTP2
£(2.3)bn risk margin
3.8 Shareholder Annuities & Other
Present Value of future
Shareholder Transfer (PVST) 2.7
from With-Profits Fund 1.4 Capital requirement on PVST3
Own Funds SCR
1. Calculated as nominal value of debt as % of total Group Own Funds; 2. Transitional Measures on Technical Provisions; 3. Net of hedging
53Capital generation framework
Expected IFRS Adj. Group Solvency II expected capital generation
Operating Profit Own Funds SCR
Fees Fees Change in
Asset Management - expenses - expenses capital requirement
Savings & Asset
Management
Retail Savings Shareholder Unwind of PVST1 asset Release from run-off4
(incl. PruFund) Transfer & other + new business value + addition from new business
Release from
Traditional WP Shareholder Transfer Unwind of PVST asset
run-off4
Heritage
Release of risk margin
Return on excess assets
Shareholder + release of prudency
+ income on surplus assets Release from
Annuities margins + credit margin earned on BEL 2 run-off
– run-off of TMTP3
1. Present Value of Shareholder Transfer; unwind of PVST based on real world returns; 2. Best Estimate Liabilities; 3. Tran sitional Measures on Technical Provisions;
4. SCR movements include impact from run-off of hedging programme on Shareholder Transfer which negatively affects capital generation 54Capital generation1
FY 2018 and H1 2019
FY 2018 movement H1 2019 movement
0.0 0.4
1.8 0.8
(0.1) (0.1)
(0.1)
(0.3)
(0.4) (1.1)
Own Funds 4.0 3.9
surplus
3.0 Total capital generation £1.5bn Total capital generation £0.9bn
Operating Dividends & Operating Dividends &
Economic Other Economic Other
£bn FY 20171 capital
variances movements
Tax capital FY 2018 capital
variances movements
Tax capital H1 2019
generation movements generation movements
Own Funds 9.1 1.6 (0.4) (0.1) (0.2) (0.4) 9.6 0.5 0.7 (0.1) (0.2) (1.1) 9.5
SCR 6.1 (0.2) (0.4) 0.0 0.1 - 5.6 (0.2) 0.3 0.0 (0.1) 0.0 5.6
Surplus 3.0 1.8 0.0 (0.1) (0.3) (0.4) 4.0 0.8 0.4 (0.1) (0.1) (1.1) 3.9
S-II Ratio 149% 172% 169%
1. M&G plc Group before pro forma adjustments; 2. Adjusted for transfer of Hong Kong to Prudential Asia and reinsurance of part of annuity portfolio to Rothesay
55Sources of operating capital generation before tax
FY 2018
Underlying capital generation Other operational capital generation5
Savings & Asset Management
£m OF1 SCR2 Total
Asset Management 472 (75)1 397
Asset trading /
With-Profits in-force 50 (23)3 27 Expense
hedging
With-Profits new bus. 75 (127) 1 (52) assumptions
£0.16bn
Other 20 (3) 17 £0.10bn
Total Underlying 617 (228) 2 389
TRASP6 Other
£0.17bn £0.15bn
£0.9 bn4 £1.0 bn
Heritage
£m OF1 SCR2 Total
With-Profits 178 (26)3 152
Longevity
S/H Annuities & Other 217 1512 368
£0.38bn
Total Underlying 395 1252 520
1. Own Funds; 2. Solvency Capital Requirement; 3. Includes run-off of Shareholder Transfer hedging programme of £(44)m in Savings & Asset Management and £(55)m in Heritage;
4. Includes £(13)m from Corporate Centre; 5. Includes management actions, non-market experience variances, assumption and model changes; 6. Thematic Review of Annuity Sales Practices 56Sources of operating capital generation before tax
H1 2019
Underlying capital generation Other operational capital generation5
Savings & Asset Management
£m OF1 SCR2 Total
Asset Management 239 - 239
With-Profits in-force 19 (18)3 1
With-Profits new bus. 15 (48)1 (33) Asset trading /
Other 18 (1) 17 hedging
Total Underlying 291 (67) 1 224 £0.11bn
Other
£0.09bn
£0.5 bn4 £0.3 bn
Heritage
£m OF1 SCR2 Total
With-Profits 76 (22)3 54
S/H Annuities & Other 129 731 202
Longevity
Total Underlying 205 511 256 £0.10bn
1. Own Funds; 2. Solvency Capital Requirement; 3. Includes run-off of Shareholder Transfer hedging programme of £(31)m in Savings & Asset Management and £(35)m in Heritage;
4. Includes £(21)m from Corporate Centre; 5. Includes management actions, non-market experience variances, assumption and model changes 57Underlying capital generation
Shareholder Annuities1
Illustrative long-term run-rate
Run-off is gradual, TMTP2 amortisation dropping out in 2032
Amortisation of transitional
measures drops out in 2032
Cumulative capital
generation from
Shareholder Annuities
more than sufficient to
repay all debt and
interest cost3
2020 2025 2030 2035 2040 2045
1. Illustrative Solvency II capital generation; disregards any potential impacts from assumption changes and other non -recurring effects;
2. Transitional Measures on Technical Provisions; 3. Refers to the £3.2bn debt expected to be substituted upon demerger and related interest cost 58Translating capital generation to Holding Company cash
Indicative flows post-demerger
Legal entity generating
Holding Company cash generation
distributable surplus
M&G
M&G Investments
Asset Management Dividend from M&G Investments X
investments dividend to
HoldCo
Retail Savings Prudential Assurance Company (PAC) Dividend from PAC X
(incl. PruFund)
Head office expense1 (X)
Traditional WP
PAC dividend
to HoldCo
Shareholder Debt interest1 (X)
Annuities
HoldCo cash generation
X
Other before dividend
1. After tax
594. Financial management framework
60Financial management framework
Business target Uses of capital
3-year cumulative Financial
Attractive
capital generation1 strength and
dividends
flexibility
2020-22 Return of
mid-point
target2
£2.2bn
After debt financing
Invest in the
business
excess
capital
costs, other Corporate
Centre costs and tax
1. Total change in Solvency II surplus before capital movements and dividends; 2. Provisional target subject to further consideration by the Remuneration Committee of appropriate 2020 incentive plan targets at year-end 2019
612020-22 mid-point capital generation target
Illustrative bridge from past underlying capital generation
£bn
1.4 2.8 0.8
0.6 2.2
0.3
1.6
0.5
0.9
Savings & Asset
Management
Heritage
FY 2018 H1 2019 18 months 3-year pro rated Pro forma Assumed Resulting 3-year Additional 2020-22
underlying underlying equivalent equivalent Corporate Centre tax 4 net underlying cap. gen. required mid-point
cap. gen.1 cap. gen. 1 underlying underlying costs 3 cap. gen. to meet target cap. gen.
cap. gen. 2 cap. gen. target 5
1. Excludes Corporate Centre costs; 2. Set equal to the sum of FY 2018 and H1 2019 underlying capital generation; 3. Based on interest cost of £190m and the mid-point of the Head Office £80-100m cost expectation;
4. Assumed corporate tax at standard rate; 5. Provisional target subject to further consideration by the Remuneration Committee of appropriate 2020 incentive plan targets at year-end 2019; refers to total change in Solvency II surplus before capital movements and dividends 62Uses of capital
Financial strength and attractive dividends
Financial strength Dividend policy
Assessing our position relative to: Expectations for ordinary dividends:
Solvency ratio1
• Pro forma H1 170%
• Comfortable level
Leverage ratio2
• Starting position at 34%
• Underpinned by strong
1 Stable or increasing
in absolute terms over time
2
given the nature of Heritage cashflows
the business we are
• Aim to reduce gradually
Two dividend payments per year
writing interim dividend being 1/3 of the previous full year
over time
3 2019 final ordinary dividend of £310m3
implying an “as-if” full year ordinary dividend of c. £465m3,4
HoldCo Liquidity
Ensure sufficient liquid resources to cover
expected cash outflows for at least 1 year,
including dividend
4 To develop broadly in line with capital
generation over the longer term
1. Group shareholder SII ratio; 2. Nominal value of debt as % of total Group Own Funds. 3. Subject to the Company’s financial performance and overall financial position remaining in line with expectations; 4. M&G plc expects3 to declare a one-off demerger related dividend of £100m in recognition that, for
the majority of 2019, it was operating without incurring certain costs, e.g. debt interest costs, which it would expect to bear in future and which have been allowed for in determining the initial level of ordinary dividend. 63Key messages
1 Resilient H1 performance despite challenging market backdrop
2 Differentiated proposition driving flow potential and protecting margins
3 Strongly positioned to generate sustainable growth in capital and cash
4 Robust and disciplined capital management framework
5 Aim to deliver attractive and sustainable returns to shareholders
64Q&A
65Appendix
66Appendix 1
Additional financial information
67Solvency II position
Prudential Assurance Company (PAC)
H1 2019, £bn
Shareholder view With-Profits Fund view Consolidated solvency view1
4.5
Surplus = 3.8bn
11.1
4.5
8.9 Surplus = 6.6bn 8.9
Surplus = 3.8bn
5.2 5.2
4.5
Own Funds SCR Own Funds SCR Own Funds SCR
Solvency ratio 173% Solvency ratio 249% Solvency ratio 139%
1. Regulatory view including the recalculation of Transitional Measures on Technical Provisions (TMTP)
68Diverse risk exposures
Analysis of M&G plc Group SCR (shareholder view)
£bn 11.0
As of H1 2019 0.4 Sectoral (M&G)
Operational &
1.3
expense
0.2 Lapse
Longevity 1.7
0.9 Currency
5.6
Credit 3.6 (5.4)
0.3 Interest rate
Property 0.9
1.7 Equity
Undiversified SCR Diversification, SCR
deferred tax, and other
69M&G plc Solvency II Sensitivities
Group Shareholder Solvency II market sensitivities (%)
As of H1 2019
Base Shareholder S2 ratio 169
20% fall in equity markets 162
50bp fall in interest rates 162
100bp increase in credit spreads 166
20% credit asset downgrade 1 162
1. Average impact of one full letter downgrade across 20% of assets exposed to credit risk
Note: Sensitivities assuming recalculation of Transitional Measures on Technical Provisions (TMTP) 70Bonds in issue expected to transfer to M&G plc on demerger 1
ISIN Currency Nominal (in m) Coupon Issue Date Maturity Date Call Date
XS2025521886 GBP 300 3.875% 2019 2049 2024
XS1888930150 USD 500 6.500% 2018 2048 2028
XS1888920276 GBP 750 5.625% 2018 2051 2031
XS1243995302 GBP 600 5.560% 2015 2055 2035
XS1003373047 GBP 700 6.340% 2013 2063 2043
XS1888925747 GBP 500 6.250% 2018 2068 2048
1. Prudential plc has in issue Tier 2 subordinated notes which include in their respective terms a substitution mechanic permitting Prudential plc to substitute the M&G plc as the issuer thereof at the point of demerger
71Operating capital generation
FY 2018 H1 2019
£m Own Funds SCR Total Own Funds SCR Total
Asset Management 472 (75) 397 239 - 239
With-Profits 125 (150) (25) 34 (66) (32)
Asset Management
- of which: In-force1 50 (23) 27 19 (18) 1
Savings &
- of which: New business 75 (127) (52) 15 (48) (33)
Other 20 (3) 17 18 (1) 17
Total Underlying capital generation 617 (228) 389 291 (67) 224
Other operating capital generation (66) 122 56 (60) (28) (88)
Total Operating capital generation 551 (106) 445 231 (95) 136
With-Profits 178 (26) 152 76 (22) 54
Shareholder Annuities & other 217 151 368 129 73 202
Heritage
Total Underlying capital generation 395 125 520 205 51 256
Other operating capital generation 698 206 904 100 321 421
Total Operating capital generation 1,093 331 1,424 305 372 677
Corporate
Interest & Head Office cost (13) - (13) (21) - (21)
centre
Other operating capital generation (9) - (9) 9 (47) (38)
Total Interest & Head Office capital generation (22) - (22) (12) (47) (59)
Total Operating Capital Generation 1,622 225 1,847 524 230 754
1. Includes a small amount of PruFund predecessor unitised With-Profits contracts
72IFRS Adjusted Operating Profit by source
£m FY 2016 FY 2017 FY 2018 H1 2018 H1 2019
Asset Management 384 477 473 265 216
Savings & Asset
Management
With-Profits (PruFund 1) 32 39 54 23 29
Other 39 7 (59) 8 17
Total Savings & Asset Management 455 523 468 296 262
With-Profits 179 164 201 91 97
Heritage
Shareholder Annuities & Other 574 683 961 392 377
Total Heritage 753 847 1,162 483 474
Corporate centre (5) (8) (13) (7) (21)
Total Adjusted Operating Profit 1,203 1,362 1,617 772 715
1. Includes a small amount of PruFund predecessor unitised With-Profits contracts
73From IFRS Adjusted Operating Profit to Net Profit
£m FY 2016 FY 2017 FY 2018 H1 2018 H1 2019
Total Adjusted Operating Profit 1,203 1,362 1,617 772 715
Short-term fluctuations in investment returns 211 42 (3) (136) 364
Disposal of businesses & corporate transactions - - (508) (513) -
Restructuring costs (16) (73) (109) (41) (82)
Profit Before Tax Attributable to Shareholders 1,398 1,331 997 82 997
Tax (264) (257) (191) (15) (203)
Profit After Tax 1,134 1,074 806 67 794
74You can also read