Reconstruction of the track and a simulation of the storm surge associated with the calamitous typhoon affecting the Pearl River Estuary in ...
←
→
Page content transcription
If your browser does not render page correctly, please read the page content below
Clim. Past, 16, 51–64, 2020
https://doi.org/10.5194/cp-16-51-2020
© Author(s) 2020. This work is distributed under
the Creative Commons Attribution 4.0 License.

Reconstruction of the track and a simulation of the storm surge
associated with the calamitous typhoon affecting the
Pearl River Estuary in September 1874
Hing Yim Mok, Wing Hong Lui, Dick Shum Lau, and Wang Chun Woo
Hong Kong Observatory, Hong Kong, China

Correspondence: Dick Shum Lau (dslau@hko.gov.hk)

Received: 19 March 2019 – Discussion started: 24 April 2019
Revised: 22 November 2019 – Accepted: 26 November 2019 – Published: 9 January 2020

Abstract. A typhoon struck the Pearl River Estuary in            ing the recent records set by super typhoon Mangkhut on
September 1874 (“Typhoon 1874”), causing extensive dam-          16 September 2018.
age and claiming thousands of lives in the region during its
passage. Like many other historical typhoons, the deadliest
impact of the typhoon was its associated storm surge. In
                                                                 1   Introduction
this paper, a possible track of the typhoon was reconstructed
through an analysis of the historical qualitative and quanti-    Hong Kong, located on the coast of southern China, is vul-
tative weather observations in the Philippines, the northern     nerable to sea flooding due to storm surges associated with
part of the South China Sea, Hong Kong, Macao, and Guang-        approaching tropical cyclones from the western North Pa-
dong recorded in various historical documents. The magni-        cific or the South China Sea. Since the establishment of the
tudes of the associated storm surges and storm tides in Hong     Hong Kong Observatory in 1883 when records of tropical cy-
Kong and Macao were also quantitatively estimated using          clones affecting Hong Kong began, storm surges induced by
storm surge model and analogue astronomical tides based          typhoons in 1906, 1936, and 1937, as well as super typhoon1
on the reconstructed track. The results indicated that the ty-   Wanda in 1962, brought severe casualties and damage to
phoon could have crossed the Luzon Strait from the western       Hong Kong (Peterson, 1975; Ho, 2003). Storm surges in-
North Pacific and moved across the northeastern part of the      duced by super typhoon Hato in 2017 (https://www.hko.gov.
South China Sea to strike the Pearl River Estuary more or        hk/en/informtc/hato17/hato.htm, last access: 3 January 2020;
less as a super typhoon in the early morning on 23 Septem-       Lau and Chan, 2017) and super typhoon Mangkhut in 2018
ber 1874. The typhoon passed about 60 km south–southwest         (https://www.hko.gov.hk/en/blog/00000216.htm, last access:
of Hong Kong and made landfall in Macao, bringing max-           3 January 2020), even though with no significant casual-
imum storm tides of around 4.9 m above the Hong Kong             ties, still brought severe flooding and damage to Hong Kong
Chart Datum (http://www.geodetic.gov.hk/smo/gsi/Data/pdf/        during their passages. The storm surges or the storm tides
explanatorynotes.pdf, last access: 3 January 2020) at the        observed in the Victoria Harbour associated with these ty-
Victoria Harbour in Hong Kong and around 5.4 m above             phoons ranked in the top five on record since the establish-
the Macao Chart Datum (https://mosref.dscc.gov.mo/Help/          ment of the Hong Kong Observatory in 1883. The storm
ref/Macaucoord_2009_web_EN_v201702.pdf, last access:             surge and sea level records, as well as the tracks of these
3 January 2020) at Porto Interior (inner harbour) in Macao.      typhoons, are shown in Table 1 and Fig. 1, respectively.
Both the maximum storm tide (4.88 m above the Hong Kong
Chart Datum) and maximum storm surge (2.83 m) brought                1 The classification of tropical cyclones in Hong Kong in terms
by Typhoon 1874 at the Victoria Harbour estimated in this        of maximum sustained wind speeds near the centre averaged over
study are higher than all the existing records since the es-     a period of 10 min can be found at https://www.weather.gov.hk/en/
tablishment of the Hong Kong Observatory in 1883, includ-        informtc/class.htm (last access: 3 January 2020).

Published by Copernicus Publications on behalf of the European Geosciences Union.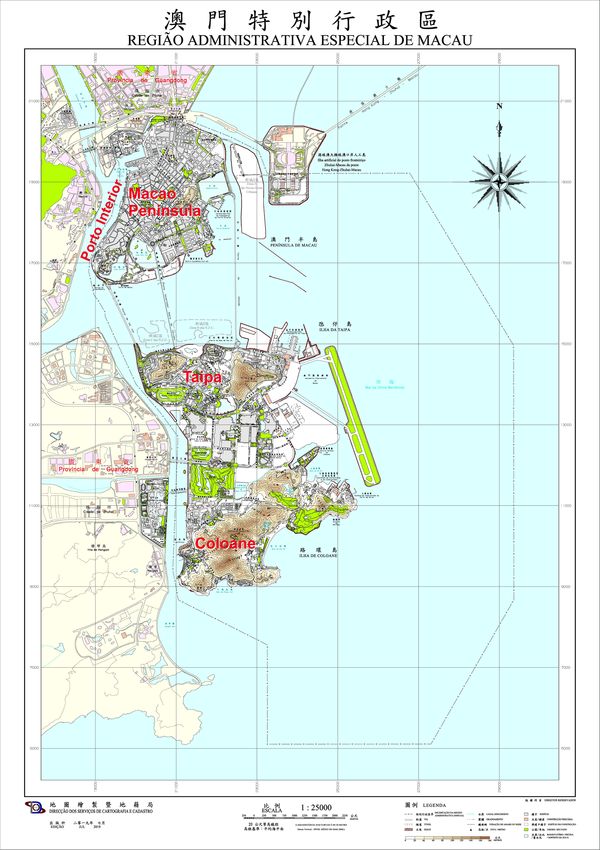
52 H. Y. Mok et al.: Track reconstruction and storm surge simulation of an 1874 typhoon
Table 1. Records of the top five storm surges and storm tides recorded in the Victoria Harbour in Hong Kong since the establishment of the
Hong Kong Observatory in 1883 in chronological order. (The ranking of the top five is shown in parentheses.)
Typhoon Year Maximum storm surge at Maximum storm tide at Number of
name Victoria Harbour (above Victoria Harbour (above deaths
astronomical tide) (m) Chart Datum) (m)
– 1906 1.831 (4) 3.351,2 over 10 0003
– 1936 1.921 (3) 3.811 (4) 20
– 1937 1.981 (2) 4.051 (1) ∼ 11 0003
Wanda 1962 1.77 (5) 3.964 (2) 130 deaths
53 missing
Hato 2017 1.18 3.575 (5) 0
Mangkhut 2018 2.35 (1) 3.885 (3) 0
1 Based on tide pole observations, field surveys, or reports from local residents. The operation of the tide gauge network
started in 1952. 2 Information on the reference level for the storm tide reading was not available as the Chart Datum was
not yet established in 1906. 3 According to press reports. 4 Recorded at the tide gauge station at North Point in the
Victoria Harbour 5 Recorded at the tide gauge station at Quarry Bay (about 500 m east of North Point) in the Victoria
Harbour.
making landfall over or passing to the south of Hong Kong
will generate onshore winds that bring severe storm surges to
the territory.
However, for a better understanding of the storm surge risk
in Hong Kong from a historical perspective, one should not
ignore the calamitous typhoon which struck the Pearl River
Estuary during 22–23 September 1874 (hereafter “Typhoon
1874”), bringing extensive damage and claiming several
thousand lives in Hong Kong, and this might have prompted
the establishment of the Hong Kong Observatory (the offi-
cial weather authority in Hong Kong) later in 1883. Hong
Kong Typhoons (Heywood, 1950) recorded that “the typhoon
demolished the Civil Hospital and St. Joseph’s Church (the
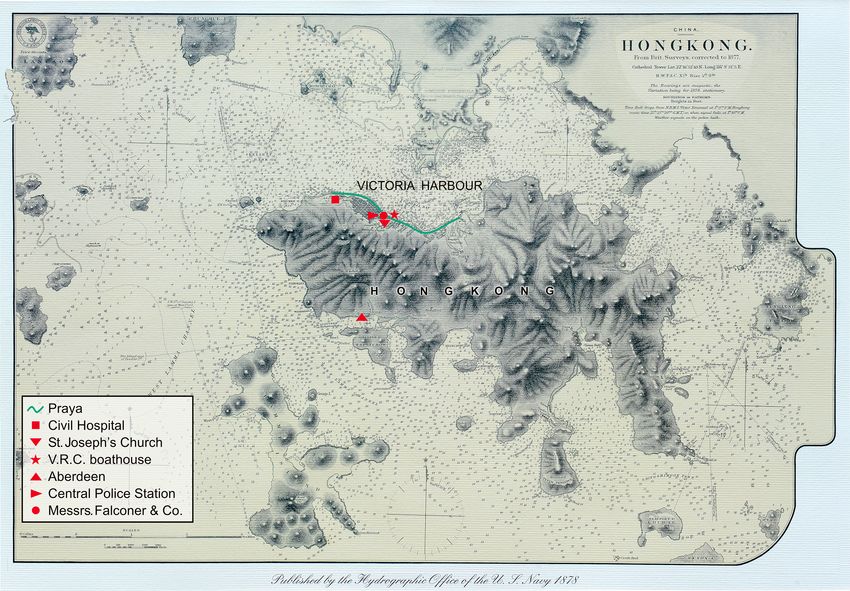
locations are marked in Fig. 2). A warship dragged her moor-
ings and was thrown into V.R.C. boathouse” (the location is
marked in Fig. 2). As described in the report by the Captain
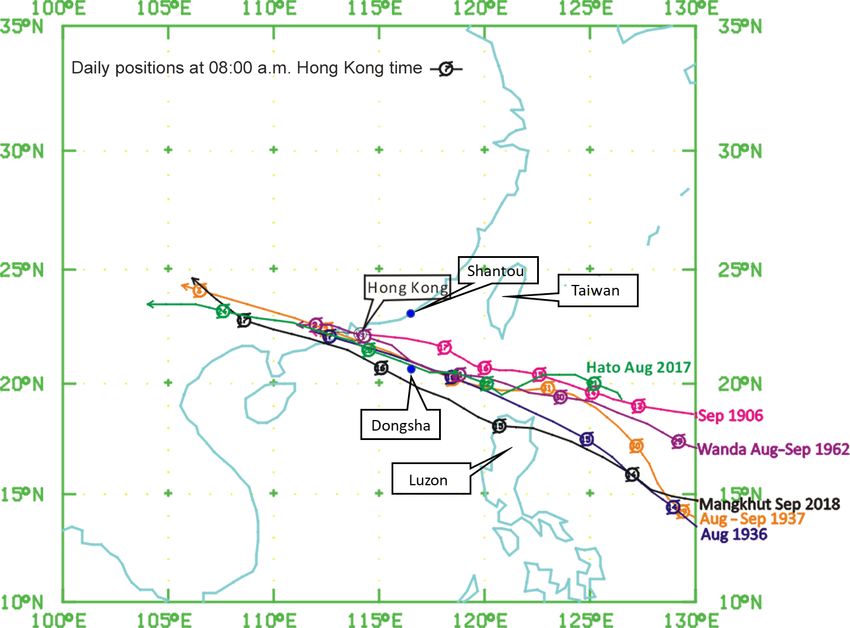
Figure 1. Daily positions at 08:00 Hong Kong time of the ty- Superintendent of Police (Hong Kong Government, 1874),
phoons affecting Hong Kong on 13–18 September 1906 (Typhoon “the Police had recovered the bodies of 621 people, but this
Sep 1906), 14–17 August 1936 (Typhoon Aug 1936), 29 August to number probably represented only one-third of the actual fig-
3 September 1937 (Typhoon Aug–Sep 1937), super typhoon Wanda
ure. Furthermore, over 200 houses were destroyed or ren-
from 29 August to 2 September 1962 (Wanda Aug–Sep 1962), su-
dered uninhabitable. Two steamers sank in the harbour and
per typhoon Hato on 21–24 August 2017 (Hato Aug 2017), and su-
per typhoon Mangkhut on 14–17 September 2018 (Mangkhut Sep another steamer was on shore near Aberdeen (the location
2018). is marked in Fig. 2), and eight ships were supposed to have
been lost. It was impossible to estimate the destruction of
junks and small boats. Telegraph posts were blown down in
different parts of the Hong Kong Island, interrupting com-
Figure 1 shows that typhoons bringing a significant storm munications. The roads were almost impassable from the
surge impact to Hong Kong have similar tracks – form- obstruction caused by the fallen trees.” The China Mail of
ing and intensifying into at least typhoon strength over the 23 September 1874 (China Mail, 1874) also reported that “a
western North Pacific, moving across the Luzon Strait with- typhoon, though of very short duration, has probably proved
out making landfall over the Philippines and Taiwan (ex- the most destructive witnessed since 1862 – if not exceeding
cept Mangkhut, which skirted the northern part of Luzon), it in that respect – swept over the island between the hours of
approaching the coast of Guangdong, and making landfall 06:00 p.m. and 06:00 a.m.”.
over or passing to the south of Hong Kong. Typhoons mov- Like many other historical typhoons which caused signif-
ing across the Luzon Strait without making landfall over icant casualties, the deadliest impact of Typhoon 1874 was
the Philippines and Taiwan can maintain their intensity, and
Clim. Past, 16, 51–64, 2020 www.clim-past.net/16/51/2020/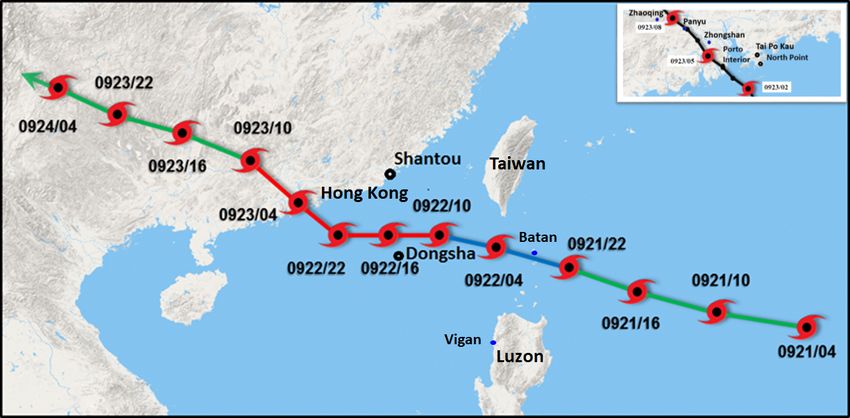
H. Y. Mok et al.: Track reconstruction and storm surge simulation of an 1874 typhoon                                                   53

Figure 2. Historical Hong Kong map published by the Hydrographic Office of the UK Navy in 1878 (owned by Chi Ming Shun) showing
the Praya along the northern coast of Hong Kong Island and the locations of the Civil Hospital, St. Joseph’s Church, the V.R.C. boathouse,
Aberdeen, the Central Police Station, and Messrs. Falconer & Co. on Hong Kong Island.

its associated storm surge. The Harbour Master reported in             1000 in Taipa and 400 in Coloane. The cost of the damage
the Hong Kong Government Gazette of 17 October 1874                    was estimated to be up to 2 million silver coins” (the loca-
(Hong Kong Government, 1874) that “the strength of the                 tions are shown in Fig. 3). Out of an estimated population
wind brought an immense volume of water into the harbour,              of around 60 000 people in Macao (Ou, 2014), the fatalities
not a tidal wave, but a rapid rise which continued for about           accounted for approximately 8 % of the population.
an hour, flooding the Praya and ground floors of houses to a              While Typhoon 1874 was one of the most damaging ty-
height of 4 and 5 feet for some distance inshore. Although,            phoons with a significant storm surge in Hong Kong, no of-
according to ordinary calculation it should have been low wa-          ficial records of any kind were available. A reconstruction of
ter at two o’clock; by three, the water had risen to from five to      the typhoon track and a quantitative estimation of its asso-
six feet above its high water level, or a rise of about ten feet       ciated storm surge and storm tide during its passage based
had taken place” (the Prata is coloured in green in Fig. 2).           on the reconstructed track are therefore highly desirable for
   Typhoon 1874 also caused severe damage to Macao on                  comparison with the other historical typhoons which affected
the western side of the Pearl River Estuary. According to the          Hong Kong, in particular those which generated the signifi-
publication O Maior Tufao De Macau – 22 e 23 de Setem-                 cant storm surges and/or tides listed in Table 1, and more
bro de 1874 by Father Manuel Teixeira (Teixeira, 1974),                importantly for assessing the storm surge risk in Hong Kong.
the passage of Typhoon 1874 was also accompanied by a                     The objective of this study is to reconstruct the lifespan of
storm surge which caused severe flooding of up to 2.1 m (7 ft)         Typhoon 1874 and to quantitatively estimate the storm surges
above the high tide level. The Times of Typhoon published              and storm tides which might have been experienced in Hong
by the Arquivo Historico De Macao (2014) summarized that               Kong during its passage. The storm surges and storm tides
“the strong winds, fierce waves and fires destructed countless         in Macao are also quantitatively estimated for comparison in
buildings and infrastructures, around 2000 fishing vessels             this study.
and cargo ships were sunk. The storm claimed around 5000
lives, including approximately 3600 in the Macao Peninsula,

www.clim-past.net/16/51/2020/                                                                            Clim. Past, 16, 51–64, 2020
54                                      H. Y. Mok et al.: Track reconstruction and storm surge simulation of an 1874 typhoon

Figure 3. Topographic map of Macao in 2019 (© Macao Special Administrative Region Government – Cartography and Cadastre Bureau)
showing the locations of Porto Interior, Macao Peninsula, Taipa, and Coloane.

Clim. Past, 16, 51–64, 2020                                                                   www.clim-past.net/16/51/2020/
H. Y. Mok et al.: Track reconstruction and storm surge simulation of an 1874 typhoon                                             55

2    Data and methods                                                     the National Archives in London, UK, containing obser-
                                                                          vations on pressure and winds for 22 and 23 September
A search and analysis of publicly available historical docu-              1874;
ments related to Typhoon 1874 was conducted to acquire the
relevant information for reconstructing the track of the ty-           f. the bulletin of the Province of Macao and Timor pub-
phoon using the Jelesnianski tropical cyclone model (Jeles-               lished on 3 October 1874 (Macao Government, 1874)
nianski, 1965). With the reconstructed track, the storm surges            containing ship reports for 22 to 23 September 1874 by
at Hong Kong and Macao during its passage were estimated                  the gunboat Tejo moored at Porto Interior (the location
by the storm surge model SLOSH (Sea, Lake, and Over-                      is shown in Fig. 3) in Macao;
land Surges from Hurricanes) developed by the US National
                                                                       g. the bulletin of the Province of Macao and Timor
Oceanic and Atmospheric Administration (NOAA). The as-
                                                                          published on 24 October 1874 (Macao Government,
tronomical tides were estimated by analogue with dates of a
                                                                          1874) containing weather observations from 11:00 on
similar Sun–Earth–Moon configuration for the estimation of
                                                                          22 September to 10:00 on 23 September 1874 by the
the storm tides (sum of storm surges and astronomical tides).
                                                                          Macao Port Authority; and
   After a search and study of historical documents, the fol-
lowing information available from the Philippines, Hong                h. a book on historical disastrous tidal events in China (Lu,
Kong, and Macao provided valuable weather and tidal ob-                   1984) describing the track of Typhoon 1874 in the Pearl
servations for reconstructing the lifespan and revealing the              River Estuary and inland western Guangdong as well as
power of Typhoon 1874:                                                    its damage to the region.
    a. the Selga Chronology Part I, available at http://www.
       ucm.es/info/tropical/selga-i.html (last access: 3 January   3     Analysis of weather observations in historical
       2020; García-Herrera et al., 2020), containing wind and           documents
       pressure records in the vicinity of the Luzon Strait dur-
                                                                   The construction of a possible track of Typhoon 1874 was
       ing the passage of Typhoon 1874;
                                                                   divided into three parts in this study, namely (a) over the Lu-
    b. the Harbour Master report in the Hong Kong Govern-          zon Strait, (b) over the South China Sea, and (c) over the
       ment Gazette on 17 October 1874 (Hong Kong Gov-             Pearl River Estuary.
       ernment, 1874) containing the qualitative observations
       of three ships (namely the British ship Onward, Amer-       3.1    Luzon Strait
       ican ship Highlander, German ship Amanda) on Ty-
                                                                   A description of the passage of Typhoon 1874 in the vicin-
       phoon 1874 near the Pratas Shoal (now called Dong-
                                                                   ity of the Luzon Strait was found in the Selga Chronology
       sha, as marked in Fig. 1) over the northeastern part of
                                                                   Part I: 1348–1900 (García-Herrera et al., 2020). Supplement
       the South China Sea, a description of the sequence of
                                                                   Sect. S1 is an extract of the part on Typhoon 1874 with a de-
       weather changes in the Victoria Harbour, and pressure
                                                                   scription of the meteorological conditions at two observation
       readings at the Central Police Station (the location is
                                                                   points, Vigan (a city near the western coast of Luzon) and the
       marked in Fig. 2) in Hong Kong during the passage of
                                                                   Batan Islands in the Luzon Strait, during the passage of the
       Typhoon 1874;
                                                                   typhoon. The locations of Vigan and the Batan Islands are
    c. the China Mail of 23 September 1874 (China Mail,            marked in Fig. 6.
       1874) and Hong Kong Daily Press of 24 September                Table 2 shows the chronological summary of the meteoro-
       1874 (Hong Kong Daily Press, 1874) containing pres-         logical observations at the two locations based on the infor-
       sure readings reduced to mean sea level in the Victoria     mation in Sect. S1. It can be seen that the Batan Islands and
       Harbour from the Harbour Master and pressure readings       Vigan were affected by hurricane force winds from the east
       recorded by two barometers of a local company, Messrs.      and west, respectively, at around midnight on 21 Septem-
       Falconer & Co., Hong Kong (the location is marked in        ber, suggesting that the centre of Typhoon 1874 was pass-
       Fig. 2), during the passage of Typhoon 1874;                ing through the area between Vigan and the Batan Islands
                                                                   at about that time. As the pressure recorded at the Batan Is-
    d. the Hong Kong Daily Press of 25 September 1874              lands at 01:00 on 22 September (724 mm Hg or 965.3 hPa)
       (Hong Kong Daily Press, 1874) describing the impact         was much lower than that recorded at Vigan at midnight on
       of Typhoon 1874 on Swatow (now called Shantou, as           21 September (745 mm Hg or 993.3 hPa), the centre of Ty-
       marked in Fig. 1) at the eastern coast of the Guangdong     phoon 1874 was likely closer to the Batan Islands than Vigan
       Province of China;                                          and located over the sea area off the coast of northern Luzon
                                                                   during its passage over the Luzon Strait.
    e. the logbook of the vessel HMS Princess Charlotte               Furthermore, the pressure of 724 mm Hg (965.3 hPa) ob-
       moored at the Victoria Harbour, which is now kept at        served at the Batan Islands at 01:00 on 22 September sug-

www.clim-past.net/16/51/2020/                                                                        Clim. Past, 16, 51–64, 2020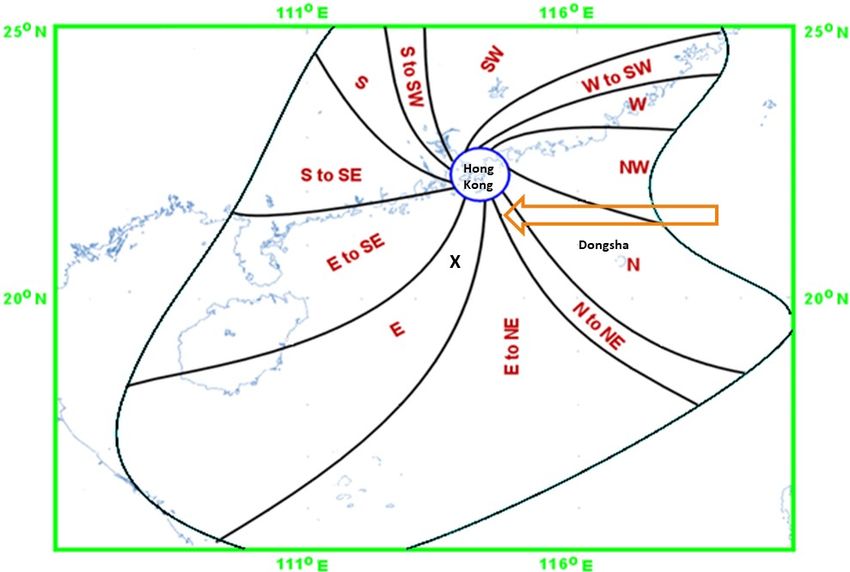
56                                         H. Y. Mok et al.: Track reconstruction and storm surge simulation of an 1874 typhoon

Table 2. Chronological summary of weather observations at Vigan and the Batan Islands (extracted from Sect. S1) during the passage of
Typhoon 1874.

                      Vigan
                      Date and local time              Atmospheric              Winds                          Weather
                                                       Pressure (hPa)
                      21 September, dawn               993.9                    Calm                           Rainy
                      21 September, 16:00              988.6                    Slight SW                      Rain aplenty
                      21 September, midnight           993.3                    Hurricane W                    –
                      22 September, 08:00              996.9                    SSW becoming S                 Much rain
                      Batan Islands
                      21 September, twilight           Began to descend         –                              –
                                                       conspicuously
                      21 September, 20:00              Rapid fall               Strong NNE                     –
                      21 September, 22:00              –                        Hurricane                      –
                      21 September, 23:00              982.6                    NNE with frightful violence    –
                      22 September, 01:00              965.3                    Maximum intensity E            –
                      22 September, 04:00              Rapid rise since         SE                             –
                                                       01:00
                    Note: the following conversion factor has been adopted: 1 mm mercury = 1.33322387 hPa;
                    Marvin et al. (1918).

gested that Typhoon 1874 had an intensity of at least a                          the whole of the papers in the office” (Swatow is now called
typhoon, with the maximum sustained 10 min mean wind                             Shantou), indicating that Typhoon 1874 had also brought a
speed reaching 130 km h−1 or higher near its centre using the                    severe storm surge to Shantou before reaching the Pearl River
minimum pressure and maximum wind relationship for trop-                         Estuary. Considering the distance of about 300 km between
ical cyclones in this region (Atkinson and Holliday, 1977).                      Dongsha and Shantou, Typhoon 1874 likely passed to the
Assuming that the centre of Typhoon 1874 was closer to the                       north rather than to the south of Dongsha.
Batan Islands, the observed hurricane winds at Vigan sug-
gested that the radius of the hurricane force winds of Ty-
phoon 1874 was over 200 km when it passed through the Lu-                        3.3     Pearl River Estuary
zon Strait.
                                                                                 A summary of the pressure observations in Hong Kong and
                                                                                 Macao during the passage of Typhoon 1874 extracted from
3.2   South China Sea                                                            the available historical documents is shown in Table S1 in
                                                                                 the Supplement. Figure 4 plots the time series of those pres-
The description of Typhoon 1874 over the northeastern part                       sure observations from 08:00 on 22 September to 11:00 on
of the South China Sea was found in the Harbour Master                           23 September 1874. It can be seen that the pressure at Hong
report in the Hong Kong Government Gazette published on                          Kong reached the minimum of around 975 hPa at 02:00 on
17 October 1874 (Hong Kong Government, 1874) which                               23 September, while the pressure at Macao continued to fall
stated that the typhoon passed rather close to the Pratas Shoal                  to a minimum of around 946 hPa at 04:00 on 23 September.
(now called Dongsha, as marked in Fig. 1) according to the                       Furthermore, the pressure readings and pressure falling rates
reports from three ships (the British ship Onward, Ameri-                        at Hong Kong and Macao were rather close to each other
can ship Highlander, and German barque Amanda) travelling                        from the evening of 22 September to 02:00 on 23 September.
close to the island between 16:00 and 18:00 on 22 September.                     This phenomenon revealed that Typhoon 1874 was at more
However, detailed meteorological observations from these                         or less the same distance from Hong Kong and Macao when
three ships could not be found for a more in-depth interpre-                     it approached the Pearl River Estuary during this period.
tation, such as whether the typhoon passed to the south or                          A summary of the wind observations in Hong Kong and
north of Dongsha as it approached the southern China coast.                      Macao during the passage of Typhoon 1874 extracted from
   On the other hand, it was reported in the Hong Kong Daily                     the available historical documents is shown in Table S2.
Press of 25 September 1874 (Hong Kong Daily Press, 1874)                         In Hong Kong, the north to northwesterly winds started to
that “there has also been a most severe typhoon at Swatow                        strengthen in the evening on 22 September. Winds contin-
and the sea ran so high as to flood the Custom House, which                      ued to strengthen, gradually veered to the east–northeast, and
is three hundred yards inland, to such an extent as to damage                    reached hurricane force by 02:00 on 23 September. Hurri-

Clim. Past, 16, 51–64, 2020                                                                                    www.clim-past.net/16/51/2020/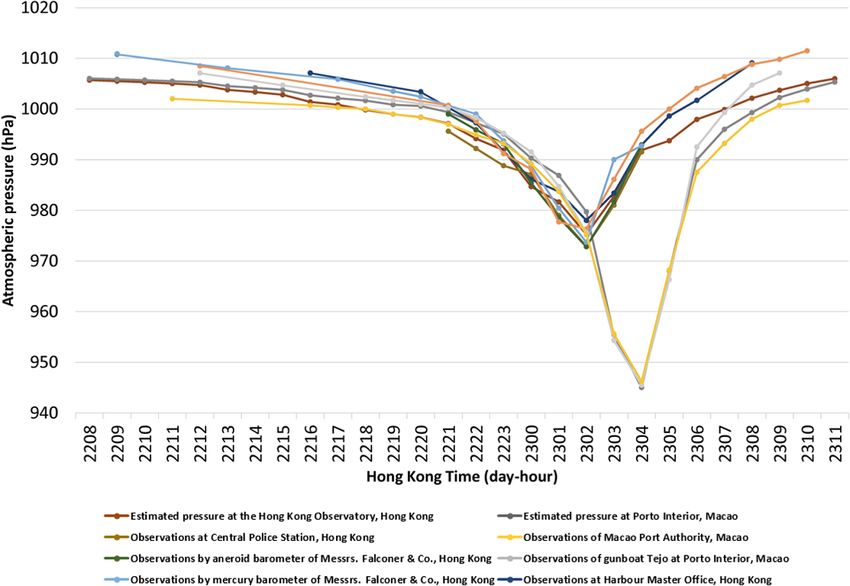
H. Y. Mok et al.: Track reconstruction and storm surge simulation of an 1874 typhoon                                                 57

Figure 4. Series plots of pressure observations recorded at the Central Police Station, the aneroid barometer of Messrs. Falconer & Co.,
Hong Kong, the mercury barometer of Messrs. Falconer & Co., Hong Kong, the vessel HMS Princess Charlotte, the Harbour Master’s Office
in Hong Kong, and the Macao Port Authority and the gunboat Tejo in Macao from 08:00 on 22 September to 11:00 on 23 September 1874
(as listed in Table S1). Also shown are the series plots of atmospheric pressures at Hong Kong (Hong Kong Observatory) and Macao (Porto
Interior) during the same period estimated by the Jelesnianski tropical cyclone model based on the hourly positions, hourly minimum mean
sea level pressures near the centre, and the radii of the maximum wind of the reconstructed possible track as listed in Table 3.

cane force winds were maintained for the next 2 h, while              Macao or passed rather close to the south of the gunboat Tejo
the winds gradually veered to the east–southeast. The winds           moored at Porto Interior at 04:00 on 23 September with a
gradually subsided and veered to the southeast or south–              minimum mean sea level pressure of around 945 hPa near its
southeast in the early morning on 23 September.                       centre. This minimum mean sea level pressure suggested that
   According to the result of a study on the relation be-             the maximum sustained 10 min mean winds near the centre
tween tropical cyclone position and wind direction for wind           of Typhoon 1874 could have exceeded 180 km h−1 according
strength of strong force or above at Waglan Island (an off-           to Atkinson and Holliday (1977), indicating that the intensity
shore island over the southeastern part of Hong Kong) from            of Typhoon 1874 might have reached the strength of a super
1968 to 2001 (Fig. 5; Hong Kong Observatory), the sequence            typhoon (i.e. maximum sustained 10 min mean wind speed of
of wind direction change at Hong Kong during the passage              185 km h−1 or more) when it made landfall at Macao. Con-
of Typhoon 1874 suggested that it most probably approached            sidering that the centre of Typhoon 1874 was at or rather
Hong Kong from more or less the east and passed to the south          close to Porto Interior in Macao at 04:00 on 23 Septem-
of Hong Kong in the small hours on 23 September. This also            ber, the marginal hurricane force winds observed at Hong
provided further support for Typhoon 1874 passing to the              Kong as recorded by the vessel HMS Princess Charlotte at
north of Dongsha during its passage in the northeastern part          04:00 on 23 September (Table S2) revealed that the hurri-
of the South China Sea.                                               cane radius of the typhoon was around 70 km (which is the
   In Macao, the winds changed in more or less the same               distance between the two observation points in Hong Kong
way as those in Hong Kong in the evening on 22 September.             and Macao) at that time.
Hurricane force winds affected Macao from 03:00 to 05:00                 According to a book on historical disastrous tidal events
on 23 September and there was a rapid change in wind di-              in China (Lu, 1984), besides Hong Kong and Macao, Ty-
rection of 90◦ from the northeast to southeast at 04:00. The          phoon 1874 also caused severe damage and flooding to var-
pressure and wind observations in Tables S1 and S2, respec-           ious cities in western Guangdong in the vicinity of the Pearl
tively, revealed that Typhoon 1874 possibly made landfall at          River Estuary, including Zhongshan and Panyu, and moved

www.clim-past.net/16/51/2020/                                                                           Clim. Past, 16, 51–64, 2020
58                                         H. Y. Mok et al.: Track reconstruction and storm surge simulation of an 1874 typhoon

                                                                         ern Guangdong and the Pearl River Estuary, can be recon-
                                                                         structed.
                                                                            The Jelesnianski tropical cyclone model is described as
                                                                                  (
                                                                                     Pn − 34 (Pn − P0 ) Rr    (r ≥ R)
                                                                         Pa (r) =                          2                      (1)
                                                                                     P0 + 14 (Pn − P0 ) Rr    (r < R),

                                                                         where Pa (r) is the mean sea level pressure at a distance r
                                                                         from the centre of the tropical cyclone, P0 is mean sea level
                                                                         pressure near the centre, Pn is the monthly climatological
                                                                         normal mean sea level pressure for the region, which is taken
                                                                         as 1009 hPa for September in this study, and R is the radius
                                                                         of maximum winds, which is defined as the distance from the
                                                                         centre of a tropical cyclone to the location of the cyclone’s
                                                                         maximum winds.
Figure 5. The 12-segment reference diagram showing the correla-
tion between the wind direction for wind strength of strong force
                                                                            Table 3 shows the hourly positions, hourly minimum mean
or above at Waglan Island and the tropical cyclone position used by      sea level pressures near the centre, and the radii of maxi-
the Hong Kong Observatory (for example, the winds at Waglan Is-          mum winds of the reconstructed possible track of Typhoon
land will be easterly when the tropical cyclone is located at position   1874 from 08:00 on 22 September to 11:00 on 23 September
“X”). The arrow framed in brown shows the typical track of a trop-       1874. The atmospheric pressures at Hong Kong and Macao
ical cyclone that could cause a sequential change in wind direction      during the period estimated by the Jelesnianski tropical cy-
in Hong Kong similar to that of the passage of Typhoon 1874.             clone model based on the reconstructed possible track, which
                                                                         are also shown in Fig. 4, matched rather well with the obser-
                                                                         vations at both Hong Kong and Macao.
the northwest to reach Zhaoqing, a city about 200 km west–                  Figure 6 plots the possible track of Typhoon 1874 from the
northwest of Hong Kong. This indicated that Typhoon 1874                 Luzon Strait to inland western Guangdong reconstructed in
moved northwest into inland western Guangdong after pass-                this study. In Fig. 6, the part of the track in red was based
ing Macao.                                                               on Table 3, the part in blue (in the morning on 22 Septem-
                                                                         ber) was estimated by interpolation based on the qualitative
                                                                         analysis discussed in the preceding section, and the parts in
4    Reconstruction of the possible track of Typhoon                     green were arbitrarily extended to meet the requirement for
     1874                                                                the input of 13 6-hourly positions for running the storm surge
                                                                         model for the estimation of storm surges in Hong Kong and
Based on the analysis above, Typhoon 1874 possibly passed                Macao. According to this reconstructed track, Typhoon 1874
through the Luzon Strait at around midnight on 21 Septem-                might have moved at a high speed of about 38 km h−1 on
ber, with a maximum sustained 10 min mean wind speed of                  average from the Luzon Strait to the Pearl River Estuary. It
around 130 km h−1 or higher near its centre and a hurricane              picked up a northwesterly track after 22:00 on 22 Septem-
radius of over 200 km, and moved across the northeastern                 ber when it was about 190 km southeast of Hong Kong to
part of the South China Sea towards the Pearl River Estu-                move towards the coast along a track with more or less the
ary during the day on 22 September. It more likely passed                same distance from Hong Kong and Macao until 02:00 on
to the north of Dongsha in the afternoon on 22 September,                23 September when it was about 60 km south–southwest of
skirted south of Hong Kong at around 02:00 on 23 Septem-                 Hong Kong, the closest approach to Hong Kong. The ty-
ber, and made landfall at Macao about 2 h later as more or               phoon then took a slightly more westerly track to depart
less a super typhoon (i.e. maximum sustained 10 min mean                 Hong Kong and moved towards Macao, resulting in a rapid
wind speed of 185 km h−1 or more) with a hurricane radius                rise in pressure at Hong Kong but a continuing fall in pres-
of around 70 km. It then moved northwest into inland west-               sure at Macao. The reconstructed track also reveals the in-
ern Guangdong.                                                           tensification and decrease in the storm size (the hurricane ra-
   Using the pressure observations in Hong Kong and Macao                dius decreased from 200 km or larger near the Luzon Strait
(Table S1 and Fig. 4), as well as the Jelesnianski tropical              to around 70 km when making landfall at Macao) of the ty-
cyclone model (Jelesnianski, 1965) shown in the equation                 phoon during its passage across the northeastern part of the
below, given that Typhoon 1874 made landfall at Macao at                 South China Sea.
04:00 on 23 September with a minimum mean sea level
pressure of 945 hPa near its centre, a possible track of Ty-
phoon 1874 over the northeastern part of the South China
Sea, particularly its passage along the coastal waters of east-

Clim. Past, 16, 51–64, 2020                                                                           www.clim-past.net/16/51/2020/
H. Y. Mok et al.: Track reconstruction and storm surge simulation of an 1874 typhoon 59
Figure 6. Geographical map (© OpenStreetMap contributors 2019; distributed under a Creative Commons BY-SA License) showing the
possible track of Typhoon 1874 passing through the Luzon Strait between Taiwan and Luzon and moving across the northern part of the
South China Sea reconstructed in this study. The locations of Shantou, Dongsha, Vigan, and Batan are also shown. The small figure at the
upper right corner shows the part of the possible track of Typhoon 1874 before and after making landfall at the Pearl River Estuary as well
as the locations of the tide gauges at North Point and Tai Po Kau in Hong Kong and Porto Interior in Macao, along with the locations of
Zhongshan, Panyu, and Zhaoqing in western Guangdong.
5 Quantitative estimate of storm surge and storm be difficult, bathymetry data with a spatial resolution of about
tide 1 km in Hong Kong and Macao waters and about 7 km in the
open sea to the south of the Pearl River Estuary (the grid used
With the possible track reconstructed in this study, the storm for running SLOSH; Jelesnianski et al., 1992) in the 1880s
surges that affected Hong Kong and Macao by Typhoon are not likely to be available for running SLOSH. Instead, the
1874 can be estimated using the storm surge model SLOSH earliest available digitized topographic and bathymetry infor-
(Sea, Lake, and Overland Surges from Hurricanes) devel- mation in the early 1990s was used for the estimation in this
oped by the US National Oceanic and Atmospheric Adminis- study. The maximum storm surges as estimated by SLOSH
tration (NOAA) (https://www.nhc.noaa.gov/surge/slosh.php, were 2.83 m (at 04:10 on 23 September) at North Point in the
last access: 3 January 2020) and being used operationally by Victoria Harbour and 2.83 m (at 04:00 on 23 September) at
the Hong Kong Observatory to support storm surge predic- Tai Po Kau in the northeastern part of Hong Kong where the
tion and warning services in Hong Kong. SLOSH requires tide gauges operated by the Hong Kong Observatory since
the input of 13 6-hourly positions, minimum mean sea level the 1950s and 1960s, respectively, are located. In Macao, the
pressures near the centre, and the storm sizes in terms of the maximum storm surge as estimated by SLOSH was 2.80 m
radius of maximum winds along the tropical cyclone track. It (at 04:00 on 23 September) at Porto Interior where the tide
also uses the Jelesnianski tropical cyclone model to generate gauge operated in Macao is located. Table 5 summarizes the
the wind and pressure fields for determining the storm surges estimated maximum storm surges at these three tide gauges.
at the point of interest (Jelesnianski et al., 1992). It was ver- The locations of these three tide gauges are also marked in
ified to have an accuracy of about 0.3 m in root mean square Fig. 6.
error (Lee and Wong, 2007). In order to estimate the extreme storm tides (storm surge
The 6-hourly positions, minimum mean sea level pressures on top of astronomical tide) in Hong Kong and Macao dur-
near the centre, and the radii of maximum winds of the re- ing the passage of Typhoon 1874, the astronomical tide,
constructed track of Typhoon 1874 in Fig. 6 used for running which is caused by gravitational forcing mostly from the
SLOSH are shown in Table 4. It can be seen that Table 4 has Sun–Earth–Moon system, is required. For operational esti-
included the position at 22:00 on 22 September when Ty- mation of the astronomical tide, the Hong Kong Observatory
phoon 1874 started to pick up a northwesterly track and the employs the harmonic method based on decade-long time se-
position at 04:00 on 23 September when the typhoon made ries of recorded tide levels (Ip and Wai, 1990). This method
landfall at Macao. While locating maps of Hong Kong and is, however, limited in its ability to hindcast the astronomical
Macao in the 1880s to obtain coastline information might not tide so long ago, as the parameters of the constituents need
www.clim-past.net/16/51/2020/ Clim. Past, 16, 51–64, 202060 H. Y. Mok et al.: Track reconstruction and storm surge simulation of an 1874 typhoon
Table 3. Hourly positions, hourly minimum mean sea level pres- Table 4. The 13 points of the 6-hourly positions, minimum mean
sures near the centre, and the radii of maximum winds of the recon- sea level pressures near the centre, and the radii of maximum winds
structed possible track of Typhoon 1874 from 08:00 on 22 Septem- of the reconstructed possible track of Typhoon 1874 used for run-
ber to 11:00 on 23 September 1874. ning SLOSH.
DDHH Latitude Longitude Pressure Radius of MMDD/HH Latitude Longitude Pressure Radius of
(local (◦ N) (◦ E) near centre maximum (local (◦ N) (◦ E) near centre maximum
time) (hPa) winds (km) time) (hPa) winds (km)
2208 21.1 119.1 965 60 0921/04 18.0 131.5 965 80
2209 21.1 118.8 965 60 0921/10 18.5 128.3 965 80
2210 21.1 118.5 965 60 0921/16 19.2 125.5 965 80
2211 21.1 118.2 965 60 0921/22 20.0 123.1 965 80
2212 21.1 117.9 965 60 0922/04 20.7 120.5 965 70
2213 21.1 117.6 965 60 0922/10 21.1 118.5 965 60
0922/16 21.1 116.7 960 60
2214 21.1 117.3 965 60
0922/22 21.1 114.9 955 55
2215 21.1 117.0 965 60
0923/04 22.2 113.5 945 25
2216 21.1 116.7 960 60
0923/10 23.6 111.8 980 45
2217 21.1 116.4 960 60
0923/16 24.5 109.4 985 60
2218 21.1 116.1 960 60 0923/22 25.1 107.1 990 60
2219 21.1 115.8 960 60 0924/04 26.0 105.0 995 60
2220 21.1 115.5 960 55
2221 21.1 115.2 960 55
2222 21.1 114.9 955 55 Table 5. The estimated maximum storm surges and maximum
2223 21.2 114.6 955 55 storm tides at North Point and Tai Po Kau in Hong Kong and Porto
2300 21.4 114.4 950 55 Interior in Macao during the passage of Typhoon 1874.
2301 21.5 114.2 950 55
2302 21.8 114.0 950 45 Location Maximum storm Maximum storm
2303 22.0 113.7 950 35 surge (m) tide (m)
2304 22.2 113.5 945 25
2305 22.2 113.1 955 35 North Point (Hong Kong) 2.83 4.881
2306 22.3 112.6 960 40 Tai Po Kau (Hong Kong) 2.83 4.951
2307 22.4 112.2 965 45 Porto Interior (Macao) 2.80 5.372
2308 22.6 111.9 970 45 1 Above Hong Kong Chart Datum. 2 Above Macao Chart Datum.
2309 22.8 111.5 975 45
2310 23.0 111.1 980 45
2311 23.0 110.6 985 45
1969, 1988, and 2007 were exactly four Metonic cycles, each
of 19 years, after 1874.
Using the earliest available 19-year tide level observa-
tions at North Point (1954 to 1972), Tai Po Kau (1969 to
to be inferred from the actual tide level recorded, which was 1987), and Porto Interior (1998 to 2016), the astronomical
not available for that period. tide during 22–23 September 1874 at the three tide gauge
Instead of adopting the harmonic method directly, the as- stations could then be taken as the astronomical tide dur-
tronomical tide during the passage of Typhoon 1874 was ing 22–23 September 1950, 22–23 September 1969, and 22–
estimated by analogue with dates of a similar Sun–Earth– 23 September 2007, respectively.
Moon configuration in this study. Astronomical configura- Combining the estimated storm surges and hindcasted as-
tions could be found by referencing the Multiyear Interactive tronomical tides, the peak storm tides, which are also shown
Computer Almanac (MICA) created by the U.S. Naval Ob- in Table 5, were estimated to be 4.88 m above the Hong
servatory (USNO), which utilizes the Jet Propulsion Labo- Kong Chart Datum (at 04:10 on 23 September) at North
ratory (JPL) DE405 ephemerides for position calculations of Point, 4.95 m above the Hong Kong Chart Datum (at 04:00
the Sun, Moon, and major planets. The geometric geocentric on 23 September) at Tai Po Kau, and 5.37 m above the Macao
positions (equator of J2000.0) of the Sun and the Moon dur- Chart Datum (at 04:00 on 23 September) at Porto Interior.
ing 22–23 September 1874 were computed with MICA and, Figure 7 plots the time series of the hindcasted astronomical
after searching through dates since the 1950s (the earliest that tides, estimated storm surges, and storm tides at North Point
tide level observations were available), it was found that 22– (Hong Kong), Tai Po Kau (Hong Kong), and Porto Interior
23 September 1950, 22–23 September 1969, 22–23 Septem- (Macao) from 11:00 on 22 September to 18:00 on 23 Septem-
ber 1988, and 22–23 September 2007 had higher relevance ber 1874.
to 22–23 September 1874, which is not surprising as 1950,
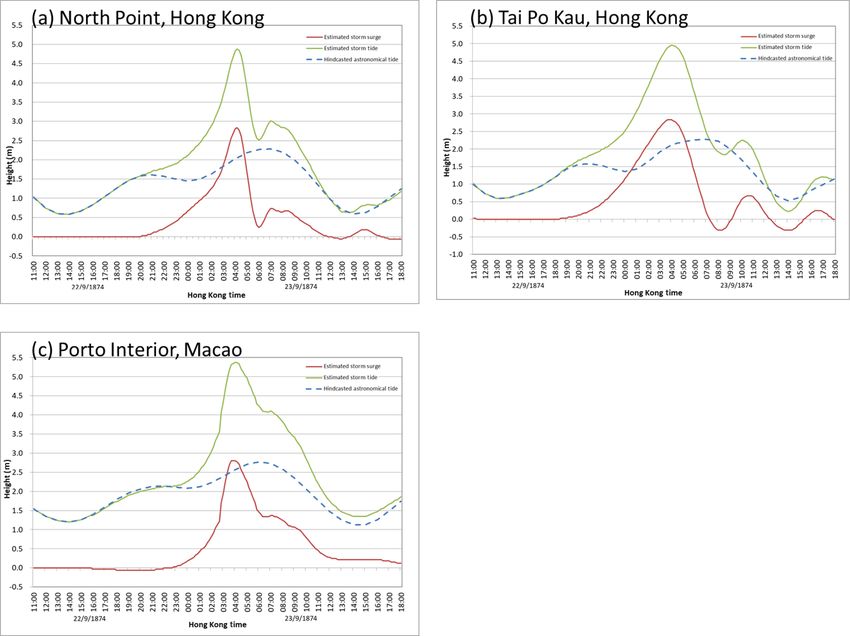
Clim. Past, 16, 51–64, 2020 www.clim-past.net/16/51/2020/H. Y. Mok et al.: Track reconstruction and storm surge simulation of an 1874 typhoon 61 Figure 7. Time series of the hindcasted astronomical tide and estimated storm tide above the Hong Kong Chart Datum and the estimated storm surge at (a) North Point and (b) Tai Po Kau in Hong Kong from 11:00 on 22 September to 18:00 on 23 September 1874. Time series of the hindcasted astronomical tide and estimated storm tide above the Macao Chart Datum and the estimated storm surge at (c) Porto Interior in Macao from 11:00 on 22 September to 18:00 on 23 September 1874. The estimated storm tide is the sum of the estimated storm surge and the astronomical tide. It can be seen that the hindcasted astronomical tide at of 17 October 1874 (Hong Kong Government, 1874) – “by North Point showed a low tide from midnight to around three, the water had risen to from five to six feet (equiva- 02:00 on 23 September, which was consistent with what the lent to 1.52 to 1.83 m) above its high water level” (meaning Harbour Master mentioned in his report in the Hong Kong that the storm tide was 1.52 to 1.83 m above the astronomi- Government Gazette of 17 October 1874 (Hong Kong Gov- cal high tide in Hong Kong). In addition, the difference be- ernment, 1874) – “although, according to ordinary calcula- tween the estimated maximum storm tide of 5.37 m at 04:00 tion it should have been low water at two o’clock”. Further- and the hindcasted astronomical high tide of 2.77 m at around more, given that the observations in the historical documents 06:00 on 23 September at Porto Interior in Macao (which was were recorded by observers at night-time and not at the lo- 2.60 m) was slightly higher than but still considered compa- cations of the respective tide gauge stations, the difference rable with the qualitative description of a rise in sea levels as between the estimated storm tide of 3.69 m at 03:00 and the recorded in the publication O Maior Tufao De Macau – 22 hindcasted astronomical high tide of 2.28 m at around 06:30 e 23 de Setembro de 1874 by Father Manuel Teixeira (Teix- on 23 September at North Point (which was 1.41 m) was eira, 1974) referring to a “storm surge which caused severe slightly lower than but comparable with the qualitative de- flooding of up to 7 feet (equivalent to 2.13 m) above the high scription of the rise in sea levels as recorded in the report of tide level” (meaning that the maximum storm tide was up to the Harbour Master in the Hong Kong Government Gazette 2.13 m above the astronomical high tide in Macao). www.clim-past.net/16/51/2020/ Clim. Past, 16, 51–64, 2020
62                                    H. Y. Mok et al.: Track reconstruction and storm surge simulation of an 1874 typhoon

6    Results and discussion                                       Combining Figs. 5 and 6 reveals that the wind direction at
                                                                  Hong Kong could have gradually veered from northwesterly
By analysing the available weather records in historical doc-     to northeasterly during the day on 22 September and contin-
uments, a possible track of Typhoon 1874, as shown in Fig. 6,     ued to veer easterly and then southeasterly during the evening
was reconstructed in this study. It has to be noted that the      on 22 September and early morning of 23 September. Such a
parts of the reconstructed track over the western North Pa-       sequence of wind direction change would not have occurred
cific and southwestern part of China (plotted in green in         if the typhoon had approached Hong Kong from the south-
Fig. 6) were arbitrarily extended to meet the requirement for     east or south during the day on 22 September.
the input of 13 6-hourly positions for running the storm surge       The quantitative weather observations also helped reveal
model for the estimation of storm surges in Hong Kong and         some special characteristics of the typhoon. Besides a fast-
Macao. The limited weather observations in the Luzon Strait       moving typhoon in the northeastern part of the South China
area, though not sufficient to enable a detailed estimation of    Sea (around 38 km h−1 from the Luzon Strait to the Pearl
the positions of Typhoon 1874 moving over the Luzon Strait        River Estuary), the observations suggested that Typhoon
(plotted in blue in Fig. 6), have provided evidence that the      1874 had undergone rapid intensification as well as a de-
typhoon had likely moved across the Luzon Strait between          crease in storm size to become a more intense and compact
Vigan and Batan with typhoon intensity in the early morning       storm several hours before making landfall at Macao. The
on 22 September. For the reconstructed track over the north-      minimum mean sea level pressure near the centre of Typhoon
eastern part of the South China Sea, the Pearl River Estuary,     1874 decreased from 955 hPa at 23:00 on 22 September to
and western Guangdong (plotted in red in Fig. 6), a more          945 hPa at 04:00 on 23 September, and its radius of max-
quantitative and reliable estimation of the hourly positions,     imum winds decreased from 55 to 25 km during the same
hourly minimum mean sea level pressures near the centre,          period (Table 3). Such rapid intensification before making
and the radii of maximum winds became possible by using           landfall at the southern China coast was not uncommon.
the Jelesnianski tropical cyclone model based on the more         Recent examples include severe typhoon Vincente in 2012
comprehensive weather observations taken in Hong Kong             (Hong Kong Observatory, 2013) and super typhoon Hato in
and Macao. Besides reproducing the trends of the change in        2017 (https://www.weather.gov.hk/en/informtc/hato17/hato.
atmospheric pressure with time at Hong Kong and Macao,            htm, last access: 3 January 2020; Lau and Chan, 2017).
including the rapid fall of atmospheric pressure at Macao            On the other hand, the descriptive weather phenomena in
from 02:00 to 04:00 on 23 September while the atmospheric         historical documents together with the quantitative weather
pressure at Hong Kong was rising (Fig. 4), the atmospheric        observations in Hong Kong could provide information for a
pressure readings taken at Hong Kong and Macao could              rough estimation of the path of the typhoon over the north-
also be reproduced well. Comparing the hourly atmospheric         eastern part of the South China Sea. A better estimation of
pressures at Hong Kong and Macao during the period esti-          this part of the track would be possible if the logbooks of
mated by the Jelesnianski tropical cyclone model based on         the three ships (namely the British ship Onward, American
the hourly positions, hourly minimum mean sea level pres-         ship Highlander, and German ship Amanda) when they were
sures near the centre, and the hourly radii of maximum winds      near Dongsha during the passage of Typhoon 1874 could be
of Typhoon 1874 in Table 3 with the corresponding available       found.
hourly atmospheric pressure observations taken by the Hong           Overall, the quantitative weather observations near Luzon
Kong Harbour Master’s Office and the vessel HMS Princess          and the Pearl River Estuary (Hong Kong and Macao) were
Charlotte in Hong Kong (where the pressure readings were          very useful for estimating a reasonable track of the typhoon
taken near mean sea level and closest to the Hong Kong Ob-        when it passed through the Luzon Strait, the northeastern part
servatory) and the gunboat Tejo in Macao (where the pres-         of the South China Sea, and the Pearl River Estuary. The
sure readings were taken near mean sea level and at Porto In-     study results demonstrated the usefulness of weather obser-
terior) in Table S1, the root mean squares of the differences     vations in historical documents as well as the importance and
were 4.0, 4.6, and 2.7 hPa, respectively. The differences were    value of international joint efforts toward climatological data
even smaller for the period from 20:00 on 22 September            rescue and the retrieval of historical climate data for studies
(when the storm surge at North Point started to rise and be-      of historical weather events.
fore the typhoon picked up a northwesterly track) to 04:00 on        According to the reconstructed track, Typhoon 1874 re-
23 September (when the storm surges at North Point, Tai Po        sembled the tracks of the typhoons in Table 1, which brought
Kau, and Porto Interior were almost at the highest and the ty-    severe storm surges to Hong Kong. The reconstructed track
phoon had made landfall at Macao), with root mean squares         of the typhoon itself can be used as a possible scenario for
of differences of 2.7, 3.1, and 1.7 hPa, respectively. Further-   the assessment of the present and future storm surge risk in
more, the reconstructed track also matched well with the ob-      the Pearl River Estuary together with the other historical ty-
served wind direction changes at Hong Kong reported by the        phoons.
Harbour Master and HMS Princess Charlotte, as shown in               This study also estimated the storm surges and storm tides
Table S2, during the approach and departure of the typhoon.       at North Point and Tai Po Kau in Hong Kong and Porto Inte-

Clim. Past, 16, 51–64, 2020                                                                    www.clim-past.net/16/51/2020/
H. Y. Mok et al.: Track reconstruction and storm surge simulation of an 1874 typhoon 63
rior in Macao brought by Typhoon 1874 by running SLOSH global average sea level rose by 1.7 mm yr−1 during the pe-
using the reconstructed track. It can be seen that both the es- riod 1901–2010 (IPCC, 2013). Assuming a similar rate of sea
timated maximum storm surge and storm tide at North Point level change at the Pearl River Estuary, the difference in the
in the Victoria Harbour (shown in Table 5) were higher than mean sea levels could roughly cause an addition 0.1 to 0.2 m
those brought by the typhoons in Table 1, i.e. higher than to the storm tides estimated in this study.
those experienced since the establishment of the Hong Kong Given the above uncertainties, care has to be taken when
Observatory in 1883, including the recent records set by su- comparing the storm surges and storm tides of Typhoon 1874
per typhoon Mangkhut on 16 September 2018 (maximum estimated in this study with the observed storm surges and
storm surge of 2.35 m and storm tide of 3.88 m above the storm tides brought by other historical typhoons.
Hong Kong Chart Datum at Quarry Bay in the Victoria Har-
bour). Such an extreme sea level, which is probable in the
history of Hong Kong according to this study, revealed that 7 Conclusions
the risk assessment of extreme sea level in Hong Kong based
on available instrumental records (since the 1950s) after the A possible track of Typhoon 1874 was reconstructed through
establishment of the Hong Kong Observatory (in 1883) might an analysis of historical qualitative and quantitative weather
be on the optimistic side. A more detailed frequency analysis observations in the Philippines, the northern part of the South
of extreme sea levels, taking Typhoon 1874 and other histor- China Sea, Hong Kong, Macao, and Guangdong recorded
ically significant storm surge events such as the typhoons in in various historical documents. The magnitudes of the as-
1906, 1936, and 1937 in Table 1 into account, is essential for sociated storm surges and storm tides in Hong Kong and
a more realistic storm surge risk assessment for Hong Kong. Macao were also quantitatively estimated using a storm surge
However, it should be noted that, besides the uncertainty of model and analogue astronomical tides based on the recon-
the typhoon track (position, intensity, and storm size in terms structed track. The results show that both the maximum
of radius of maximum winds) and the uncertainty of the es- storm tide (4.88 m above Hong Kong Chart Datum) and max-
timation by SLOSH, the estimated storm surges in Hong imum storm surge (2.83 m) brought by Typhoon 1874 at the
Kong and Macao were also subjected to the uncertainty of Victoria Harbour in Hong Kong are higher than all the exist-
the change in the local bathymetry and coastline since 1874. ing records since the establishment of the Hong Kong Obser-
As the bathymetry and coastline of the Pearl River Estuary, vatory in 1883.
including Hong Kong and Macao in 1874, were not readily This study demonstrates the importance and value of
available, the earliest readily available digitized bathymetry weather observations in historical documents as well as in-
and coastline of the region from the early 1990s were used ternational joint efforts toward climatological data rescue and
for running SLOSH in this study. Due to the rapid develop- the retrieval of historical climate data for studies of histori-
ment of the region in the past 100 years or so, the bathymetry cal weather events. Furthermore, it reveals that the risk as-
and coastline of the region have changed quite a lot and this sessment of extreme sea level in Hong Kong based on all
would cause a certain degree of uncertainty in the estimated available records after the establishment of the Hong Kong
storm surges. To show the sensitivity of the changes in topog- Observatory since 1883 might be on the optimistic side, and
raphy and bathymetry, a comparison of the SLOSH results a more detailed frequency analysis of extreme sea levels, tak-
for Typhoon 1874 using topography and bathymetry data ing Typhoon 1874 and other historically significant storm
in the 1990s and 2010s was conducted. The results showed surge events such as the typhoons in 1906, 1936, and 1937
that the maximum storm surges at North Point, Tai Po Kau, into account, is essential for a more realistic storm surge risk
and Macao using topography and bathymetry data from the assessment for Hong Kong.
1990s (2010s) were 2.83 m (2.71 m), 2.83 m (2.77 m), and
2.80 m (2.68 m), respectively. Despite significant coastal de-
velopment since the 1990s to 2010s, such as reclamations Data availability. All historical data in Sect. 2 are available in a
and the building of new airports, the differences of the esti- public domain. The storm surge and storm tide data generated by
SLOSH as well as the astronomical tide data estimated in this study
mated maximum storm surges at these three tide gauge sta-
are available from the Hong Kong Observatory on request.
tions generated by Typhoon 1874 were less than 0.12 m, well
within the accuracy of SLOSH of about 0.3 m in root mean
square error (Lee and Wong, 2007). Supplement. The supplement related to this article is available
Furthermore, the difference between the mean sea levels in online at: https://doi.org/10.5194/cp-16-51-2020-supplement.
1874 and those in the years of astronomical tides used in this
study for estimating the storm tides (1950 for North Point,
1969 for Tai Po Kau, 2007 for Porto Interior in Macao) could Author contributions. HYM designed and led the study. WHL
also bring some uncertainties to the storm tides estimated in searched the historical weather observations for the study. DSL con-
this study. According to the Fifth Assessment Report of the ducted the analysis of historical weather observations and the storm
Intergovernmental Panel on Climate Change (IPCC-AR5), surge simulation. WCW worked out the methodology to estimate
www.clim-past.net/16/51/2020/ Clim. Past, 16, 51–64, 202064 H. Y. Mok et al.: Track reconstruction and storm surge simulation of an 1874 typhoon
the astronomical tides for storm tide estimation. All the authors par- Hong Kong Observatory: Tropical Cyclones in 2012, Hong Kong,
ticipated in the discussion. HYM wrote the paper with contributions China, 2013.
from all coauthors. Ip, S. F. and Wai, H. G.: An application of Harmonic Method to
Tidal Analysis and Prediction in Hong Kong. R.O.H.K. Techni-
cal Note (Local) No. 55, Hong Kong Observatory, Hong Kong,
Competing interests. The authors declare that they have no con- China, 1990.
flict of interest. IPCC: Climate Change 2013: The Physical Science Basis. Contri-
bution of Working Group I to the Fifth Assessment Report of the
Intergovernmental Panel on Climate Change, edited by: Stocker,
Acknowledgements. The authors are grateful to Rob Allan and T. F., Qin, D., Plattner, G.-K., Tignor, M., Allen, S. K., Boschung,
Clive Wilkinson for their help in locating and providing the in- J., Nauels, A., Xia, Y., Bex, V., and Midgley, P. M., Cambridge
valuable historical documents for this study. The authors also ex- University Press, Cambridge, UK and New York, USA, 2013.
press appreciation for comments provided by Chi Ming Shun and Jelesnianski, C. P.: A numerical calculation of storm tides induced
Sai Tick Chan on the draft paper. by a tropical storm impinging on a continental shelf, Mon.
Weather Rev., 93, 343–358, 1965.
Jelesnianski, C. P., Chen, J., and Shaffer, W. A.: SLOSH: Sea, Lake
and Overland Surges from Hurricanes, NOAA Technical Report
Review statement. This paper was edited by Hans Linderholm
NWS 48, USA, 1992.
and reviewed by three anonymous referees.
Lau, D. S. and Chan, S. T.: Storm surge risk in Hong Kong as-
sociated with Super Typhoon Hato (1713), Fourth International
Workshop on Tropical Cyclone Landfall Processes (IWTCLP-4),
References 5–8 December 2017, Macau, China, 2017.
Lee, T. C. and Wong, C. F.: Historical Storm Surges and Storm
Arquivo Historico De Macao: The Times of Typhoon, Macao, Surge Forecasting in Hong Kong, JCOMM Scientific and Tech-
China, 2014. nical Symposium on Storm Surges (SSS), 2–6 October 2007,
Atkinson, G. D. and Holliday, C. R.: Tropical Cyclone Minimum Seoul, Republic of Korea, 2007.
Sea Level Pressure/Maximum Sustained Wind Relationship for Lu, R.: Historical Tidal Disasters in China, China Ocean Press, 1st
the Western North Pacific, Mon. Weather Rev., 105, 421–427, edition, China, CSBN:13193.0309, 1984 (in Chinese).
1977. Macao Government: The Bulletin of the Province of Macao and
China Mail: The China Mail published on 23 September 1874, Timor (Boletim da Provincia de Macau e Timor) published on 3
Hong Kong, China, 1874. and 24 October 1874, Macao, China, 1874.
García-Herrera, R., Ribera, P., Hernández, E., and Gimeno, L.: Ty- Marvin, C. F., Kimball, H. H., and Guyoy, A.: Smithsonian Me-
phoons in the Philippine Islands 1566–1900, available at: http: teorological Tables, 4th revised edition, Smithsonian Institution,
//www.ucm.es/info/tropical/selga-i.html, last access: 3 January City of Washington, USA, 1918.
2020. Ou, B.: Typhoons in Macao, Macao Magazine, Issue 101, published
Heywood, G. S. P.: Hong Kong Typhoons, Hong Kong Observatory, on 11 September 2014, Macao, China, available at: http://www.
Hong Kong, China, 1950. macauzine.net/?action-viewnews-itemid-736 (last access: 3 Jan-
Ho, P. Y.: Weathering the Storm, Hong Kong University Press, Hong uary 2020), 2014 (in Chinese).
Kong, China, 2003. Peterson, M. S.: Storm Surge Statistics, Hong Kong Observatory
Hong Kong Daily Press: The Hong Kong Daily Press published Technical Note (Local) No. 20, Hong Kong, China, 1975.
on 24 & 25 September 1874 (barometer readings and damages), Teixeira, M.: O Maior Tufao De Macau – 22 e 23 de Setembro de
Hong Kong, China, 1874. 1874, Tip. Da Missao do Padroado, Macao, China, 1974 (in Por-
Hong Kong Government: The Hong Kong Government Gazette, tuguese).
17 October 1874, Hong Kong, China, 1874.
Clim. Past, 16, 51–64, 2020 www.clim-past.net/16/51/2020/You can also read