2015 Investor Presentation - Boca Raton Resort & Club February 18, 2015 - Investor Relations | Newell Brands
←
→
Page content transcription
If your browser does not render page correctly, please read the page content below

2015 Investor Presentation
            Boca Raton Resort & Club
                   February 18, 2015
Presenting Today

Martin E. Franklin
Founder and Executive Chairman

James E. Lillie
Chief Executive Officer

                                 2
Cautionary Statement

Please note that in this presentation, we may discuss events or results that have not yet occurred or been realized, commonly referred to as forward-looking
statements. The Private Securities Litigation Reform Act of 1995 provides a safe harbor for forward-looking statements made by or on behalf of the Company. Such
discussion and statements will often contain words as expect, anticipate, believe, intend, plan and estimate. Such forward-looking statements include statements
regarding the Company’s adjusted basic and diluted earnings per share, expected or estimated revenue, the outlook for the Company’s markets and the demand for
its products, estimated sales, meeting financial goals, segment earnings, net interest expense, income tax provision, earnings per share, restructuring costs and other
non-cash charges, cash flows from operations, consistent profitable growth, free cash flow, future revenues and gross operating and EBITDA margin improvement
requirement and expansion, organic net sales growth, performance trends, bank leverage ratio, the success of new product introductions, growth in costs and
expenses, the impact of commodities, currencies, and transportation costs and the Company’s ability to manage its risk in these areas, repurchase of shares of
common stock from time to time under the Company’s stock repurchase program, our ability to raise new debt, and the impact of acquisitions, divestitures,
restructurings and other unusual items, including the Company’s ability to successfully integrate and obtain the anticipated results and synergies from its
consummated acquisitions. These projections and statements are based on management's estimates and assumptions with respect to future events and financial
performance, and are believed to be reasonable, though are inherently difficult to predict. Actual results could differ materially from those projected as a result of
certain factors. A discussion of factors that could cause results to vary is included in the Company’s periodic and other reports filed with the Securities and Exchange
Commission. The Company undertakes no obligation to update any forward-looking statement, whether as a result of new information, future events or otherwise.

This presentation also contains non-GAAP financial measures. For purposes of Regulation G, a non-GAAP financial measure is a numerical measure of a company's
historical or future financial performance, financial position or cash flows that excludes amounts, or is subject to adjustments that have the effect of excluding
amounts, that are included in the most directly comparable measure calculated and presented in accordance with GAAP in the statements of operations, balance
sheets, or statements of cash flows of the Company; or includes amounts, or is subject to adjustments that have the effect of including amounts, that are excluded
from the most directly comparable measure so calculated and presented. Pursuant to the requirements of Regulation G, the Company has provided reconciliations of
the non-GAAP financial measures to the most directly comparable GAAP financial measures. These non-GAAP measures are provided because management of the
Company uses these financial measures in monitoring and evaluating the Company’s ongoing financial results and trends. Management uses this non-GAAP
information as an indicator of business performance, and evaluates overall management with respect to such indicators. Additionally, the Company uses non-GAAP
financial measures because the Company's credit agreement provides for certain adjustments in calculations used for determining whether the Company is in
compliance with certain credit agreement covenants, including, but not limited to, adjustments relating to non-cash impairment charges of goodwill, intangibles
and other assets, certain restructuring costs, acquisition-related and other costs, non-cash purchase accounting adjustments, elimination of manufacturer’s profit in
inventory, Venezuela hyperinflationary and foreign exchange-related charges, non-cash stock-based compensation costs, gain (loss) on sale of certain assets, loss on
early extinguishment of debt, non-cash original issue discount amortization and other items, as applicable.

These non-GAAP measures should be considered in addition to, not a substitute for, measures of financial performance prepared in accordance with GAAP.

                                                                                                                                                                           3   3
Jarden Overview and Performance
Investment Highlights
• A well-diversified, global consumer products company
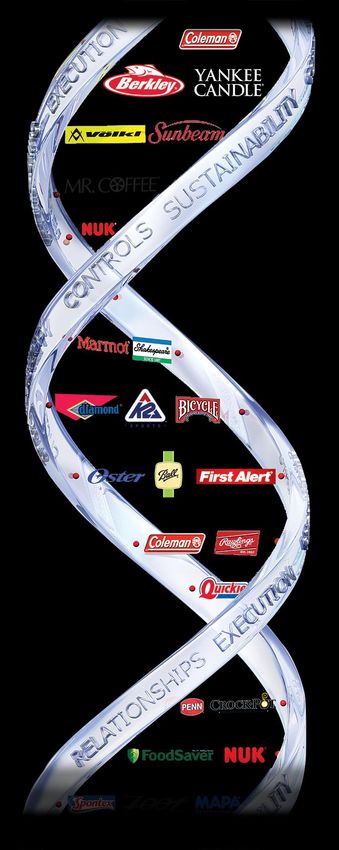
• Over 120 powerful brands that consumers trust
⁻ The brands of everyday life TM
⁻ Defined by Jarden’s DNA as our foundation
• Proven track record of strong financial performance over 13+ years
• Defined and measurable long-term financial goals
⁻ Designed to deliver diluted adjusted EPS of $4.00 by YE 2018
• Strong balance sheet and cash flow generation capabilities
• Strategic deployment of capital Our Largest Brands
$150 Million Sales $800+ Million
5
Growth Strategy

     1             2                3                   4                    5
   BUILD         EXPAND         INNOVATE           LEVERAGE               ACQUIRE

Organic growth   Geographic       Brand equity      Cross business          Remain
                  expansion       investment;     unit and segment      disciplined and
                      +          provide value    leverage in selling    opportunistic
                    Brand       through leading   and infrastructure       acquirers
   Driven by
                  expansion       brands that
price, volume,
                 to adjacent   consumers desire     Jarden “sister      Consistent with
strong brands
                  categories        and trust         company”             Jarden’s
 and market
                                                       product,           acquisition
  share wins
                               Increase market     geographic and           criteria
                               share & increase   channel support +
                                   margins            expertise

                                                                                          6
Branded Consumables                                                                              Market Position in Core Categories

                                                                                                                    Baby Care*

2014 Net Sales of $3.0 billion
                                                                                                           Boxed Plastic Cutlery
2014 Segment Earnings Margin of 17.4%
                                                                                                                        Firelogs
Brands which are synonymous with their categories

Strong, stable cash flow generation                                                                             Fresh Preserving

Diversified product mix with leadership positions                                                           Gloves & Sponges **
in most categories
                                                                                                          Matches & Toothpicks

                                                                                                                  Playing Cards

                                                                                                          Premium Scented Candles

                                                                                                            Smoke & CO Alarms

 BRANDED CONSUMABLES                                                  OUTDOOR SOLUTIONS                                                  CONSUMER SOLUTIONS

                                                           Leading provider of primarily niche, affordable,
                                                             consumable household staples used in and
                                                                         around the home
                                        Note: Positions noted above refer to the U.S. market unless indicated otherwise.
                                        * Category includes aggregate sales of pacifiers, sippy cups, bottles, and other oral development and feeding products.
                                        ** Home-use gloves and sponges in EU G5 market.
                                                                                                                                                                  7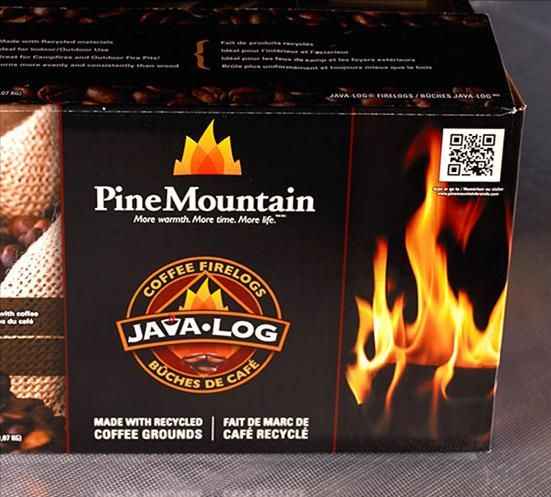
Outdoor Solutions                                                                                      Market Position in Core Categories

                                                                                                               Baseball Gloves & Balls

 2014 Net Sales of $2.7 billion
                                                                                                                       Camp Stoves
 2014 Segment Earnings Margin of 11.0%

 World’s largest sports equipment company
                                                                                                                                Fishing
 Leadership positions in US, Europe and Japan

 Extensive distribution network spanning mass,                                                                              Lanterns
 sporting goods, specialty, internet and team channels

                                                                                                                       Skis & Bindings

                                                                                                                       Sleeping Bags

                                                                                                                                 Tents

 BRANDED CONSUMABLES                                               OUTDOOR SOLUTIONS                                                CONSUMER SOLUTIONS

                                                   Global provider of innovative, recreational and
                                            high-performance products designed to maximize consumers’
                                                             enjoyment of the outdoors

                                             Note: Positions noted above refer to the U.S. market unless indicated otherwise.
                                                                                                                                                         8
Consumer Solutions                                                                                             Market Position in Core Categories

                                                                                                                         Blenders
2014 Net Sales of $2.2 billion

2014 Segment Earnings Margin of 16.2%                                                                                      Coffee Makers
Strong portfolio of brands with leading positions across
core categories
                                                                                                                       Slow Cookers
Most broadly distributed brand portfolio in core categories
throughout the Americas                                                                                         Vacuum Packaging
Distribution channels include mass merchants, warehouse
clubs, specialty retailers, direct-to-consumer and international
                                                                                                             Air Purifiers/Humidifiers

                                                                                                                    Warming Blankets

 BRANDED CONSUMABLES                                                       OUTDOOR SOLUTIONS                                          CONSUMER SOLUTIONS

                                  Global provider of products designed to simplify the daily lives of
                                 consumers in and around the home; making everyday experiences,
                                                          more satisfying

                                 Note: Positions noted above refer to the U.S. market unless indicated otherwise.
                                                                                                                                                           9
Operating Segments
                                                                Segment Breakdown
                                                             2014 Net Sales: $8.3 billion

• Jarden is well diversified across             Branded                                       Outdoor
                                              Consumables                                     Solutions
  operational segments and                        36%                                           33%
  customers

• Manufacturing in 70 plants
                                                        Process                             Consumer
  across 16 countries                                  Solutions                            Solutions
                                                          5%                                  26%

• Business operations in 40
                                                               Net Sales by Customer
  countries                                                                   Other
                                                                              64%

• Over 30,000 employees
                                      Sporting Goods
                                             3%                                                   Mass A
• Focus on operational                                                                             13%
                                       Specialty A
  excellence                              1%
                                         Int'l Mass C                                           Mass B
                                               1%                                                 4%
                                          Int'l Mass B                                        Club A
                                                1%                                              3%
                                                  Int'l Mass A                           Club B
                                                        1%                                1%
                                                             Dot Com
                                                               4%    Mass E    Mass D   Mass C
                                                                      1%        1%       2%

                                                                                                           10
Geographic Revenue Mix
2014 US/International Mix of 61% / 39%
• Gradually shift from US /
International mix of 61%/39%
to 50%/50%
• Cross-channel opportunities
― Use each business’
geographic strength to
` support expansion of
“sister” Jarden businesses
• Specific targeted growth
initiatives with incremental
resources focused on Asia,
Latam, and EMEA
Existing markets > 1.0% of 2014 Net Sales
Existing markets < 1.0% of 2014 Net Sales
11Jarden’s DNA
• Strive to be better • Support the individual,
but encourage teamwork
• Retain and develop the
best talent • Think lean; act large
• Listen, learn, innovate • Have fun, work hard, execute
• Deliver exceptional • Enhance the communities
financial results in which we operate
Jarden’s DNA is the foundation for strategic,
operational and financial initiatives and
ultimately it is the key to our success
12Our Evolution Into A Leading Global
Consumer Products Company 2014+:
Standing
2012-2014: Above the
Expanding Revenue, Forest
Geographic Reach,
2007–2012: Leveraging the Margin & Cash
o White sheet of
Platform for Predictable & Generation
paper
Sustainable Growth o Talent
2005–2007:
development
Strengthening &
o Revenue expansion o D2C expertise
Investing in the
• Brand-building approach o Geographic expansion o Intl platform
Platform leverage
o Increased investment in o Opportunistic
brand equity acquisition o Process redesign
o Product innovation and o Leverage platform for o New financial
• Infrastructure investments: goals
o development focus margin expansion
2001–2005: IT systems
o Business management o Cross-brand collaboration o Gross margin &
Setting the working capital
processes o Cross-selling
Foundation o Partnerships efficiencies
o Internal controls
o Talent development o Shared technologies o Disciplined & creative
o Process, planning and o Idea generation and access to capital
• Established a knowledge exchange markets
forecasting
platform for
growth through a
series of
acquisitions
13Strategic Priorities
• Deliver innovative products that present great value
through leading brands that consumers desire and trust
• Capitalize on our strong core to expand by category,
by channel, and by geography
• Deliver earnings growth well above our rate of
sales increase
• Continue to optimize our capital structure and effectively
deploy capital for the benefit of our shareholders
14Delivering Consistent Performance
through Jarden’s Business System
Our business and operating system drive performance and execution consistency
FINANCIAL DISCIPLINE: Focused on delivering consistent and predictable results
OPERATING PLATFORM LEVERAGE: Unified management systems and evaluation across
diverse businesses
CONTINUOUS INNOVATION: Five-year detailed planning on products to meet changing
consumer needs and desires
UNIQUE LEADERSHIP BRANDS: Many brands synonymous with their product categories;
driving consumer POS
SYNERGIES AND SCALE: Creating market insights, revenue and margin expansion
opportunities faster and more cost effectively than as standalone businesses
Rigorous business analysis and operating systems drive effectiveness
15Robust Strategic Planning Drives Growth
BASE
BUSINESS 1 New Distribution
Channels
2 Current Distribution
Channels
DISCIPLINED OPERATIONAL
3 New
Products
ANALYSIS & MANAGEMENT
4 Margin
Expansion
Assessment and approval of
“Base Business” and “Target
5 Investment
(Mktg, R&D, and CapEX) Growth” initiatives drive
Jarden’s long term Financial
6
TARGET International Goals
GROWTH Growth
7 Targeted
Growth Initiatives
5 year roadmap
2014 2018
16Organic Cross Selling Opportunities Drive Value
Across the Jarden Platform
Cross-Selling Cross-Channel Cross-Brand Collaboration
Opportunities Opportunities Opportunities
• Adjacent selling opportunities within our • Streamlining distribution costs • To help drive new product innovation
family of brands (e.g. candles with
lighters, matches and firelogs) • Using scale to achieve production
• Expanding each business’ distribution
synergies
network by utilizing the platform of
• Customer / retail network can be grown the portfolio
by leveraging Jarden’s relationships • Cross-brand support and knowledge
across our portfolio of brands exchange
• Leveraging Jarden’s footprint to
facilitate each business’ expansion into
• Jarden’s disciplined processes and
• Cross-selling opportunities, such as new markets and geographies
planning to provide unique insights
technical apparel with related sports and market intelligence; further
equipment developing opportunities across the
• Many businesses with complementary
geographic strengths providing “sister“ platform
help
New Revenue Drivers, Enhanced Scale and Increased Portfolio Synergies
17The Council Approach to Scale & Leveraging SG&A
Select Examples:
2005-2008 2009-2011 2012-2014 2015+
STRATEGY DTC Council
Procurement Policy
• Cultural adoption R & D Council Governance
• Policies and procedures LATAM/APAC
• Collaborative training OEM Sourcing Council Professional Services
• Succession planning
Global T&E Solutions
P&L Sensitivity
Geopolitical Risk
SELF-SUFFICIENCY Quality/Warranty Council
• Standard practices
• Benchmarking Manufacturing
• Corrective action plans Council Budget Collaboration
MATURITY
• Cross-BU solution design Customs and Trade Council
Temp Labor Team Asia Commodity Team
BASICS Europe Commodity Teams
• Team creation Commodities
• Supplier coordination Hedging
• Knowledge sharing
• Data collection Marketing Council Acquisition
Integration
30+ multi-functional councils
Collaboration Travel Team
Transportation increasing COLLABORATION and
Team
Leverage Social Compliance
ADVICE across Jarden businesses,
N.A. Commodity
Teams Council LEVERAGING Jarden’s growing scale
Advisory
Note: Select Councils shown on chart given 30+ active counsels.
18Seasonal Staples Products;
4-6 Month Order Curve
2014 2015
AUG SEP OCT NOV DEC JAN FEB MAR APR MAY JUN JUL AUG SEP OCT NOV DEC
Aug to Nov
Multi-year budget BOTTOM-UP PROCESS
• Per product category
planning • Per customer account
• Per growth initiative
KEY METRICS HORIZON BUSINESS UPDATE
• Sales & Profitability • Month • Marketing initiatives
Monthly budget • Investment spending • Quarter (QTD and outlook) • Competitive activity
• Working capital • Annual (YTD and outlook) • Customers
monitoring • Inventory metrics BREAKDOWN • Target growth initiatives
• Warranty expenses • Business unit
• Operational cash flow • Product category
• FX impact • Geography
Quarterly &
Mid-year budget REVISION OF BOTTOM-UP
• Per customer account
reforecast • Per product line
• Per growth initiative
Continuous Weekly sales flashes, coupled with eight week rolling cash forecasts,
Adjustment to supplemented with ongoing commodity hedging
Protect Pricing &
Budget Multiple TOUCHPOINTS building an accurate
forward-looking view of the year, allowing for
continuous ADJUSTMENT
19Historical Performance & Visibility Curve Example
CAGR 30%
($’s in millions) $8,287
$7,356
Net Sales $6,023
$6,680 $6,696
$5,383 $5,153
$4,660
$3,846
$3,189
$368 $588 $839
2002 2003 2004 2005 2006 2007 2008 2009 2010 2011 2012 2013 2014
CAGR 25%
Adjusted EBITDA
$1,104
(Segment Earnings)(1) $936
$791 $814
$710
$609 $606
$502
$419
$298
$75 $87 $115
2002 2003 2004 2005 2006 2007 2008 2009 2010 2011 2012 2013 2014
CAGR 21%
Cash Flow from Operations $641 $669 $669(2)
$480
$427
$305 $289
$241 $236 $250
$71 $74 $70
2002 2003 2004 2005 2006 2007 2008 2009 2010 2011 2012 2013 2014
Note: For a reconciliation of Non-GAAP numbers please refer to the Supplemental slides posted on Jarden’s website.
1. Non-GAAP – excluding restructuring, non-operational and non-cash charges and credits.
2. For full year 2014, cash flow from operations was $669 million before a $42 million cash charge primarily representing the cost of interest
acceleration related to the early repayment of Jarden’s 2020 bonds. 20Investment Highlights
Long-Term Financial Goals
 Delivering Long-Term Average Annual Organic Sales Growth of 3% to 5%

                                           Continuing to Leverage SG&A

Expanding Segment Earnings Margins +150 bps from the 12.7% FY13 Level

      Generating Average Annual Earnings Growth of at Least 10%

         Producing at Least $4.0 Bn of Cash Flow from Operations
                        over Five Years (2014-18)(1)

         Targeting Year End Bank Leverage Ratio at or Below 3.0x

            Delivering Diluted Adjusted EPS of $4.00 by YE 2018(2)

      Note: (1) Cash flow from operations delivered from 2009-2013 was $2.5 Bn
            (2) Diluted adjusted EPS of $4.00 reflects the November 2014, 3-for-2 share split and is unchanged and equivalent to the pre-split target value of $6.00
                                                                                                                                                                       22
Jarden’s Track Record of Organic Performance
Has Been Enhanced by Disciplined Acquisitions
Indexed Share Price Performance since 2001 (1) Prioritization
(Indexed price)
4500% JAH:
+~4,325%(2)
4000%
October 2013:
• Drive consistent,
$1.75bn profitable, organic
3500%
January 2005:
growth
$845mm April
3000% 2007:
$400mm
April 2010: • Opportunistic
June July $450mm
2500% 2004: 2005: acquisitions; always
$625mm
$240mm August 2007:
$1.2bn
on the radar
2000%
February 2003:
1500% $110mm • Bandwidth to take
advantage of
1000% April accretive acquisition
2002:
$160mm S&P Mid- opportunities
500% September Cap 400:
2003: $155mm ~260%
S&P 500:
0 ~115%
Jan-02 Jan-04 Jan-06 Jan-08 Jan-10 Jan-12 Jan-14
Jarden Corporation S&P 500 S&P Mid Cap 400
Since Jarden’s 2001 Inception, the Stock has Delivered an Annual Compound Return of over 33%
1. Acquisitions shown reflect transactions that contributed more than 10% of revenue at the time of the acquisition.
2. Performance reflects total stock appreciation from Jarden’s inception, defined as market close 9/21/2001 as Martin E. Franklin and Ian G.H. Ashken were officially appointed as senior management on 9/24/2001, through 12/31/2014.
2323Execution: Jarden has Delivered Uncommon Value
Across Multiple Time Periods
Setting Aspirational Targets to Drive Performance Uncommon Value
• New long-term financial goals were established for FY Jarden consistently has the highest
‘14 through FY ‘18 stock return vs. its peers in the S&P
Consumer Staples index, across
• Jarden achieved record 2014 performance
multiple time periods
• Today, Jarden’s market cap is in excess of $9Bn
• In 2013, Jarden exceeded the January 2010 stretch Return (1) Rank (2)
goal of doubling adjusted EPS within five years
2014 +17% #1
• The goal was achieved a year ahead of schedule
• Market cap growth of over 185% from 2010- 2013 +78% #1
2013 from $2.9Bn to $8.3Bn
2012 +73% #1
• In January 2005, post closing the American Household
acquisition, the Board set ambitious 5 year goals for
5-Year +248% #1
the Company
• Jarden’s market cap grew by over 105% 10-Year +272% #1
• Over the same period, the S&P 500 Index
declined by 6% Since 2001 +~4,325% #1
(inception) (3)
.
1. Performance reflects total stock appreciation over the listed periods as of 12/31/2014.
2. Ranking based on performance compared to the household and personal care peer group in the S&P Consumer Staples Index.
3. Inception point defined as market close 9/21/01 as Martin E. Franklin and Ian G.H. Ashken were officially appointed as senior management on 9/24/01.
2424Jarden has Supported Organic Growth
through Significant Brand Equity Investment
($ in millions) Brand Equity and Product Innovation =
$500
Higher Prices (i.e. greater value) and Higher GM
Each year ~30% of sales come from products launched
$400
within past three years
$300 Creative Go-To-Market Initiatives
Relevant consumer outreach utilizing multi-media
$200 approach & Point of Purchase programs
$100 Investment Now at Appropriate Level
~6% of Net Sales
$0
2008 2009 2010 2011 2012 2013 2014
4.5% 4.7% 4.9% 4.9% 5.7% 5.7% 5.6% % of Net Sales
Note: Excludes Yankee Candle pre 2013. Figures above include marketing and R&D expenses.
25Jarden’s Acquisition Criteria
Unchanged Since Jarden’s 2001 Inception:
1• Category-leading positions in niche consumer markets with defensible
moats around the business
2 Recurring revenue with margin expansion opportunities
3• Strong cash flow characteristics
4• Talented Management team
5 Attractive transaction valuations, accretive from day one pre-synergies
26Effective Deployment of Capital
Share Capital Markets Acquisitions
Repurchases Activities
• Jarden acquired over $200 million of • Amended and extended the senior • In Q1 2015, Jarden acquired Dalbello
its shares in 2014 secured credit facility from ‘16 to ’19 and Squadra
in 4Q14
• Issued Euro 300 million of senior
• There is ~$300 million remaining • Yankee Candle become part of
notes due 2021 in 3Q14. The notes
under Jarden’s current share Jarden’s organic performance in Q4
bear an annual interest rate
repurchase authorization 2014
of 3¾%
• Issued $690 million of senior
subordinated convertible notes due • Q3 2014 acquisitions of Rexair and
2034 in 1Q14. The notes bear an Millefiori
annual interest rate of 1⅛% with
a conversion price of approximately
$49.91 • Q2 2014 acquisition of Cadence
• Paid down ~$480 million of debt
through redemption of 7.5% USD and
Euro senior subordinated 2020 notes
Balanced Approach Intended to Maximize Long-Term Shareholder Value
27Targeted Growth Initiatives
TGIs are Multi-year Initiatives Intended to Drive Growth Above our Fleet Average
• Yankee Candle development of cross-channel, cross-brand and international growth opportunities
• Marmot clothing, equipment and retail stores to gain category fair share
• Exofficio clothing brand growth through comfortable performance
• Rawlings brand expansion; Japan, re-establishing operations for growth in second largest baseball
market, football and basketball category authentication
• Tailgating initiative to leverage multiple Jarden brands and licenses such as the NFL, NCAA, and MLB
• Zoot triathlon and specialty running gear
• Appliance and Safety devices as integrated smart home and security / wellness
• NUK baby and juvenile products international growth and US category expansion
• Ski boots and helmets, Marker broadened brand position as protective snow
• Direct-to-consumer and dot com channel focus; customized and unique products
28Yankee Candle Company Overview
Summary 2012 Net Sales
International
14%
• Yankee Candle is #1 premium scented candle(2)
(1)
Direct to
• 46-year history of category leadership and growth Wholesale
Consumer
58%
28%
• Yankee Candle distributes its products through a
diversified, omni-channel platform
2014 Net Sales
• Cross selling through Jarden sister companies
International
23%
• Vertically integrated business model
Direct to (1)
Consumer
• Seasonal staples characteristics 58%
Wholesale
24%
Ownership History:
1969: Founded 1998: Sold to 1999: Initial 2007: Purchased by 2013: Acquired by
Forstmann Little public offering Madison Dearborn Partners Jarden 10/03/2013
Note: For a reconciliation of Non-GAAP numbers please refer to the Appendix of this presentation.
1. Includes Retail Stores, YankeeCandle.com, Catalogue and Fundraising
2. Market position refers to the US market
30Global Candle and Home Fragrance
Market is $25 Billion and Growing
Per Capita
Retail Sales Spend
North America $8.9 $25.45
W. Europe $7.6 $17.01
APAC $4.4
$1.06
Latin America $1.8 $3.04
MEA $1.5 $1.14
E. Europe $1.4 $4.74
$0 $2 $4 $6 $8 $10
Unscented Candles Scented Candles (Mass) Scented Candles (Premium)
Home Fragrance (Mass) Home Fragrance (Premium)
Source: Euromonitor, Kline (US, UK, GER), Mintel, UN, CIA Factbook, Bain primary research, NCA, ECA, USITC, Eur. Chemical Bulletin.
Note: Dollars in billions. Figures represents retail sales.
31Enhancing the Foundation
• Yankee Candle was acquired in Q4 2013
• First six months were spent developing a strategic plan
⁻ Market research across 33 countries
⁻ Appointed new CEO from the team
⁻ Reorganized international operations
• Brand architecture developed to align with a “good, better, best” strategy
• North American distribution is being expanded through an omni-channel approach
⁻ Investment behind website redesign and .com efforts
⁻ Retail store redesign
⁻ First TV advertising test launched
⁻ Fundraising channel expansion
• Investment for global growth
⁻ New head of EMEA appointed
⁻ Western European sales and marketing staff put in place
⁻ Development of robust, global IT infrastructure made a priority
⁻ International manufacturing project
• New business launch Scent Systems
32Brand Architecture by Yankee Candle
Direct to Consumer
Yankee Candle Y Collection
Food, Drug and Premium/Specialty
Luxury Channels
Mass Channel Channels
(Best)
(Good) (Better)
American Home Yankee Candle Y Collection Millefiori
33Food, Drug and Mass Channel
American Home by Yankee Candle
• New brand to service the Food,
Drug and Mass channel
• Supports new brand architecture
of “good, better, best”
• Launching in second half of 2015
• Initial offering includes 20
Fragrances across 7 formats
34New Store Concept by Yankee Candle
35New Store Concept by Yankee Candle
36Jarden Fundraising by Yankee Candle
37Continental Europe FDM Expansion
Home Inspiration by Yankee Candle
• New brand for continental Europe targeted at the Food, Drug and Mass channel
• Testing in Germany and France during Fall 2015
• Full launch targeted for 2016
• Leveraging Jarden Home and Family infrastructure
38Scent Systems by Yankee Candle
• Yankee Candle to launch a new
Commercial Division in 2015
• Leveraging Yankee Candle’s
fragrance expertise to penetrate
hospitality, retail and other new
market segments • Proprietary first to market
Scentelligent™ technology delivers
consistent precise fragrance through
an integrated global network
• Network monitoring and support
provides “never out” replenishment
model
⁻ Monitoring app compatible
with smart devices
39Jarden Q4 and Full-Year 2014 Results
Organic Growth was Delivered Across Each Business Segment
• 2014 Full-Year Record Net Sales, Gross Margins, Segment Earnings, Operating Earnings, and
Adjusted Diluted Earnings per Share
($ in millions) Three months ended Twelve months ended
12/31/2014 12/31/2013 Inc/(Dec)% 12/31/2014 12/31/2013 Inc/(Dec)%
Net Sales $2,438 $2,216 10.0% $8,287 $7,356 12.7%
Adjusted EBITDA
$411 $339 21.3% $1,104 $936 17.9%
(Segment Earnings)
% Margin 16.8% 15.3% 13.3% 12.7%
Adjusted Net Income $220 $167 31.4% $512 $413 23.9%
Cash Flow from Operations $677 $606 11.7% $669(1) $669 0.1%
Note: For a reconciliation of Non-GAAP numbers please refer to the Supplemental slides posted on Jarden’s website.
(1) For full year 2014, cash flow from operations was $669 million before a $42 million cash charge primarily representing the cost of interest acceleration related to the early repayment of Jarden’s 2020 bonds.
40Project LEAN Initiative
• Mission = To leverage SG&A spend by segment, business, and expense
category to drive profitability
• Project LEAN will support our goal of +150 bps from the FY’13 segment
earnings margin of 12.7%
• Initiative is compromised of several smaller scale projects leading to margin
improvement
⁻ Brand support will not be reduced, platform efficiencies are being
targeted
• Examples of current initiatives include:
⁻ Movement to shared service platforms for back office
⁻ Travel expense centralization and management
⁻ Subscription and professional dues review
⁻ Parcel post analysis; and
⁻ Review of outside service use and cost
41Full-Year 2015 Guidance
• Organic Sales Growth 3-5%
• Segment Earnings Margins of 13.5%-14.0%
• Interest Expenditure $175-$185 million
• Capital Expenditure of 2.5%
• Cash Flow from Operations of approximately $700 million
• Year End Bank Leverage Ratio at or Below 3.0x
Diluted Adjusted EPS Delivery in the Range of $2.75-$2.90
Note: (1) Assumes 192-193 million shares outstanding. Lower end of fully diluted adjusted EPS range reflects FX rates as of Jarden’s 4Q
earnings call 2/12/15
42Long-Term Financial Goals
Delivering Long-Term Average Annual Organic Sales Growth of 3% to 5%
Continuing to Leverage SG&A
Expanding Segment Earnings Margins +150 bps from the 12.7% FY13 Level
Generating Average Annual Earnings Growth of at Least 10%
Producing at Least $4.0 Bn of Cash Flow from Operations
over Five Years (2014-18)(1)
Targeting Year End Bank Leverage Ratio at or Below 3.0x
Delivering Diluted Adjusted EPS of $4.00 by YE 2018(2)
Note: (1) Cash flow from operations delivered from 2009-2013 was $2.5 Bn.
(2) Diluted adjusted EPS of $4.00 reflects the November 2014, 3-for-2 share split and is unchanged and equivalent to the pre-split target value of $6.00.
432015 Investor Presentation
Q&AYou can also read