Investor Presentation - September 2020 - Parkland Fuel Corporation
←
→
Page content transcription
If your browser does not render page correctly, please read the page content below
Investor Presentation
September 2020

                        1
Forward Looking Statement & Note on Non-GAAP Measures
Certain information included herein is forward-looking. Many of these forward looking statements can be identified by words such as “aspire”, “believe”, “expects”, “expected”, “will”, “intends”, “projects”, “projected”, “anticipates”, “estimates”, “continues”,
"objective" or similar words and include, but are not limited to statements related Parkland’s expectation of its future financial position, business and growth strategies and objectives (including organic growth and M&A), sources of growth including
geographic areas for growth, the revised 2020 Capital Program, including expected maintenance and growth capital expenditure estimates and projects, pro forma site counts, future site retrofits, future new to industry sites, single retail site
acquisitions, plans for the development of a national commercial network, supply metrics, refinery interests and fuel volumes, potential synergies and other benefits from completed transactions (including timing to realization thereof), run-rate
synergies, uses of cash, sources of cash, expected annualized cost savings from initiatives taken in Q2 2020, projected On-the-Run/Marche Express locations, introduction of non-food private label products, emerging opportunities in commercial road
diesel market (including inter-province and cross-border opportunities), opportunities presented by enhancing Parkland's digital platform, expected timing of Parkland's inaugural ESG report, consolidation of fragmented regional markets. Parkland
believes the expectations reflected in such forward-looking statements are reasonable, but no assurance can be given that these expectations will prove to be correct and such forward looking statements should not be unduly relied upon. The
forward-looking statements contained herein are based upon certain assumptions and factors including, without limitation: historical trends, current and future economic and financial conditions, and expected future developments.

Parkland believes such assumptions and factors are reasonably accurate at the time of preparing this presentation. However, forward-looking statements are not guarantees of future performance and involve a number of risks and uncertainties some
of which are described in Parkland’s annual information form and other continuous disclosure documents. Such forward-looking statements necessarily involve known and unknown risks and uncertainties and other factors, which may cause
Parkland’s actual performance and financial results in future periods to differ materially from any projections of future performance or results expressed or implied by such forward looking statements. Such factors include, but are not limited to, risks
associated with: general economic, market and business conditions and the extent and duration COVID-19 pandemic and its effects on such economic, market and business conditions; change in demand for Parkland’s products; the ability of suppliers
and other counterparties to meet commitments; the operations of Parkland businesses, including compliance with all necessary regulations; competitive action by other companies; the ability of management to maintain the assets within the
forecasted budget for capital expenditures; failure to meet financial, operational and strategic objectives and plans; failure to meet publicly disclosed financial guidance and market expectations; industry capacity, failure to realize anticipated synergies,
accretion, growth and value creation Parkland’s acquisitions; competitive action by other companies; the ability of suppliers to meet commitments; actions by governmental authorities and other regulators including increases in taxes; changes and
developments in environmental and other regulations; ability to secure sources of funding for its anticipated acquisitions, if necessary, on terms acceptable to Parkland; failure to retain key management personnel; Parkland’s inexperience in any of the
jurisdictions in which it expands into, and the political and regulatory risks associated with certain of those jurisdictions; Parkland’s ability to effectively integrate acquired businesses; foreign exchange and inflation rate exposures; environmental
liabilities associated with Parkland’s business; supply economics in the jurisdictions in which Parklands operates its business; Parkland’s ability repay its indebtedness; and other factors, many of which are beyond the control of Parkland. Readers are
directed to, and are encouraged to read, Parkland's management discussion and analysis for the interim period ended June 30, 2020, (the “Q2 2020 MD&A"), Parkland’s consolidated financial statement for the interim period ended June 30, 2020 (the
“Q2 2020 FS”), and Parkland’s annual information form for the year ended December 31, 2019 (the “AIF”), including the disclosure contained under the heading "Risk Factors" in each such document. Each of the Q2 2020 MD&A, Q2 2020 FS and AIF is
available by accessing Parkland's profile on SEDAR at www.sedar.com and such information is incorporated by reference herein. Any forward-looking statements are made as of the date hereof and Parkland does not undertake any obligation, except
as required under applicable law, to publicly update or revise such statements to reflect new information, subsequent or otherwise. The forward-looking statements contained in this presentation are expressly qualified by this cautionary statement.

This presentation refers to certain financial measures that are not determined in accordance with International Financial Reporting Standards (“IFRS”). Distributable Cash Flow per share, and Total Funded Debt to Adjusted EBITDA are not measures
recognized under IFRS and do not have standardized meanings prescribed by IFRS. Adjusted EBITDA and adjusted gross profit are measures of segment profit. See Section 12 of the Q2 2020 MD&A and Note 20 of the Q2 2020 FS for a reconciliation of
these measures of segment profit. Also see Section 12 of the Q2 2020 MD&A for a discussion of non-GAAP measures and their reconciliations to the nearest applicable IFRS measure. Annual Synergies is an annualized measure and is considered to be
forward-looking information. See Section 12 of the Q2 2020 MD&A. Investors are encouraged to evaluate each measure and the reasons Parkland considers it appropriate for supplemental analysis. Effective January 1, 2019, Parkland adopted the new
accounting standard, IFRS 16 - Leases ("IFRS 16"). The adoption of IFRS 16 has a significant effect on Parkland's reported results. Due to Parkland's selected transition method, it has not restated its prior year comparatives. Certain financial statement
measures are presented excluding the impact of IFRS 16 ("Pre-IFRS 16 measures"). Refer to the Q2 2020 FS and Q2 2020 MD&A for reconciliations of Pre-IFRS 16 measures. Management considers these to be important supplemental measures of
Parkland’s performance and believes these measures are frequently used by securities analysts, investors and other interested parties in the evaluation of companies in its industries.. Readers are cautioned, however, that these measures should not be
construed as an alternative to net income or other measures determined in accordance with IFRS as an indication of Parkland’s performance. The financial measures that are not determined in accordance with IFRS in this presentation are expressly
qualified by this cautionary statement.

Market data and other statistical information used throughout this presentation are based on internal company research, independent industry publications, government publications, reports by market research firms or other published independent
sources including Fitch, the IMF World Economic Outlook and Wood Mackenzie. Industry surveys, publications, consultant surveys and forecasts generally state that the information contained therein has been obtained from sources believed to be
reliable. Although Parkland believes such information is accurate and reliable, Parkland has not independently verified any of the data from third-party sources cited or used for management's industry estimates, nor has Parkland ascertained the
underlying economic assumptions relied upon therein. While Parkland believes internal company estimates are reliable, such estimates have not been verified by any independent sources, and Parkland does not make any representations as to the
accuracy of such estimates. Statements as to our position relative to our competitors or as to market share refer to the most recent available data.

                                                                                                                                                                                                                                                                  2
Select Canadian brands   Company Snapshot
                                                                             A leading fuel & convenience marketer
                                                                             Enterprise value                          $9.7 billion
                                                                             Annual Dividend                           $1.214/share, 3.3% yield
                                                                             Annual fuel volume                        22 billion litres
                                                                             Credit rating                             BB (4 agencies)

                                                                             Key Operating Assets             Canada         USA         Int’l         Total

                                                                             Retail service stations           1,848         355         491       2,694

                                            Select USA brands                Cardlock sites                    163           27            -           190
                                                       Locally relevant      Net refining interest
                                                          retail and                                            55            -            5            60
                                                   +    commercial
                                                                             (mmbls/d)
                                                         fuel brands
                                                                             Terminals, bulk plants &
                                                                                                                ✓             ✓            ✓            ✓
                                                                             transloaders

                                                                             Marine / Aviation                  ✓             ✓            ✓            ✓
                            Select International brands

                                                                                                 Retail
                                                                                                 Commercial

                                                                                                                       TSX: PKI                                3
                                                                                                                       Energy – Refining & Marketing
See End notes for further information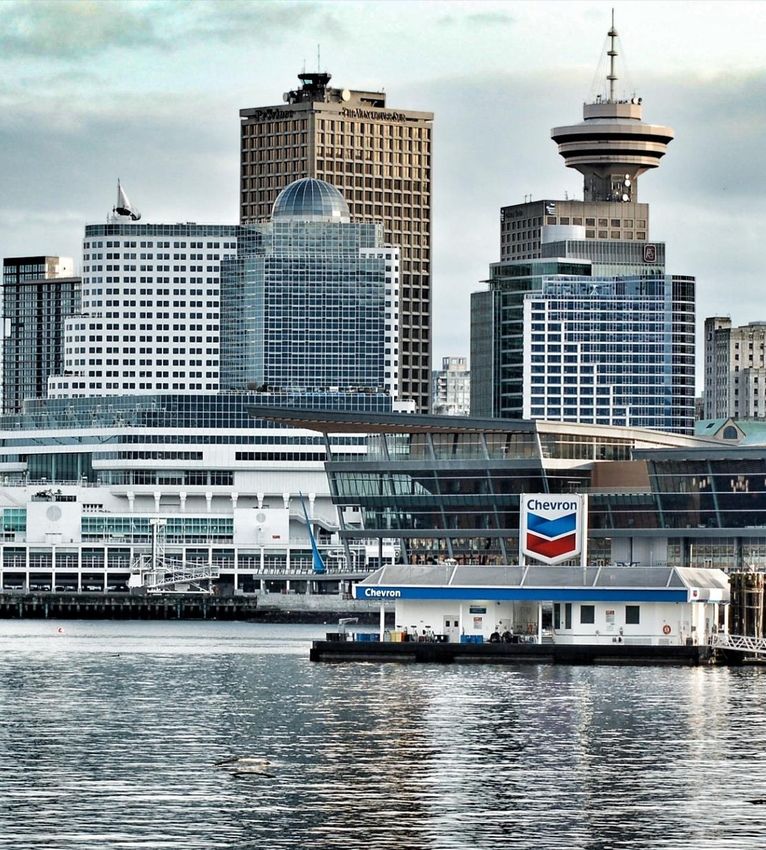
Value Proposition
Positioned to win through various environments
Multi-channel marketing capability
Well positioned to consolidate
Diversified and resilient business model
Adaptable cost structure
Flexible capital program
Prudent capital allocation framework
Significant financial flexibility
Deep pipeline of organic growth opportunities
Established acquisition & integration capabilities
Proven track record of returns
4
Multi-channel marketing capability
Capturing economics across the value chain and coming to market through retail, commercial & wholesale channels

            Make/Buy                                  Move/Store                                     Sell

  Manufacture and purchase                         Source the most                    Optimize internal and external
      refined products                            economic product                           customer base
Enhance margins through leveraging            by leveraging market insight,       Supply our own network (retail/commercial),
    scale and product diversity            transportation and storage capacity     then drive incremental economics through
                                                                                           third party sales (wholesale)

                                                                                                                         5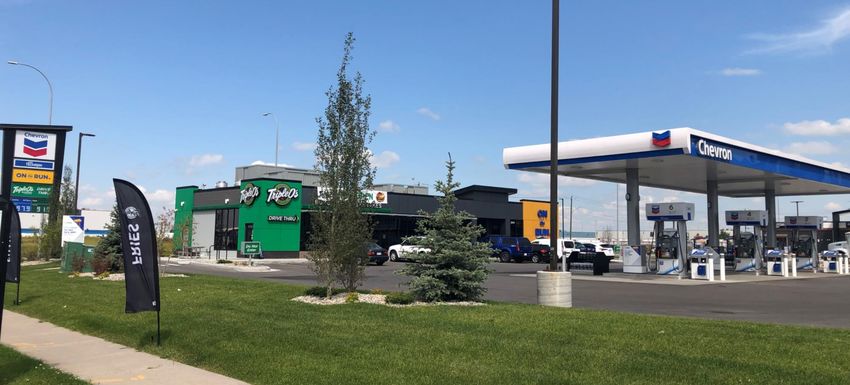
A regional consolidator of the Americas
A rich and varied set of opportunities to increase our scale

Parkland’s strategy has iterative benefits                             Trailing-twelve-month Adjusted EBITDA
                                                                       $ millions

                                                               1,400
                                                                                                                                  COVID-19 and
                                                                                                                                  2020 refinery
                                                               1,200                                                               turnaround

                                                               1,000

                                                                800

                                                                600

                                                                400

                                                                200

                                                                  0
          Lock-in demand organically and through                         Q2   Q3     Q4   Q1   Q2   Q3   Q4   Q1   Q2   Q3   Q4    Q1    Q2

             acquisitions, then optimize supply                               2017              2018                2019            2020

                See End notes for further information                                                                                     6
Diversified & resilient
business model
Provides stability and multiple avenues for growth

 Trailing twelve-month         Trailing twelve-month fuel
 Adjusted EBITDA by            and petroleum product
 Segment                       volume by channel

         USA 5%

                                          Supply
       International
           25%
                                           USA

                                         Canada                      Commercial,
                                                                     wholesale &
          Supply                                                     other volume
           35%
                                      International

                                      International

                                                                     Retail
         Canada                                                      volume
          35%                            Canada

                                  See End notes for further information       7
Variable cost structure helps manage volatility
Successfully managing our cash flow through COVID-19

Operating and Marketing, General and
Administrative (“MG&A”) costs

      $362
                    Year-over-year
                    impact of US            MG&A
                                                                                   >$50 million of
                    acquisitions &
                       growth
                                          Operating
                                            Costs
                                                                                     annualized
                                                                                    cost savings
                                                                    $282
                                                                                  resulting from initiatives
                                       Variable portion of
                                                                                  taken during the second
                                           operations
                                        + proactive cost
                                                                                      quarter of 2020
                                       control measures
                                     + Canada Emergency
                                         Wage Subsidy
                                            ("CEWS")

Q2 2019 Operating       USA          Canada, International,   Q2 2020 Operating
 and MG&A Costs                      Supply and Corporate      and MG&A Costs
                                          Segments

                                                                                                               8
Flexible capital program
Designed to live within our means
Primarily small capital projects
Can quickly scale back or ramp up
when warranted
Capital Expenditure Guidance ($millions)
575
Upward revision in August
supported by strong cash
flow generation year-to-
Growth date 2020
300
325
275
Growth
Growth 105
85
Maintenance
275 Maintenance
Maintenance
220
190
Original 2020 March 30, 2020 August 6, 2020
Capital Guidance COVID-19 Amendment Revision
See End notes for further information 9
Prudent capital allocation framework
A disciplined approach to growth underpinned by existing balance sheet strength
Capital allocation choices
Maintenance
Trailing-twelve-month sources and uses ($millions)
Organic growth
Acquisition opportunities Net dividends
Debt management
MG&A US acquisitions
Distribution growth
Operating
Costs Cash flow from operations
(excluding net change in
non-cash working capital) Growth Capital
Guiding principles
Total Funded Debt to Credit Facility EBITDA ratio(a)
between 2.0x – 3.5x Maintenance Capital
(excluding Turnaround)
• 2x – 3x in normal operations; extend to 3.5x for
acquisition opportunities with path to deleveraging Sources Uses
Exceed internal hurdle rates of return Fully funded
capital program (excl. Turnaround), cash dividends
Growth in cash flow per share and US acquisitions in the last twelve months
See End notes for further information 10Significant financial flexibility
Well positioned for various market conditions
Total Funded Debt to Credit Facility & Senior Notes maturity ladder
Credit Facility EBITDA Ratio (TTM)(a) ($ millions)
S&P Moody’s Fitch DBRS
6.0x Corporate BB Ba2 BB BB
Bonds BB Ba3 BB BB
Current covenant of 5.0x steps up
to 6.0x from Q4 2020 – Q3 2021
5.0x
$1,200 Credit Facility Canadian Bonds US Bonds
Considerable
4.0x headroom
$1,000
$800
3.0x 2.7
$600
2.0x
$400
1.0x
$200
0.0x $0
Q1 2019 Q2 2019 Q3 2019 Q4 2019 Q1 2020 Q2 2020 2020 2021 2022 2023 2024 2025 2026 2027 2028
See End notes for further information 11Deep pipeline of organic growth opportunities
Key initiatives
Continue to upgrade and build new retail sites
Expand reach of JOURNIE™ Rewards
Developing the National Fueling Network (“NFN”)
Renewable fuel processing at the Burnaby refinery
Expanding our Supply infrastructure
Organic expansion of our International footprint
Build-out of US national accounts strategy
12Established acquisition and integration capabilities
Disciplined approach; buying complex portfolios in supply-inefficient markets
Our expertise provides unique opportunities Proven framework for synergy realization
(Stated acquisition multiple versus multiple post synergy capture)
PKI Sweet Spot
Purchase ~7.0x
Average
for below After Synergy Capture ~5.0x
transactions
Purchase
After Expected Synergy Capture
Purchase
After Synergy Capture
Simple portfolios Complex portfolios
Supply inefficient markets Supply inefficient markets
Purchase
Simple portfolios Complex portfolios After Synergy Capture
Supply efficient markets Supply efficient markets
See End notes for further information 13Proven track record of returns
History of strong total shareholder return and dividend growth
Annualized total shareholder return Annualized dividend history
(2011 – August 2020) ($/share) 3.3%
dividend
yield
20% 19% 1.25
1.214
1.20
15%
1.15 Consistent and measured
dividend growth through
10% various market cycles
1.10 (8 consecutive annual increases)
5% 1.05
1.00
0%
0.95
-5%
S&P TSX S&P TSX S&P 500 Parkland 0.90
Energy 2011 2012 2013 2014 2015 2016 2017 2018 2019 2020
See End notes for further information 14Accelerating our digital transformation
Teaming up with Amazon Web Services (“AWS”) to deliver better customer value, lower costs and improve performance insights
Near-term opportunities
Loyalty program data optimization
Personalized customer offers
MG&A
Real-time price optimization
Operating
Costs Progressing our vision for the convenience
store of the future
Additional strategic opportunities
Real-time fuel inventory monitoring
Routing and distribution optimization
Improving the speed and efficiency of
acquisition integration
Harnessing digital to help scale the business
without adding significant cost and complexity
See End notes for further information 15Our sustainability journey
Committed to integrating ESG across our operations
and in our strategic decision making
Board established an Environmental, Social
& Governance ("ESG") committee in 2019
Inaugural report expected Fall 2020
MG&A
Operating
“At Parkland, sustainability means
Costs
providing our customers with
safe, reliable energy and products
they need today, while making
strategic decisions and innovative
investments that contribute to a
lower carbon future.”
- Bob Espey, President & CEO
16Appendix:
Canada
Segment
overview
17Canada – diverse portfolio of fuel, convenience & cardlock
Network of gas station & convenience stores
Over the road and delivered diesel, propane,
heating oil and lubricants
Multi-brand retail and commercial forecourt
strategy with a unified backcourt offer
Approximately 9.2 billion litres fuel and
petroleum product volumes (TTM)
Key Operating Assets Canada
Company retail sites 645
Dealer retail sites 1,203
Total retail service stations 1,848
Commercial cardlock sites 163 Select Canadian brands
Net refining interest (mmbls/d) 55
Commercial branches & Cardlock network
Terminals, bulk plants & transloaders ✓ Company Retail
Dealer Retail
Marine / Aviation ✓
See End notes for further information 18Retail: network development and growing non-fuel
Invest in high growth areas with a supply advantage, drive forecourt to backcourt conversion
Continuously improve customer Targeted investment through detailed
experience and offering micro-market analysis
1 2 3
Great Fuel Brands On the Run Branded Food
Offers
Ongoing initiative to standardize back-
court to On the Run / Marche Express
CONVENIENCE FOOD
4
Loyalty
19Commercial: capitalizing on cross-
border & interprovincial traffic
Building our national fueling network (NFN) through cardlock presence
Canadian Commercial Road Diesel Market
Trucking tonne kilometers travelled (Billions)
269
Emerging
opportunity for
Parkland
Currently well
serviced by
Parkland
In-province Inter-province Cross-border Total Diesel
Demand
Opportunity to capture national accounts
through our network development plan & NFN
See End notes for further information 20Canada Q2 2020 operational summary
Strong per unit fuel margins and convenience store traffic
Fuel and petroleum product volume relative to prior year
• Adjusted EBITDA increase despite COVID-19 impacts 2020 vs. 2019, normalized to 100, rolling 7-day average
• 18th consecutive quarter of Company C-Store SSSG 180%
• Over 900 sites with JOURNIE™ Rewards in Canada 160%
• Commercial team winning new business
140%
120%
Q2 '20 Q2 '19 Change YTD '20 YTD '19 Change
Adjusted EBITDA ($mm) $93 $71 $22 $195 $188 $7 100%
Fuel and petroleum product
1,828 2,419 (591) 4,188 4,920 (732)
volume (ML) 80%
KPI
Company volume SSSG (c) (29.3%) 0.7% (30.0)p.p. (17.3%) 1.0% (18.3) p.p. 60%
Company C-store SSSG (d) 12.1% 0.5% 11.6 p.p. 6.7% 3.1% 3.6 p.p.
40%
Fuel and petroleum product
8.64 6.86 1.78 8.43 7.80 0.63 Retail Commercial & other
adjusted gross profit (cpl)
20%
Operating costs (cpl) 5.09 4.88 0.21 5.01 4.88 0.13
MG&A (cpl) 0.93 1.16 (0.23) 0.96 1.16 (0.20)
0%
Feb-29 Mar-31 Apr-30 May-31 Jun-30 Jul-31
See End notes for further information 21Appendix:
International
Segment
overview
22International – a platform for future growth
Integrated supply chain & extensive distribution
network throughout 23 countries in the
Caribbean and South America
Retail, commercial, aviation, import terminals,
pipelines, marine berths and charter ships
45% of onshore volumes are regulated
Approximately 5.4 billion litres fuel and
petroleum product volumes (TTM)
Key Operating Assets International
Company retail sites 251
Dealer retail sites 240
Retail service stations 491 Select International brands
Import terminals 32
Marine facilities 24
Aviation facilities 13
In Q1 2019 Parkland purchased 75% of Sol Investments Limited with a put/call option for the remaining 25% stake in
Net refining interest SOL starting in 2022. The put/call option is based on Sol's contractually-defined trailing twelve-month adjusted EBITDA,
5
(non-operated, mmbls/d) multiplied by 8.5, and including other adjustments as defined in the Sol Business Combination Agreement.
See End notes for further information 23A strong and growing region
Targeting growth through business line and regional expansion
Large regional population with stable growth. Approximately
30 million people in the areas we currently serve
Diversified geographic and product lines within region
Supporting significant growth in natural resource activity,
namely in Guyana and Suriname
Strategic supply infrastructure and opportunities to expand
Growth platforms
SUPPLY LPG AVIATION
COMMERCIAL
RETAIL LUBRICANTS
& WHOLESALE
24International Q2 2020 operational summary
Strong quarter despite extensive COVID-19 impacts
Fuel and petroleum product volume relative to prior year
2020 vs. 2019, normalized to 100, rolling average • Robust base business with geographic and product diversity
250%
• Meaningful cost reduction and integration efforts
Retail Commercial & other
• Organic growth with minimal capital investment
200% • Q2/Q3 is a seasonal low in tourist activity
150% Q2 '20 Q2 '19 Change YTD '20 YTD '19 Change
Adjusted EBITDA ($mm) $54 $74 ($20) $121 $145 ($24)
Volume - Retail (ML) 304 469 (165) 710 893 (183)
100% Volume - Commercial
918 801 117 1,908 1,440 468
& Other (ML)
KPI
Fuel and petroleum product
8.18 10.71 (2.53) 8.86 11.27 (2.41)
50% adjusted gross profit (cpl)
Operating costs (cpl) 2.78 3.39 (0.61) 3.09 3.69 (0.60)
MG&A (cpl) 1.23 1.97 (0.74) 1.60 2.01 (0.41)
0%
Feb-29 Mar-31 Apr-30 May-31 Jun-30 Jul-31
See End notes for further information 25Appendix:
USA
Segment
overview
26USA – growing portfolio of wholesale and retail
Network of retail and commercial gas/diesel stations
Delivers bulk fuel, lubricants and other related
products and services
Three regional operations centers (“ROC”) in the
Northern Tier, Rocky Mountains & Southeast
Approximately 2.3 billion litres fuel and petroleum
product volumes (TTM)
Key Operating Assets USA
Company retail sites 58
Dealer retail sites 297
Retail service stations 355
Commercial cardlock sites 27
Net refining interest (mmbls/d) - ROC
Select USA brands
Distribution
Locally relevant
Terminals, bulk plants & transloaders ✓ retail and Retail
+ commercial Commercial
Marine / Aviation ✓ fuel brands
See End notes for further information 27A disciplined acquisition strategy
Consolidating fragmented regional markets where we have a supply advantage
USA growth roadmap
2014
Entry into 2019
Initial toehold
the United Established
States a new ROC
Establish scale
2018 2020
Doubled Positioned
our USA for further
run-rate growth
Continue expansion
Competitive national platform
28USA Q2 2020 operational overview
Strong per unit fuel margins and convenience store traffic
Fuel and petroleum product volume relative to prior year
• Added meaningful national accounts customers 2020 vs. 2019, normalized to 100, rolling 7-day average
Acquisitions impacting
year-over-year results
• Record quarter for Tropic Oil in Miami 250%
• Closed Conomart acquisition in mid-May 225%
• Continue to evaluate growth opportunities
200%
175%
Q2 '20 Q2 '19 Change YTD '20 YTD '19 Change
150%
Adjusted EBITDA ($mm) $22 $13 $9 $40 $24 $16
125%
Volume - Retail (ML) 54 63 (9) 112 115 (3)
Volume - Wholesale (ML) 572 331 241 1,100 610 490 100%
KPI 75%
Fuel and petroleum product
6.07 5.08 0.99 5.94 4.83 1.11
adjusted gross profit (cpl) 50%
Operating costs (cpl) 6.07 5.84 0.23 6.02 6.07 (0.05) Retail Wholesale & commercial
25%
MG&A (cpl) 1.44 2.03 (0.59) 1.57 1.93 (0.36)
0%
Feb-29 Mar-31 Apr-30 May-31 Jun-30 Jul-31
See End notes for further information 29Appendix:
Supply
Segment
overview
30Proprietary assets, supply flexibility,
and logistics & trading capability
Optimizes Parkland’s fuel supply and logistics
Manages supply contracts with other refiners
Rail and truck logistics including distribution storage
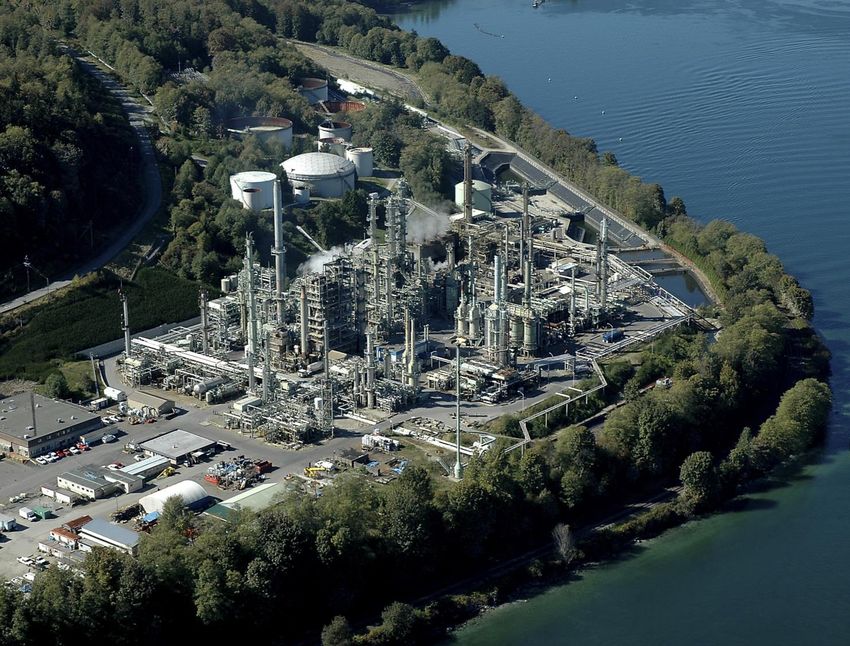
Includes 55,000 bbl/d refinery in Burnaby, British
Columbia included with the 2017 purchase of the
Chevron Canada’s downstream assets
Wholesale
Truck
Ship Store Commercial
Refined Product
Rail Retail
31Overview of Parkland’s supply system
A broad set of capabilities to execute our strategy
Pre 2017 Supply Footprint Current Supply Footprint
Fort Dawson
St. John Creek Inuvik LPG
Grand Grand
Prairie Prairie
Burnaby
TMPL
Refinery
Bowden Bowden
Rail to Rail to
Ontario Ontario
Montreal
Montreal
Northern Tier
Transloading Northern Tier
Transloading Hamilton &
Milton
New York
LPG Harbor
Rockies
Transloading
NW Europe &
LPG Mediterranean
Product from Caribbean
USGC Arabian Gulf
See End notes for further information 32Burnaby refinery
Tightly integrated into Parkland’s marketing businesses
55,000 bbl/d nameplate capacity (light sweet refinery)
Approximately 85% of output services Parkland’s own retail
and commercial network in British Columbia
Approximately 25% of British Columbia demand
Approximately 30% of Vancouver International Airport demand
Approximately 15% of Parkland’s total supply needs
Indicative refinery yield
Inputs Outputs
Motor Gasoline
Edmonton Par (MSW) (60%)
80%
Diesel
(20%)
Syncrude Jet Fuel
(20%) (20%)
See End notes for further information 33Supply Q2 2020 operational overview
Safely completed the Turnaround and now optimizing utilization
Indicative 5-3-1-1 Vancouver Crack Spread
Indicative crack, indexed vs. rolling 3-year average
• Scheduled refinery downtime completed in late April
250%
• Refinery utilization between 80 - 85 percent through July
• Crack spreads recovered from May lows
• Integrated logistics operations performed well 200%
• Pursuing high quality growth opportunities to extend our
supply advantage
150%
Q2 '20 Q2 '19 Change YTD '20 YTD '19
Adjusted EBITDA ($mm) $40 $218 ($178) $80 $361 100%
KPI
Crude throughput (000’s bpd) 35.2 52.2 (17.0) 26.1 51.4
50%
(e)
Refinery Utilization 64.0% 94.9% (30.9) p.p. 47.4% 93.5%
Indicative crack relative to three-year rolling average
0%
See End notes for further information 34End notes
Adjusted EBITDA (“Adj. EBITDA”) refers to the portion attributable to Parkland, and excludes to portion attributable to non- Slide 23
controlling interest (“NCI”). Adjusted EBITDA is a measure of segment profit as outlined in Section 12 of the Q2 2020 MD&A. Key operating asset data and fuel and product volume as at Q2 2020. See section 11 (c) of the Q2 2020 Financial Statements for
detail regarding the option to buy the remaining 25% of Sol.
TTM mean “Trailing-twelve-months”
Slide 25
Slide 3 Retail volume is a rolling 7 day average and commercial and other volume is a rolling 21 day average to normalize for uneven
Enterprise Value is Market Capitalization (August 31, 2020 closing price and shares outstanding as of Q2 2020) plus Net Debt as at billing cycles.
Q2 2020. Net Debt defined as Total Long-term Debt plus Accounts Payable and Accrued Liabilities, Dividends Payable and
Income Tax Payable, less Cash, Income Tax Receivable and Accounts Receivable. Trailing twelve month fuel and petroleum Slide 27
product volume at of Q2 2020. Dividend yield based on closing price as of August 30, 2020. Key operating asset data and fuel and product volume as at Q2 2020.
Key Operating assets as at Q2 2020.
Slide 32
Slide 7 Map shows a combination of owned and leased supply assets.
Trailing twelve-month Adjusted EBITDA as of Q2 2020. Percentages exclude corporate segment and are rounded to the nearest
5%. Trailing twelve-month fuel and petroleum product volume is as of Q2 2020. Slide 33
Burnaby refinery details are approximate based on normal operating conditions. Refinery yield is illustrative in nature and can
Slide 9 serve as a reasonable proxy for the Burnaby refinery product yield under normal operations. Actual refinery yield may differ.
See press release dated August 6, 2020 along with our Q2 2020 MD&A for material factors and assumptions related to the 2020
Capital Program. Slide 34
While not the actual crack spreads experienced by our Burnaby Refinery, the 5-3-1-1 Generic Vancouver Crack spread can serve as
Slide 10 a reasonable proxy for the Vancouver Crack, and should provide investors with a reasonable benchmark for comparison to their
Trailing-twelve-month sources and uses as at Q2 2020. own crack spread computations. The index plots historical values against the rolling three year average marked as 100 percent on
the chart.
Slide 11
On June 23, 2020, Parkland completed the private offering of $400 aggregate principal amount of senior unsecured notes due Illustrative proxy for generic Vancouver Crack Spread based on Supply of 5 barrels of crude (4 barrels of Edmonton Light and 1
June 23, 2028 (the "2020 Senior Notes"). The 6.00% Senior Notes due 2028 were priced at par and bear interest at a rate of 6.00% Barrel of Syncrude) plus transportation costs); Products are Vancouver Rack pricing for 3 barrels of gasoline and 1 barrel of diesel
per annum, payable semi-annually in arrears beginning December 23, 2020. Parkland used the net proceeds from the offering to plus 1 barrel of Jet fuel (L.A.).
repay its $200 5.50% Senior Notes and the $200 6.00% Senior Notes in July 2020. Source: Bloomberg
Bloomberg codes: CL1 Comdty, CIL1 Index, USCRSYNC Index, MOGPV87R Index, CRUMVNAG Index, JETFLAPL Index
The 5.50% Senior Notes and 6.00% Senior Notes were redeemed by Parkland in July 2020. The repayment includes principal
repayments of $200 million for 5.50% Senior Notes, $200 million for 6.00% Senior notes, $4 million of accrued interest up to the
redemption date and a $3 million early redemption fee on the 6.00% Senior Notes. Non-GAPP Financial Measures and KPIs
See section 12 of the Q2 2020 MD&A for more information.
Senior Note maturity ladder represents principal amounts only.
a) Total Funded Debt to Credit Facility EBITDA Ratio TTM: This metric represents the total funded debt as a percentage of
Slide 13 Credit Facility EBITDA. It is calculated using the TTM results as follows: (Senior funded debt + Senior unsecured notes) /
Synergy capture for the Sol acquisition reflects our 20% target of $42 million of annual run-rate synergies by year-end 2021. Credit Facility EBITDA.
Synergy capture figures for the Chevron and Ultramar Acquisitions include annual run-rate synergies of $180 million which was
achieved by the end of 2019. b) Adjusted Dividend Payout Ratio TTM: The adjusted dividend payout ratio is calculated as dividends divided by adjusted
distributable cash flow. See Section 5 and 12 of Parkland’s most current MD&A for discussion and reconciliation.
Slide 14
Annualized total shareholder return per Bloomberg. PKI, TSX and TSX Energy return in Canadian dollars, S&P 500 in US dollars. c) Company Volume Same Store Sales Growth (“SSSG”): Derived by comparing the current year volume of active sites to
Dividend history displays the annual dividend as of December 31 of the given year. the prior year volume of comparable sites.
Slide 15 d) Company C-Store Same Store Sales Growth (“SSSG”): Derived from comparing the current year Point-of-Sale (“POS”, i.e.
See press release dated July 22, 2020 for additional details on the relationship with AWS. cash register) of active sites to the prior year POS sales of comparable sites. See Section 13 of the Q4 2019 MD&A for
more information.
Slide 18
Key operating asset data and fuel and product volume as at Q2 2020. e) Refinery Utilization: Refinery utilization is a key performance indicator that measures crude oil throughput and is
expressed as a percentage of the 55,000 bpd total crude distillation capacity at the Burnaby Refinery. Crude oil
Slide 20 throughput does not reflect the processing of intermediary products and bio-fuels.
Source: Statistics Canada and third party analysis obtained by Parkland. In-province means product moved within the originating
province, Inter-province means product moved between provinces & cross-border means product that is moved between the US Corporate MG&A: Represents Parkland’s Corporate Marketing, General and Administration expenses.
and Canada
35You can also read