The Emerging Market Consumer Internet & E-Commerce Opportunity - An Overview of the KraneShares Emerging Markets Consumer Technology ETF Ticker: ...

Page created by Alfredo Hale
 
CONTINUE READING
The Emerging Market Consumer Internet & E-Commerce Opportunity - An Overview of the KraneShares Emerging Markets Consumer Technology ETF Ticker: ...
KEMQ
                                            3/31/2020

 The Emerging Market Consumer
 Internet & E-Commerce Opportunity
 An Overview of the KraneShares
 Emerging Markets Consumer Technology ETF
 (Ticker: KEMQ)

info@kraneshares.com                                1
The Emerging Market Consumer Internet & E-Commerce Opportunity - An Overview of the KraneShares Emerging Markets Consumer Technology ETF Ticker: ...
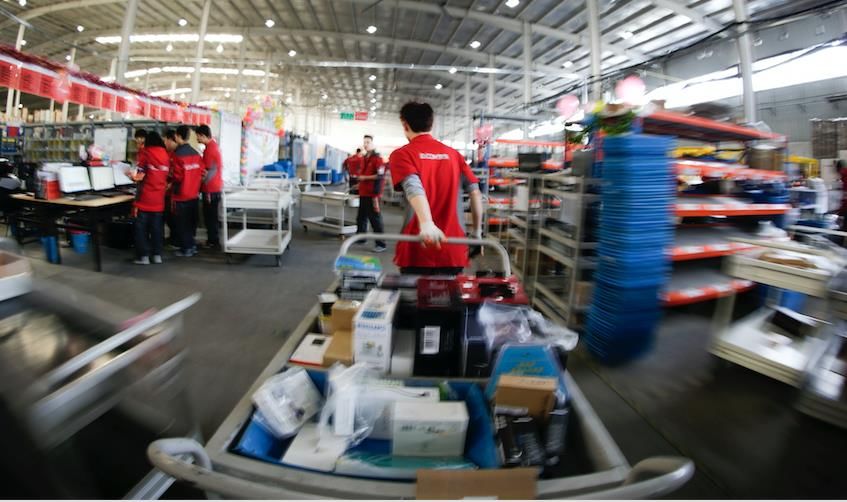
Introduction to KraneShares
About KraneShares
Krane Funds Advisors, LLC is the investment manager for
KraneShares ETFs. Our suite of China focused ETFs
provides investors with solutions to capture China’s
importance as an essential element of a well-designed
investment portfolio. We strive to provide innovative, first
to market strategies that have been developed based on
our strong partnerships and our deep knowledge of
investing. We help investors stay up to date on global
market trends and aim to provide meaningful
diversification. Krane Funds Advisors, LLC is majority
owned by China International Capital Corporation (CICC).

                                                               2
The Emerging Market Consumer Internet & E-Commerce Opportunity - An Overview of the KraneShares Emerging Markets Consumer Technology ETF Ticker: ...
Investment Strategy:

      KEMQ                               KEMQ seeks to track the Solactive Emerging Markets Consumer Technology Index. The Index selects companies from 26 eligible
                                         countries within emerging markets whose primary business or businesses are internet retail, internet software/services, purchase,
KraneShares                              payment processing, or software for internet and E-Commerce transactions.
Emerging Markets                         Emerging Markets Consumer Technology Highlights:
Consumer Technology
ETF                                      •   Internet adoption is expanding rapidly within emerging markets at the same time that domestic consumption and retail sales are
                                             steadily increasing and frequently taking place online.

                                         •   According to a study from the Brookings Institution, middle class consumption could reach 50% of total global consumption by the
                                             year 2030, more than doubling from 20151.

                                         •   We believe the growth of internet adoption within emerging markets is a long term secular theme that may continue to play out over
                                             the course of decades.

                                         KEMQ features:

                                         •   Access to emerging market internet companies that provide similar services as Google, Facebook, PayPal, Amazon, etc.

                                         •   Exposure to companies that stand to benefit from increasing domestic consumption by emerging markets' growing middle class

                                         •   Exposure to emerging market companies facilitating mobile E-Commerce sales

1. Homi Kharas, “The Unprecedented Expansion of the Global Middle Class” Brookings Institution, February 2017, retrieved 3/31/2020.                                               3
The Emerging Market Consumer Internet & E-Commerce Opportunity - An Overview of the KraneShares Emerging Markets Consumer Technology ETF Ticker: ...
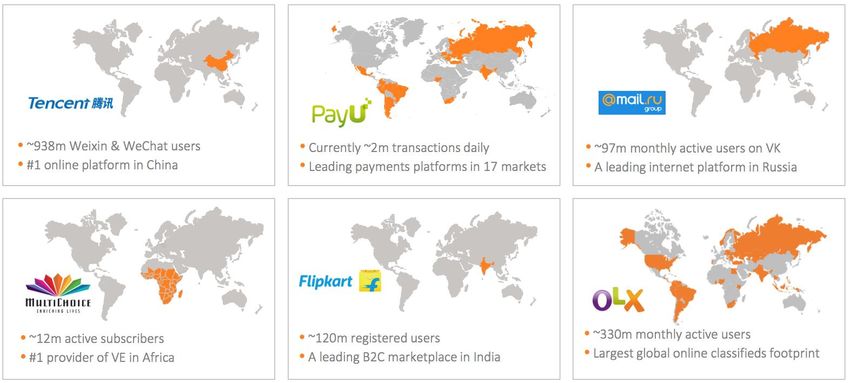
Transformational growth in emerging markets is driven by the “Three P’s”

          Population                     Penetration                       Performance
    The middle class consumer in   Internet adoption is the catalyst   Technology firms across the
    Emerging Markets will drive    for rapid innovation, and           emerging markets are taking
    global demand.                 facilitates “leapfrogging”.         global leadership positions.

                                                                                                      4
The Emerging Market Consumer Internet & E-Commerce Opportunity - An Overview of the KraneShares Emerging Markets Consumer Technology ETF Ticker: ...
World Bank 2018 GDP, by PPP
                                                                           Ranking        Economy                            (millions of international dollars)
                                                                     CHN              1   China                                                      25,361,744
                                                                     USA              2   United States                                              20,494,100
Emerging markets represent a huge consumer                           IND              3   India                                                      10,498,468

market opportunity.                                                  JPN              4   Japan                                                       5,484,951
                                                                     DEU              5   Germany                                                     4,505,236

•   In order to fairly compare the consumption power of              RUS              6   Russian Federation                                          3,986,064
                                                                     IDN              7   Indonesia                                                   3,494,762
    different economies we use purchasing power parity (PPP)
                                                                     BRA              8   Brazil                                                      3,365,757

•   In terms of PPP, the top 25 economies by GDP represent           GBR              9   United Kingdom                                              3,074,432
                                                                     FRA             10   France                                                      3,073,179
    79% of the global economy1
                                                                     ITA             11   Italy                                                       2,542,974

•   60% of these economies (or 15 out of 25 numerically) are         MEX             12   Mexico                                                      2,519,962
                                                                     TUR             13   Turkey                                                      2,372,087
    considered emerging markets1
                                                                     KOR             14   Korea, Rep.                                                 2,090,161
•   According to the World Bank, emerging markets represent          ESP             15   Spain                                                       1,908,879

    a population of 4.5 billion people who spend more than $5        SAU             16   Saudi Arabia                                                1,857,538
                                                                     CAN             17   Canada                                                      1,774,034
    trillion a year2
                                                                     THA             18   Thailand                                                    1,320,373
                                                                     AUS             19   Australia                                                   1,288,228
                                                                     POL             20   Poland                                                      1,228,854
                                                                     EGY             21   Egypt, Arab Rep.                                            1,219,510
                                                                     PAK             22   Pakistan                                                    1,176,498
                                                                     NGA             23   Nigeria                                                     1,171,387
1. Data from the World Bank as of 12/31/2018. Retrieved 3/31/2020.
                                                                     MYS             24   Malaysia                                                      999,405
2. “The World Bank’s Global Consumption Database” The World Bank.
   Retrieved 3/31/2020.                                              NLD             25   Netherlands                                                   978,240
                                                                                                                                                               5
The Emerging Market Consumer Internet & E-Commerce Opportunity - An Overview of the KraneShares Emerging Markets Consumer Technology ETF Ticker: ...
According to a study from the Brookings Institution, middle class consumption could reach 50% of total global
consumption by the year 2030, more than doubling from 2015.
                                         Middle Class Consumption – Top 10 Countries (billions of 2011 PPP$ and global share)

                                       2015                                                 2020                                                   2030

          1    United States                  4.7            13%    China                          6.8              16%    China                          14.3   22%

          2    China                          4.2            12%    United States                  4.7              11%    India                          10.7   17%

          3    Japan                          2.1             6%    India                          3.7               9%    United States                   4.7   7%

          4    India                          1.9             5%    Japan                          2.1               5%    Indonesia                       2.4   4%

          5    Russia                         1.5             4%    Russia                         1.6               4%    Japan                           2.1   3%

          6    Germany                        1.5             4%    Germany                        1.5               4%    Russia                          1.6   3%

          7    Brazil                         1.2             3%    Indonesia                      1.3               3%    Germany                         1.5   2%

          8    UK                             1.1             3%    Brazil                         1.2               3%    Mexico                          1.3   2%

          9    France                         1.1             3%    UK                             1.2               3%    Brazil                          1.3   2%

          10   Italy                          0.9             3%    France                         1.1               3%    UK                              1.2   2%

               Emerging market total                         24%    Emerging market total                           35%    Emerging market total                 50%

                           Homi Kharas, “The Unprecedented Expansion of the Global Middle Class” Brookings Institution, February 2017, retrieved 3/31/2020.            6
The Emerging Market Consumer Internet & E-Commerce Opportunity - An Overview of the KraneShares Emerging Markets Consumer Technology ETF Ticker: ...
The rise of consumer technology goes beyond China to broader emerging markets as more of the developing
world gets internet access for the first time.

                                                      Internet penetration rates vary across emerging markets creating distinct                                                          Within major emerging market countries, internet usage has grown by an
                                                      growth profiles for each country                                                                                                   average of 20% a year

                                                                      Internet adoption after reaching 50% penetration                                                                   Country by country number of internet users and average growth rate
                                                 20                                                                               South Korea
                                                                                                                                                                                                                     since 2000
                                                                                                                                                                                   800                                                                            35%
  Number of years since achieving 50% internet

                                                 18
                                                                                                                                                                                   700                                                                            30%
                                                 16

                                                                                                                                                       Internet Users (millions)
                                                                                                                                                                                   600

                                                                                                                                                                                                                                                                        Average Growth Rate
                                                 14                                                                                                                                                                                                               25%
                                                                                               Poland
                                                                                                                                                                                   500
                                                 12                                                                                                                                                                                                               20%
                                                                                                                                                                                   400
                  penetration

                                                 10
                                                                                                      Argentina                                                                                                                                                   15%
                                                                                                                                                                                   300
                                                  8              South Africa                                                                                                                                                                                     10%
                                                         China                                           Russia                                                                    200
                                                  6                                   Brazil
                                                                                                                                                                                   100                                                                            5%
                                                  4
                                                                                                                                                                                    0                                                                             0%
                                                  2
                                                  0
                                                   50%       55%      60%       65%    70%     75%        80%       85%     90%      95%        100%

                                                                            Internet Users % of Pop             Trendline
                                                                                                                                                                                          Internet Users (millions)      Average internet user growth rate since 2000

Data from the World Bank as of 12/31/2017, retrieved on 3/31/2020.                                                                                                                                                                                                                            7
The Emerging Market Consumer Internet & E-Commerce Opportunity - An Overview of the KraneShares Emerging Markets Consumer Technology ETF Ticker: ...
For the majority of the developing world, smart phones provide the first point of internet access, bypassing
traditional computers.
                                                                                                         The proliferation of low cost smart phones across emerging
                           Mobile-cellular telephone subscriptions                                       markets, like the Mi Max 2 from Xiaomi pictured below, has
                                                                                                         meant much of the developing population is gaining access to
                                   2000                     2018               Growth multiple           the internet for the first time via smart phones.

 India                                 3,577,095            1,176,021,869                     329x

 Russia                                3,263,200              229,431,008                      70x

 China                                85,260,000            1,641,147,000                      19x

 South Africa                          8,339,000               88,566,977                      11x

 Brazil                               23,188,171              207,046,810                           9x

 Argentina                             6,487,950               58,598,041                           9x

 Malaysia                              5,121,748               42,413,400                           8x

 Poland                                6,747,000               51,098,747                           8x

 South Korea                          26,816,398               66,355,778                           2x

Source: International Telecommunications Union statistics database as of 12/31/2018. Retrieved on
3/31/2020.
ITU is the United Nations specialized agency for information and communication technologies. Data
includes pay-as-you-go and contract renewals
                                                                                                                                                                        8
The Emerging Market Consumer Internet & E-Commerce Opportunity - An Overview of the KraneShares Emerging Markets Consumer Technology ETF Ticker: ...
China’s rapid adoption of new technologies has produced a “leapfrogging” effect.

                           Payment                                                        Commerce

  Cash          Checking              Credit         Mobile Pay    Local Market         Big Box Retailer   E-Commerce

                     Transportation                                                          Healthcare

   Taxi                                                            Local Medical Care         Hospitals      E-Health
                  Car Ownership           App-Based Ride Sharing

                                                                                                                        9
The Emerging Market Consumer Internet & E-Commerce Opportunity - An Overview of the KraneShares Emerging Markets Consumer Technology ETF Ticker: ...
Money and the internet have become virtually inseparable.
Apps like Tencent’s WeChat and Alibaba’s Alipay allow users to do everything from buy a coffee, hail a cab, to make investments in
wealth management products, all from a smart phone.

 WeChat users can invest in mutual funds through the same app
 they use for social media.

                                                                                                                                     10
Through our experience investing in the Chinese markets we identified three core themes:
        • Internet adoption is expanding rapidly within China
        • Domestic consumption and retail sales are steadily increasing and frequently taking place online
        • The China E-Commerce sector has consistently outperformed the broader Chinese markets

                                       Value of Monthly China Retail Sales Index
                                                (12/31/2009 - 12/31/2019)
                             4000
                                                                                                                                              China / US Internet Statistics                                           China                   US
                             3500                                                                                                             Total internet population                                               854mm1                294mm2
Index Value (CNY Billions)

                             3000                                                                                                             % of population with internet access                                     61.2%1                89.5%2

                             2500                                                                                                             Country’s share of world internet users                                  23.4%2                8.1%2

                             2000                                                                                                             E-Commerce market size 2018                                              $1.3T3              $513.6B4

                             1500                                                                                                             Total retail sales 2018                                                  $5.5T3                $5.3T4

                             1000                                                                                                             % of online retail sales 2018                                            23.6%3                9.7%4

                                                                                                                                              2017-2018 growth online sales                                            23.9%3                14.2%4
                              500

                                                                                                                                           1.CNNIC, The 44th Statistical Report on the Development of China’s Internet, 8/31/2019.
                                                                                                                                           2.Data from Pew Research Center, World Bank, and US Census Bureau as of 6/30/2019. Retrieved 3/31/2020.
        Chart data from Bloomberg as of 12/31/2019, retrieved 3/31/2020.                                                                   3.National Bureau of Statistics in China, “National Economic Performance Maintained within an Appropriate
        China Retail Sales Index: Retail sales (also referred to as retail trade) tracks the resale of new and used goods to the general     Range in 2018 with Main Development Goals Achieved” 1/21/2019. Note: Figures converted from Chinese
        public, for personal or household consumption. This concept is based on the value of goods sold.                                     Renminbi to USD as of 12/31/2018.
                                                                                                                                           4.U.S. Department of Commerce, “Quarterly Retail E-commerce Sales 4th Quarter 2018” 3/13/2019.

                                                                                                                                                                                                                                                       11
Through our trips to China we saw the proliferation of e-commerce firsthand.
Over 50 billion packages were delivered in China in 2018, an increase of 26% from the previous year1.

 JD.com warehouse employees prepare same-day delivery                                              JD.com owns its own logistics network and has a fleet of delivery vehicles
                                                                                                   around China

1www.xinhua.net   “China's express delivery sector expands fast in 2018”, 1/6/2019. Retrieved 3/31/2020.                                                                        12
China is Rapidly Becoming A Global Internet Services Leader

                             2013                                                       2020                                Potential Future IPOs

        Top 10 Global Internet Companies                                   Top 10 Global Internet Companies
                                                                                                                              Top 10 Private Companies3
                 By Market Cap1                                                     By Market Cap2

Alphabet                                                $374.4B    Amazon                                 $1.0 T   Toutiao (Bytedance)                     $75.0B
Amazon                                                  $182.5B    Alphabet                             $830.7 B   Didi Chuxing                            $56.0B
Facebook                                                $138.8B    Alibaba                              $525.8 B   Stripe                                  $35.3B
Tencent                                                 $118.7B    Facebook                             $496.8 B   SpaceX                                  $33.3B

Ebay                                                      $71.0B   Tencent                              $474.5 B   Airbnb                                  $18.0B

Baidu                                                     $62.3B   Netflix                              $162.8 B   Kuaishou                                $18.0B

Naspers Ltd                                               $43.4B   Paypal                               $123.2 B   One97 Communications                    $16.0B
Yahoo                                                     $41.0B   Naspers                               $61.9 B   Epic Games                              $15.0B
Twitter                                                   $36.1B   NetEase                               $41.6 B   DJI Innovations                         $15.0B
Salesforce                                                $33.3B   Baidu                                 $33.6 B   Grab                                    $14.3B
Total                                                     $1.10T   Total                                 $3.75T    Total                                  $295.9B

1.   Data from Bloomberg as of 12/31/2013. Retrieved 3/31/2019.
2.   Data from Bloomberg as of 3/31/2020.
3.   Data from CB Insights as of 3/31/2020.                                                                                                                     13
The Alibaba Ecosystem
                 China Domestic Marketplaces                                              Global Marketplaces

          1688.com                         Tmall.com
 (B2B Ecommerce Marketplace)       (B2C Online Retail Platform)             AliExpress                            Taobao
                                                                     (Global B2B Marketplace)        (Global C2C E-commerce Website)

          Cainiao                           Alimama
(E-commerce Logistics Platform)   (Online Advertising Platform)

                                                                              Ant Financial
                                                                  (Mobile and Online Payments Platform)
                    Other Business Ventures

                                                                            Alibaba Cloud
                                                                     (Cloud Computing Services
                                                                    Provider to Online Businesses)
                                                                                                            Jack Ma (Alibaba Founder)
                                                                                                                                        14
Historically, Alibaba has consistently outperformed Amazon in terms of revenue growth and profit margins.

                              YoY Revenue Growth                                            Profit Margins
  90%                                                                               80%

  80%
                                                                                    60%
  70%
                                                                                    40%
  60%
                                                                                    20%
  50%

  40%                                                                                0%

  30%                                                                               -20%

  20%
                                                                                    -40%
  10%
                                                                                    -60%

                                                                                           2005

                                                                                           2009
                                                                                           1997
                                                                                           1998
                                                                                           1999
                                                                                           2000
                                                                                           2001
                                                                                           2002
                                                                                           2003
                                                                                           2004

                                                                                           2006
                                                                                           2007
                                                                                           2008

                                                                                           2010
                                                                                           2011
                                                                                           2012
                                                                                           2013
                                                                                           2014
                                                                                           2015
                                                                                           2016
                                                                                           2017
                                                                                           2018
                                                                                           2019
    0%
           2011    2012    2013     2014    2015      2016     2017   2018   2019
                                  Alibaba      Amazon                                       Alibaba   Amazon

Data from Bloomberg as of 12/31/2018. Retrieved on 3/31/2020
Past performance does not guarantee future results.
                                                                                                               15
Naspers is a global internet and entertainment group that has grown into one of the largest technology investors in the world.
The company’s investments span the globe and are organized into six business areas: Classifieds, Payments, B2C E-Commerce,
Ventures, Video Entertainment, and Media¹.

                                                                               Naspers has invested in technology companies across the developing world

• Naspers was founded in South Africa in
  1915 as a publisher and printer of
  magazines.

• Naspers has become one of the world’s
  leading technology investors.

• Naspers owned 31.16% of Tencent

• Naspers also has a stake in significant
  publicly traded companies like Mail.ru
  and private investments such as Indian
  E-Commerce company Flipkart.

Source: Naspers, “Financial results presentation for the year ended 31 March 2018”, retrieved 3/31/2020.                                                  16
In order to deliver a precise representation of the emerging markets consumer technology opportunity, we
worked with Solactive to develop the Solactive Emerging Markets Consumer Technology Index.

                      Filtering Process
               for Index Constituent Selection

                                                                   26 eligible countries: Argentina, Brazil, Chile, Colombia, Mexico, Peru, Puerto Rico, Cyprus, Czech Republic,
                     Country Eligibility                           Egypt, Greece, Hungary, Poland, Qatar, Russia, South Africa, Turkey, United Arab Emirates, China, India,
                                                                   Indonesia, South Korea, Malaysia, The Philippines, Taiwan, Thailand

                                                              Minimum 3 month average daily trading volume of $1 million USD
               Stock Size & Trading Minimums                  Minimum Market Cap of 1 billion USD

                                                       Select companies from Internet Retail and Internet Software/Services sub-sector and micro-sectors involved in the
              Industry & Sub-sector Selection          purchase, payment processing, and software for internet and e-commerce transactions

                       Ensure Proper
                                                 To mitigate exposure to any one company, constituents are capped at 3%.
                       Diversification

                           KEMQ
                                           KraneShares seeks to minimize tracking error and trading costs

                                                                Diversification does not ensure a profit or guarantee against a loss.                                              17
Capturing the performance of the EM consumer/technology sector can be complicated.
• In the past, E-Commerce and internet platforms were classified by Global Industry Classification Standards (GICS) as information technology (IT) companies.
• However, as this sector evolved, it ended up grouping social media platforms, E-Commerce, gaming, and internet companies with chip-makers and hardware companies.
• In October 2018, GICS underwent a major reclassification to resolve this issue. Information technology was left with mostly hardware companies, while E-Commerce and
  internet platforms were split between two other sectors: consumer discretionary and communication services (formerly telecommunication services).
• For instance, Alibaba and Mercado Libre were shifted to the consumer discretionary sector, while internet platforms, such as Baidu and Naver, were classified as
  communication services companies.

                    Weight of Select Sectors within the MSCI EM Index                                                Weight of Select Sectors within KEMQ
                            Before and After Reclassification                                                          Before and After Reclassification
            50%         Communication Services
                                                                                                       100%
                                                              Communication Services                                                    Communication
            45%                 5%                                   11%                                90%                               Services
                                                                                                                         Consumer
            40%                                                                                         80%             Discretionary       4%
                                                                                                                                                             Communication
            35%               Consumer                                                                  70%                                                    Services
                                                                                                                            30%
                             Discretionary
                                                                                                                                                                 57%

                                                                                            % Weight
            30%                                                                                         60%
 % Weight

                                 10%
            25%                                                     Consumer                            50%
                                                                   Discretionary
            20%                                                        14%                              40%              Information
                             Information                                                                                                                       Consumer
            15%              Technology                                                                 30%              Technology
                                                                   Information                                               61%              Information     Discretionary
            10%                  28%                                                                    20%                                   Technology          30%
                                                                   Technology
             5%                                                        16%                              10%                                       10%
             0%                                                                                          0%
                       Before Reclassification            After Reclassification                                  Before Reclassification                After Reclassification
            Information Technology   Consumer Discretionary     Communication Services                 Information Technology   Consumer Discretionary      Communication Services

Data from MSCI and Bloomberg as of 3/31/2020.                                                                                                                                        18
EM consumer/technology outperformed developed and emerging markets.
• In order to show the historical performance of the EM consumer/technology sectors within the MSCI EM Index, we combined the Index’s information technology, consumer
  discretionary, and communication services sectors. We used the sectors’ pre- and post-GICS reclassification weightings pictured in slide 15.
• We found that EM consumer/technology outperformed both broad emerging markets and developed markets since the end of the recession, returning 377% against a
  return of 281% for the MSCI World Index and 170% for the MSCI Emerging Markets Index.

                                                                                   EM Consumer/Technology vs.
                                                                                MSCI EM Index and MSCI World Index
                            60,000                                                                                                                                                           GICS
                            55,000
                                                                                                                                                                                        Reclassification
                            50,000
   Growth of 10,000 units

                            45,000
                            40,000
                            35,000
                            30,000
                            25,000
                            20,000
                            15,000
                            10,000
                                 Mar-09   Mar-10    Mar-11        Mar-12          Mar-13           Mar-14           Mar-15          Mar-16           Mar-17          Mar-18             Mar-19     Mar-20

                                             MSCI Emerging Markets Index                             MSCI World Index                               EM Consumer/Technology

Data from Bloomberg as of 3/31/2020. See slide 27 for index definitions. Index returns are for illustrative purposes only. Indexes are unmanaged and one cannot invest directly in an
index. Index returns do not reflect fees or other costs associated with investing. Past performance does not guarantee future returns.
                                                                                                                                                                                                            19
KEMQ offers greater exposure to growth-oriented sectors than the MSCI Emerging Markets Index.

                    100% KEMQ                                  Health Care    100% MSCI EM
        Information                                                3%
                    Health Care      Financials                                   Real Estate
        Technology
                        1%              1%                   Consumer                3%                                             Weight of Growth and Value-Oriented Sectors
             9%                                   Consumer    Staples
                                                   Staples      7%
                                                     1%                                                                                           75% MSCI   50% MSCI   25% MSCI
                                                                                                                                         100%                                      100%
                                                                                           Financials                                               EM /       EM /       EM /
                                                                                                                                        MSCI EM                                    KEMQ
                                                         Communication                        22%                                                 25% KEMQ   50% KEMQ   75% KEMQ
                                                           Services
                Consumer                                     13%                                            Materials
               Discretionary      Communication
                                    Services                                                                  7%             Growth-
                   30%                                                    Consumer
                                      58%                                Discretionary                                       Oriented     58%       69%        79%        89%      99%
                                                                             15%                           Energy            Sectors
                                                                                    Information             6%
                                                                                    Technology           Industrials
                                                                                        17%        Utilities 5%
                                                                                                                              Value-
                                                                                                     2%
                                                                                                                             Oriented     42%       31%        21%        11%       1%
                                                                                                                             Sectors

                                                       Value-Oriented Sectors

Data from Factset as of 3/31/2020. Excluding cash. Due to rounding, may not add up to 100%. See slide 27 for index definitions.
                                                                                                                                                                                          20
Our index filtering process also results in a very different country breakdown than traditional emerging markets.

                             KEMQ Country Breakdown                                               Country Breakdown
             Argentina
                             Russia
                                                                                            KEMQ vs. MSCI Emerging Markets
                3%
                              3%                                                       45
                                         Others                                        40
                       Poland                                                          35
                                           9%
                        3%                                                             30

                                                                            % Weight
                                                                                       25
                South Africa                                                           20
                                                          China
                    4%                                                                 15
                                                          41%
                                                                                       10
             Malaysia
                                                                                        5
               4%                                                                       0
                    Greece
                      5%        Brazil
                                 7%
                                         South Korea
                                            21%
                                                                                              KEMQ    MSCI Emerging Markets

Data from Bloomberg as of 3/31/2020. See page 27 for index definitions
*Others includes Mexico, Thailand, Taiwan, Puerto Rico, India, and Cyprus                                                     21
KEMQ holds significantly fewer state-owned enterprises (SOEs) than the broader MSCI Emerging Markets
Index.

                                                    KEMQ                                                                       MSCI Emerging Markets

                                                     SOE 2%

                                                                                                                                                              SOE
                                                                                                                                                              26%

                                     Non-SOE
                                       98%                                                                                            Non-SOE
                                                                                                                                        74%

Data from Factset and Callan as of 3/31/2020. See slide 27 for index definitions. State-Owned Enterprises as defined by MSCI are companies whose largest shareholder is a government
entity or whose government ownership is over 20%.                                                                                                                                      22
Emerging market internet companies around the world

                                                      23
The KraneShares Emerging Markets Consumer Technology ETF (Ticker: KEMQ) tracks a variety of companies throughout key emerging market countries.

 Top countries and
                              Top Holdings in country        Weight           Company Logo            Company description
 weight within KEMQ

                                                                                                      New Oriental Education & Technology Group, Inc. offers educational services. The Company offers foreign language training, test preparation courses for
 China           40.50%       TENCENT HOLDINGS               3.93%                                    admissions and assessment tests in the United States, the PRC and Commonwealth countries, primary and secondary school education, development
                                                                                                      and distribution of educational content, software and other technology, and online classes.

                                                                                                      NAVER Corporation provides Internet site with web portal services, such as search engine, online game, and content development. The Company also
 South
 Korea
                 21.52%           NAVER CORP                 3.78%                                    offers online marketing service through banner advertisement and e-commerce services. The company owns the popular Line app, which is used
                                                                                                      primarily used in Japan and South Korea but also present in over 230 countries worldwide. Line offers services similar to WhatsApp and WeChat

                                                                                                      B2W Companhia Digital is an e-commerce company. The Company offers technology, logistics, distribution, customer service, and consumer financing
 Brazil          7.22%          B2W CIA DIGITAL              2.19%                                    services.

                                                                                                      Hellenic Telecommunications Organization S.A. provides telecommunication services. The company offers fixed-line. television and mobile
 Greece          4.80%        HELLENIC TELECOM               2.63%                                    telecommunications services including voice, broadband, data, and leased lines. The company serves the audio-visual, communications, industrial, and
                                                                                                      residential industries, as well as public customers.

                                                                                                      Telekom Malaysia Berhad establishes, provides, and maintains telecommunication and related services. Through its subsidiaries, the Company provides
 Malaysia        3.75%     TELEKOM MALAYSIA BHD              3.01%                                    payphone network, mobile telecommunication, public telephone, and leasing of optical fiber telecommunication system services. Telekom also manages
                                                                                                      and operates Kuala Lumpur Tower and provides intelligent security services

                                                                                                       As a holding company, Naspers mainly grows through acquisitions and equity stakes in companies in emerging markets. It also plans to focus on
 South
 Africa
                 3.64%            NASPERS LTD                3.64%                                    investment in technology; the company has worked to upgrade and improve its subscriber and user platforms by investing in e-commerce transaction
                                                                                                      platforms and instant-messaging communication.

                                                                                                      Cyfrowy Polsat, S.A. offers broadcast satellite subscription television services and mobile telephony in Eastern and Central Europe. The Company
 Poland          3.40%       CYFROWY POLSAT SA               2.64%                                    distributes signal decoders and offers a variety of television and radio channels.

                                                                                                      MercadoLibre Inc. operates an online trading site for the Latin American markets. The Company's website allows businesses and individuals to list items
 Argentina       3.21%        MERCADOLIBRE INC               3.21%                                    and conduct sales and purchases online in either a fixed-price or auction format. MercadoLibre offers classified advertisements for motor vehicles,
                                                                                                      vessels, aircraft, real estate and services, and offers online payment services.

                                                                                                      Mail.Ru Group Ltd. offers Internet access services in Russia. The Company also operates social networking websites, instant messaging networks, an
 Russia          2.78%          MAIL.RU GROUP                2.78%                                    email service, and an online games company.

 Data is for informational purposes only and does not represent the ETF. Sector and country weightings from Bloomberg as of 3/31/2020. Company descriptions from Bloomberg as of 12/31/2019. See page 21 for top 10 holdings.                                24
Fund Details                       As of 3/31/2020                    Top Ten Holdings as of 3/31/2020                  % of
                                                                                                                                                    The Fund’s Holdings Are Subject to Change.        Fund
                                                                              Primary Exchange                   NYSE
                                                                                                                                                    TENCENT HOLDINGS LTD                              3.95
KraneShares Emerging Markets                                                  Cusip                              500767876
                                                                                                                                                    NETEASE INC-ADR                                   3.91
Consumer Technology ETF (NYSE: KEMQ)                                          Total Annual Fund Operating
                                                                                                                 0.80%                              TAL EDUCATION GROUP- ADR                          3.88
                                                                              Expense (Gross)
Investment Strategy:
                                                                              Total Annual Fund Operating                                           JD.COM INC-ADR                                    3.83
KEMQ seeks to track the Solactive Emerging Markets                                                               0.70%*
Consumer Technology Index. The Index selects companies                        Expense (Net)                                                         NAVER CORP                                        3.80
from 26 eligible countries within emerging markets whose
                                                                              Inception Date                     10/11/2017                         ALIBABA GROUP HOLDING-SP ADR                      3.73
primary business or businesses are internet retail, internet
software/services, purchase, payment processing, or software                  Distribution Frequency             Semiannually                       NASPERS LTD-N SHS                                 3.66
for internet and E-Commerce transactions.
                                                                                                                 Solactive Emerging Markets         BAIDU INC - SPON ADR                              3.56
                                                                              Index Name                         Consumer Technology
                                                                                                                 Index                              NEW ORIENTAL EDUCATIO-SP ADR                      3.34

                                                                              Index Ticker                       Bloomberg: SOLEMCT                 MERCADOLIBRE INC                                  3.23

KEMQ Performance History as of 3/31/2020                                      Number of Holdings (ex Cash)       50

                                                               Cumulative %                                                                             Average Annualized %

                                     3 Mo                         6 Mo                         Since Inception                     1 Yr                          3 Yr                    Since Inception
 Fund NAV                                      -18.61%                    -8.46%                           -20.43%                        -13.29%                              –                      -8.84%
 Closing Price                                 -18.12%                    -7.62%                           -20.19%                        -13.25%                              –                      -8.72%
 Index                                         -18.60%                    -8.53%                           -17.75%                        -12.69%                              –                      -7.60%

 *Fee waivers in effect until August 1, 2021
 The performance data quoted represents past performance. Past performance does not guarantee future results. The investment return and principal value of an investment will fluctuate so that an
 investor's shares, when sold or redeemed, may be worth more or less than their original cost and current performance may be lower or higher than the performance quoted. For performance data
 current to the most recent month end, please visit www.kraneshares.com
 Index returns are for illustrative purposes only. Index performance returns do not reflect any management fees, transaction costs or expenses. Indexes are unmanaged and one cannot invest directly
 in an index.

                                                                                                                                                                                                             25
Key Takeaways
• Our China experience has allowed us to identify and deliver
  extraordinary opportunities across emerging markets

• The three P’s will shape buying behavior for decades to come

     o Population: The middle class consumer

     o Penetration: Rapid internet adoption

     o Performance: The growth of technology platforms

• Many of the themes and opportunities that we observe in China
  extend across the Emerging Markets and include the
  consumer, technology, healthcare, the environment and
  electric vehicles

                                                                  26
Index Definitions:

CSI Overseas China Internet Index: Represents the Chinese internet companies listed in overseas markets (New York and Hong Kong), in order to
measure the performance of the Chinese internet companies listed outside mainland China.

MSCI China Index: The MSCI China Index captures large and mid cap representation across China H shares, B shares, Red chips and P chips.

The MSCI Emerging Markets Index: Captures large and mid cap representation across 23 Emerging Markets (EM) countries.

MSCI World Index: The MSCI World Index is a free-float weighted equity index. It was developed with a base value of 100 as of December 31, 1969. The
index includes developed world markets and does not include emerging markets.

The Solactive Emerging Markets Consumer Technology Index: The Solactive Emerging Markets Consumer Technology Index selects companies from
26 eligible countries within emerging markets whose primary business or businesses are internet retail, internet software/services, purchase,
payment processing, or software for internet and E-Commerce transact.

The S&P 500 Index: The S&P 500 Index is an American stock market index based on the market capitalization of the 500 largest companies having
common stock listed on the NYSE or NASDAQ.

Term Definitions:
Purchasing Power Parity (PPP): is an economic theory that compares different countries' currencies through a market "basket of goods" approach.
According to this concept, two currencies are in equilibrium or at par when a market basket of goods (taking into account the exchange rate) is priced
the same in both countries.

                                                                                                                                                     27
Important Notes
Carefully consider the Funds’ investment objectives, risk factors, charges and expenses before investing. This and additional information can be
found in the Funds‘ full and summary prospectus, which may be obtained by visiting www.kraneshares.com. Read the prospectus carefully before
investing.
ETF shares are not redeemable with the issuing fund other than in large Creation Unit aggregations. Instead, investors must buy or sell ETF Shares in
the secondary market with the assistance of a stockbroker. In doing so, the investor may incur brokerage commissions and may pay more than net
asset value (NAV) when buying and receive less than net asset value when selling. The NAV of the Fund’s shares is calculated each day the national
securities exchanges are open for trading as of the close of regular trading on the New York Stock Exchange (“NYSE”), normally 4:00 P.M. Eastern time
(the “NAV Calculation Time”). Shares are bought and sold at market price not NAV. Closing price returns are based on the midpoint of the bid/ask
spread at 4:00 P.M. Eastern Time (when NAV is normally determined).
Narrowly focused investments typically exhibit higher volatility. The ability of the Emerging Markets Consumer Technology Index ETF to achieve its
investment objective is dependent, in part, on the continuous availability of A Shares and the ability to obtain, if necessary, additional A Shares quota.
The fund may invest in derivatives, which are often more volatile than other investments and may magnify the Fund's gains or losses. The Fund may
engage in securities lending. The Fund is non-diversified.
Investing involves risk, including possible loss of principal. There can be no assurance that a Fund will achieve its stated objectives. The Funds are
subject to political, social or economic instability within China which may cause decline in value. Fluctuations in currency of foreign countries may
have an adverse effect to domestic currency values. Emerging markets involve heightened risk related to the same factors as well as increase volatility
and lower trading volume.
Although the information provided in this document has been obtained from sources which Krane Funds Advisors, LLC believes to be reliable, it does
not guarantee accuracy of such information and such information may be incomplete or condensed.
The KraneShares ETFs are distributed by SEI Investments Distribution Company (SIDCO), which is not affiliated with Krane Funds Advisors, LLC, the
Investment Adviser for the Fund.

                                                                                                                                                             28
Although Krane Funds Advisors LLC and its affiliates (“Krane”) shall obtain data from sources that Krane considers reliable, all data contained herein
is provided “as is” and Krane makes no representation or warranty of any kind, either express or implied, with respect to such data, the timeliness
thereof, the results to be obtained by the use thereof or any other matter. Krane expressly disclaims any and all implied warranties, including without
limitation, warranties of originality, accuracy, completeness, timeliness, non-infringement, merchantability and fitness for a particular purpose.
Forward-looking statements (including Krane’s opinions, expectations, beliefs, plans, objectives, assumptions, or projections regarding future events
or future results) contained in this presentation are based on a variety of estimates and assumptions by Krane. These statements generally are
identified by words such as “believes,” “expects,” “predicts,” “intends,” “projects,” “plans,” “estimates,” “aims,” “foresees,” “anticipates,” “targets,”
“should,” “likely,” and similar expressions. These also include statements about the future, including what “will” happen, which reflect Krane’s
current beliefs. These estimates and assumptions are inherently uncertain and are subject to numerous business, industry, market, regulatory, geo-
political, competitive, and financial risks that are outside of Krane’s control. The inclusion of forward-looking statements herein should not be
regarded as an indication that Krane considers forward-looking statements to be a reliable prediction of future events and forward-looking
statements should not be relied upon as such. Neither Krane nor any of its representatives has made or makes any representation to any person
regarding forward-looking statements and neither of them intends to update or otherwise revise such forward-looking statements to reflect
circumstances existing after the date when made or to reflect the occurrence of future events, even in the event that any or all of the assumptions
underlying such forward-looking statements are later shown to be in error. Any investment strategies discussed herein are as of the date of the
writing of this presentation and may be changed, modified, or exited at any time without notice.
This material represents an assessment of the market environment at a specific point in time and is not intended to be a forecast of future events, or
a guarantee of future results. This information should not be relied upon by the reader as research or investment advice regarding the funds or any
stock in particular. [R_US_KS_SEI]

                                                                                                                                                        29
You can also read