INVESTOR RELATIONS PRESENTATION - NASDAQ: CPST| February 2020 Saving Money and the Environment - One Turbine at a Time - cloudfront.net
←
→
Page content transcription
If your browser does not render page correctly, please read the page content below
INVESTOR RELATIONS PRESENTATION

NASDAQ: CPST| February 2020

                                  Saving Money and the Environment –
                                              One Turbine at a Time.
Safe Harbor

   This presentation contains “forward-looking statements” regarding future events or financial performance of
   Capstone Turbine Corporation (Capstone), within the meaning of the Safe Harbor provisions of the Private
   Securities Litigation Reform Act of 1995.

   Forward-looking statements may be identified by words such as “believe,” “expect,” “objective,” “intend,”
   “targeted,” “plan” and similar phrases.

   These forward-looking statements are subject to numerous assumptions, risks and uncertainties described in
   Capstone's Annual Report on Form 10-K, Quarterly Reports on Form 10-Q and other periodic filings with the
   Securities and Exchange Commission that may cause Capstone's actual results to be materially different from
   any future results expressed or implied in such statements. Because of the risks and uncertainties, Capstone
   cautions you not to place undue reliance on these statements, which speak only as of the date of this
   presentation. We undertake no obligation, and specifically disclaim any obligation, to release any revision to
   any forward-looking statements to reflect events or circumstances after the date of this presentation or to
   reflect the occurrence of unanticipated events.
Changing Energy Markets

 The Imminent
 Change
 In Global Energy

  Change is the law of life.
  And those who look only to
  the past or the present are
  certain to miss the future.

             John F. Kennedy

   Capstone Provides Behind the Meter Distributed Energy Solutions   3
Capstone Turbine Advantages

 FEATURES & BENEFITS

    Inverter Based w/ One Moving Part         Fuel Availability
    Low operating costs                       Operates on gaseous, renewable, and
                                              liquid fuels

    Patented Air Bearing Technology           Free Clean Waste Heat
    No lubricants or coolants needed          Thermal energy for
                                              cogeneration/trigeneration

    Low Emissions                             Remote Monitoring
    No exhaust aftertreatment                 View performance and diagnostics 24/7

    High Power Density                        Scalable To Match Demand
    Compact footprint, small modular design   Multiple applications and industries

    Stand Alone Or Grid Connect               Potential Emissions Credits
    Supports aging utility infrastructure     Offset project costs

                                                                                      4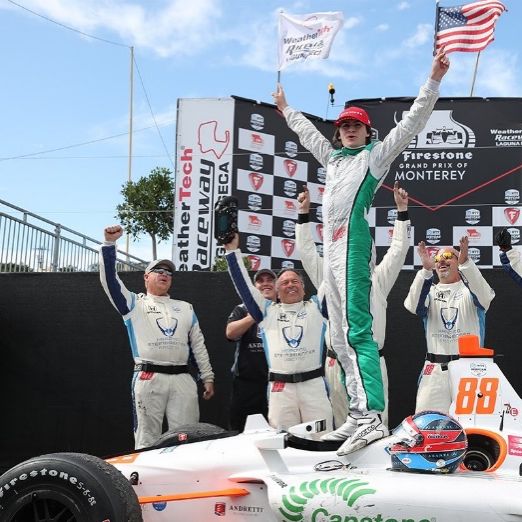
Energy Efficient Turbine Products

                                     ELECTRIC

   HOT WATER

                                       STEAM

  CHILLED WATER

                                    DIRECT DRYING

                                                    5
                                                    5
Capstone Customer Benefits

                             6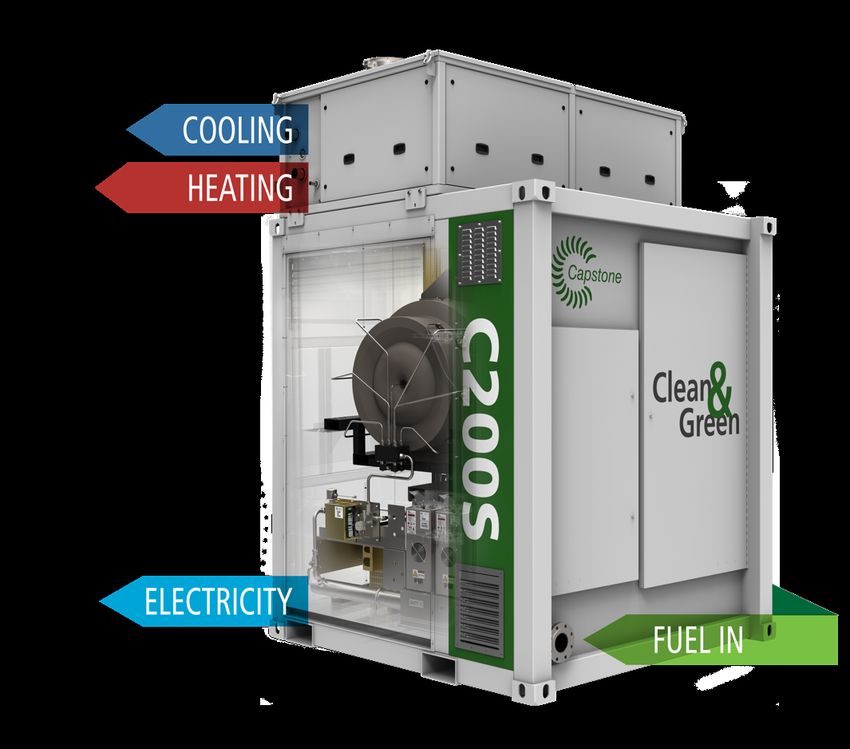
Capstone Growth Catalysts

                            Focus on Reducing Costs

                                Low Cost Natural Gas

                                    Microgrid Adoption

                                     Gas Flaring Regulations

                                      New Engine Emissions

                                      Green Building (LEED)

                                         Severe Weather

                                    Increasing Oil Prices

                               Federal & State Subsidies

                                Electrification
                                                               7
Positive Adjusted EBITDA Initiative

• Lower quarterly operating expenses from an
   average of $6.5M to a range of $5.2M to $5.7M
• Reduce direct material costs $3M annually
• Cut annual R&D spend by approximately 15%,
   delaying all non-essential product development
• Expand long-term microturbine rental fleet from
   current 7 MW up to 10 MW
• Increase aftermarket spare parts margins with
   newly upgraded United Kingdom Integrated Remanufacturing Facility (IRF)
• Help key distributors achieve higher Factory Protection Plan (FPP) service contract
   attachment rates from 38% of 45%
• Continue to focus on improving product reliability and drive warranty expenses from
   approximately 3% down to 1%
• Increase distributor management and push performance to produce near-term product
   backlog and revenue growth
• Hire additional salespeople for National Account development to drive incremental
   business for Capstone
                                                                                        8
New Product Growth Strategy

     New Sales Focus on OEMs, Direct Business & National Accounts   9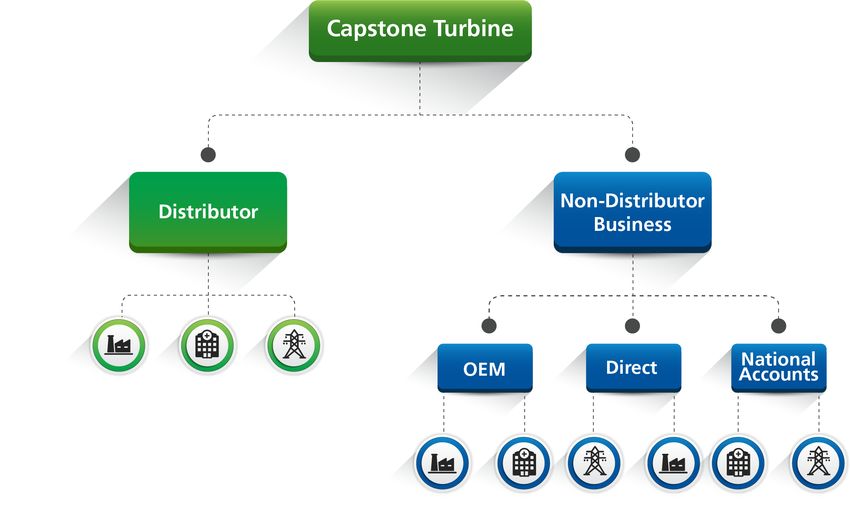
New Direct Sales Strategy

  RENTAL                    PROJECT
  SYSTEMS                   DEVELOPMENT
  §   Oil & Gas             §   Major Projects
  §   C&I                   §   Energy Auditing
  §   High Margin           §   High Margin
  §   Reoccurring           §   Reoccurring
      Revenue                   Revenue

  KEY                       PARTNERSHIPS
  ACCOUNTS                  /JV’s
  §   National Accounts     § BOP Products
  §   OEMs                  § Complementary
  §   IndyCar                 Technologies
  §   Rental                § New Technologies
                            § Services

                                                  10
Revenue Growth Strategy
OEM, Direct Sales, National Accounts, Implementation of Target
Expanded Product Portfolio, Pricing Programs for key
New Product Partnerships, National Accounts, OEMs
Rentals, 247 Solar, B+K
New Non- Target Pricing
Distributor Program
Business
Product + Service
Expanded Distribution Product + Accessories
in new geographies like
Eastern Europe, Africa Distribution
GROWTH Sales
+ Service Installation +
Product + Accessories
and the Middle East Improvement STRATEGY Bundling
+ Service
Improving C200/C1000
product performance by
Customized products by Marketing Customer
June with new parts
market with matched & Strategy Satisfaction
suppliers replacing
marketing campaigns. legacy supplier with poor
Improved targeted marketing manufacturing quality.
and branding strategy. Improving reliability, lower
Maximize marketing IRR Warranty and FPP costs.
11Strengthening Aftermarket
Aftermarket is now composed of a healthy mix of offerings 54% of Eligible Fleet (in MW) Covered Under FPP
(incl. EXW & RSS)
with both stable recurring revenue and higher margins Standard
• FY20 is the culmination of a multi-year aftermarket strategic plan
Warranty
11%
• Positions Capstone for profitable growth beginning in FY21 T&M
33%
Russia
Factory Protection Plan (FPP) long-term service contracts T&M (not
eligible)
17%
• FPP Backlog hits a record $83.7M on December 31, 2019
• 54% of eligible fleet (265 MW) now covered under FPP
Strong OEM parts business with healthy margins
• $10.8M shipped YTD with >50% gross margin FPP*
• Annual spare parts price increase 39%
Growing long-term rental business with healthy margins
• 13% Q/Q growth with >50% gross margin
• Expands to 7 MW vs. a target of 10 MW
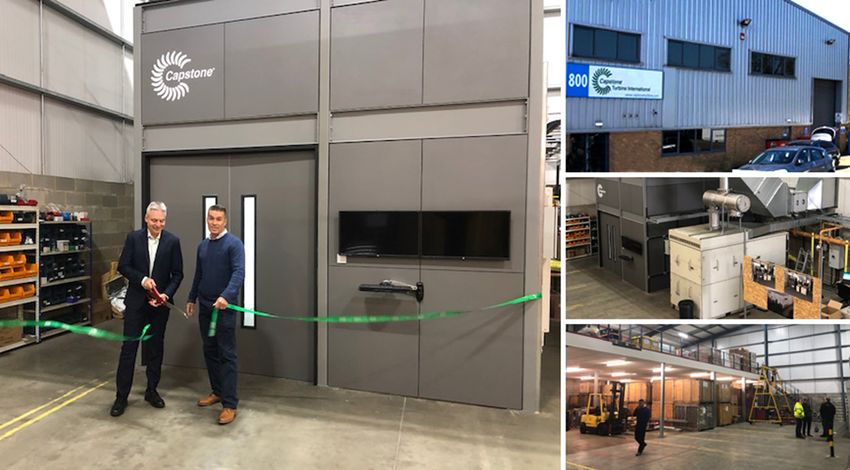
United Kingdom Integrated Remanufacturing Facility (IRF)
ribbon cutting completed in December 2019
• Full Grid Connect test capability on schedule for early 2020
• Average 40% cost reduction using remanufactured parts for FPP
• Drives continued margin expansion of Capstone’s aftermarket
service business
Aftermarket Business Continues to Anchor Sustainable Profitability Strategy 12DMC Cost Savings, Annualized
Other, $500K
Super Alloys
Stators
Injector Line,
Batteries
$400K
Injector Line
$3 Million in Other
DMC Cost
Savings
Batteries, Super Alloys,
$200K $1,500K
Stators, $400K
$3 Million in DMC Savings Supports Improved Product & Aftermarket Margins 13Energy Efficiency & Renewables
Continue to Expand Globally
Three Months Ended
6%
12%
24%
Energy
Efficiency 40%
Natural
Resources
2019 Renewable 2018
Energy
22%
Microgrid
42%
54%
Nine Months Ended
6%
15%
8%
40%
Energy
Efficiency
Natural
2019 Resources
2018
Renewable
31% Energy
Microgrid
48%
54%
14New 100% Renewable Products
100% renewable project with new customer, 247Solar,
together we are installing a solar-powered microturbine at
a test site in Morocco using concentrated solar energy to
expand superheated air across the Capstone microturbine
to generate 100% renewable power with our
microturbines. Once completed, 247Solar has a host of
additional opportunities.
An illustration of the pre-engineered 247Solar Plant, outfitted with Capstone microturbines.
Another 100% renewable project is with a German company,
B+K, that is using wood waste to generate superheated air
and also expanding it across the Capstone microturbine. B+K
has been operating a Capstone powered pilot project for
more than a year and is moving into commercial sales, with
several projects planned in 2020.
An illustration of the pre-engineered ClinX CHP solution, outfitted with Capstone microturbine
15
15New Renewable Fuels
H Y D R O G E N M E T H A N O L
Capstone will soon offer renewable power Capstone has worked with a Swiss company
with the use of hydrogen in our product line for years, operating a C30 on methanol. We
of microturbines as a fuel source. Today we just completed a multi-year test program,
have operated on a blend of natural gas and and together we are exploring the use of
hydrogen, and we have a plan to release a our full line of turbines as they move from
commercial 100% hydrogen fuel capable the product development into the
microturbine over the next couple of years. commercial deployment phase.
16New Annual Target vs. FY2014
Actual – Business Comparison
New Annual
(in millions) FY14 (A) Y/Y $ ∆ Y/Y % ∆
Target
Product Revenue $ 86.5 $ 108.8 $ (22.3) (20%)
Accessories, Parts & Service Revenue 44.4 24.3 20.1 83%
Revenue 130.9 133.1 (2.2) (2%)
Direct Materials 74.5 83.4 8.9 11%
Warranty 2.6 3.9 1.3 33%
Royalties 0.2 2.9 2.7 93%
Manufacturing & Service costs 15.3 21.3 6.0 28%
Cost of Goods Sold 92.6 111.5 18.9 17%
Gross Margin 38.3 21.6 16.7 77%
Gross Margin % 29% 16%
Product Development 3.6 9.0 5.4 60%
Selling, G&A 23.7 27.9 4.2 15%
Total Operating Expenses 27.3 36.9 9.6 26%
Operating Income (Loss) 11.0 (15.3) 26.3 172%
Adjusted EBITDA $ 13.2 $ (10.8) $ 24.0 (222%)
17Capstone’s Focus on ESG
Increasing focus on Environmental, Social and Governance (ESG), principals, regulations and government policies
is creating a strong tailwinds for the renewable energy sector globally. There's growing investor interest with ESG
investing estimated to be over $20 trillion in AUM as investors demand corporate responsibility.
ENVIRONMENTAL SOCIAL
§ Capstone (CPST) manufactures reliable and energy dense § Capstone, through its Capstone Cares program, sponsors paid
power systems that allow customers to lower both NOx and employees to volunteer work in the local community and
routinely conducts annual toy, book, and blood donation drives.
CO2 emissions without the use of exhaust after treatment that
use precious metals and urea. § The Capstone Culture Club puts on company sponsored
employee events, ranging from health & fitness activities, team
§ In FY2019, CPST customers benefited from 350,000 tons in building events, social events and celebrations.
carbon savings while also saving $253 million in energy costs.
§ Capstone U is a company sponsored employee led internal
§ CPST is developing new 100% renewable products together education program that is free and open to all employees.
with new renewable fuels (hydrogen and methanol), allowing § The Capstone EH&S Team works continuously to achieve a
customers to generate power with a net-zero carbon footprint. zero waste facility, eliminate all lost time injuries, and reduce
§ CPST strives to improve the oil & gas industry by offering near miss accidents.
cleaner and “greener” power solutions that reduce methane
emissions while utilizing associated gas that would otherwise GOVERNANCE
be flared into the atmosphere.
§ Capstone has a highly diverse set of outside Board of Directors
§ CPST supports energy efficiency initiatives through CHP and comprised of 3 women and 4 men, with a female Chairperson
the U.S. DOE CHP Technical Assistance Partnership. and Audit Committee lead.
§ 7 of the 8 CPST Board of Directors are outside independent
directors who are free of any conflicts of interest and had no
prior relationship with the President & CEO.
§ The company subscribes to the highest levels of oversight,
director education and management transparency.
§ Capstone has worked diligently over the last several years on
board “refresh” and each director is up for election annually.
18Financial & Market Statistics
Comparison
Selected Public Companies
($ in millions)
Financial Statistics Market Statistics
IPO Revenue Gross GM % OPEX EBITDA Revenue Per Market Cap Cash Q/Q in
Company (1) Margin Employee (2) (3) Cash
Capstone Turbine Corporation (4) 31 $17.4 $2.6 15.0% $6.3 ($3.2) $0.11 $22.0 $16.75 ($4.2)
Small-Cap Distribution Generation
American Superconductor Corp.(5) 32 14.0 0.4 3.0% 7.9 (3.1) 0.06 142.8 52.8 (21.1)
Ballard Power Systems(6) 11 24.8 6.2 25.0% 13.0 (22.4) 0.05 2,278.0 153.3 (10.3)
FuelCell Energy(7) 27 47.9 3.2 7.0% 11.3 (6.2) 0.16 356.5 87.4 13.6
Plug Power, Inc.(8) 22 56.4 5.3 9.3% 18.4 2.5 0.08 1,164.0 79.0 39.8
Avg. selected companies 23 $35.8 $3.8 11.1% $12.7 ($7.3) $0.09 $985.3 $93.1 $5.5
(1) Years since incorporation or first initial public offering
(2) Source: Nasdaq as of January 31, 2020
(3) Cash, cash equivalents and restricted cash
(4) Source: Capstone Turbine Corporation's February 2020 Form 10-Q filing
(5) Source: American Superconductor Corporation's November 2019 Form 10-Q filing
(6) Source: Ballard Power Systems third quarter financial report issued November 2019 on company’s website
(7) Source: FuelCell Energy’s January 2020 Form 10-K filing
(8) Source: Plug Power, Inc. November 2019 Form 10-Q filings
Capstone Beats Average in GM %, OPEX & EBITDA with Lower Market Cap 19Q&A SESSION
Nasdaq: CPSTAPPENDIX
Nasdaq: CPSTQ3 FY2020 Business Highlights • Total gross margin increased $0.4 million, or 18%, to $2.6 million compared to $2.2 million in the year-ago quarter despite lower product shipments. • Gross margin percentage expanded by 25% to 15% from 12% in the year-ago quarter but was flat on a sequential basis despite lower revenues. • Accessories, parts, service, rental, and Distributor Support System (DSS) revenue was $9.5 million, up 20% from $7.9 million in the year-ago quarter. • Rental fleet revenue grew 13% sequentially, and this high margin long-term rental fleet now stands at 7 MW approaching the planned 10 MW. • Book-to-bill ratio was 1.2:1 for the third quarter of fiscal 2020 compared to 1.0:1 in the second quarter of fiscal 2020 and 1.3:1 in the year-ago quarter. • Capstone received $1.9 million in calendar 2019 from the DSS program. • Total revenue for the third quarter of fiscal 2020 was $17.4 million compared to $18.0 million in the year-ago third quarter. Q3 Shows Progress Against Strategic Business Initiatives 22
Q3 FY2020 vs. Q3 FY2019
Financial Results

 (In millions)                                                         Q3 FY20   Q3 FY19
                                               Microturbine Product      $7.9     $10.1
                                        Accessories, Parts & Service     $9.5      $7.9
                                                      Total Revenue     $17.4     $18.0

                                                      Gross Margin       $2.6      $2.2
                                              Gross Margin Percent      15%       12%

                                                     R&D Expenses        $1.0      $0.9
                                                   SG&A Expenses         $5.3     $4.6**
                                           Total Operating Expenses      $6.3     $5.5**

                                                           Net Loss     $(4.9)    $(3.4)
                                                 Adjusted EBITDA*       $(2.7)   $(2.3)**

*See Appendix, Slide 34
**Includes $400k of Bad Debt Recovery
                                                                                            23
Q3 FY2020 vs. Q2 FY2020
Financial Results
(In millions) Q3 FY20 Q2 FY20
Microturbine Product $7.9 $12.0
Accessories, Parts & Service $9.5 $8.7
Total Revenue $17.4 $20.7
Gross Margin $2.6 $3.1
Gross Margin Percent 15% 15%
R&D Expenses $1.0 $0.9
SG&A Expenses $5.3 $5.5
Total Operating Expenses $6.3 $6.4
Net Loss $(4.9) $(4.4)
Adjusted EBITDA* $(2.7) $(2.2)
*See Appendix, Slide 34
24Q3 FY2020/Q2 FY2020
Balance Sheet
(In millions) December 31, 2019 September 30, 2019
Cash & Cash Equivalents $16.7 $20.9
Cash Used in Operating Activities $4.3 $6.3
Accounts Receivable,
$19.8 $18.1
Net of Allowances
Total Inventories $22.1 $21.3
Accounts Payable &
$19.4 $15.9
Accrued Expenses
$30M Goldman Sachs 3-Year Term Note Increases Financial Flexibility 25Planned Safety Power
Shutdown Marketing Initiatives
Print Advertising
• Two ¼ page advertisements placed in the main sections of the
“Sacramento Bee” Sunday and mid-week issues.
• Incoming leads/inquiries tracked with QR code and in-bound
call metrics tracking software.
Social Media – Paid and Organic
• Targeted paid advertising on LinkedIn and Facebook –
Focus on industrial/commercial customers by location.
• Organic (non-paid) advertising on all corporate
accounts (Facebook, Twitter, LinkedIn, Instagram)
Custom Landing Page
• Custom landing page was created on corporate website to qualify and score incoming leads.
• All lead data is automatically entered and tracked in customer relationship management (CRM) system.
26New Technology Roadmap
6 STEPS TO
SUCCESS
C65 SIGNATURE
ELECTRONICS
MODERNIZATION
HYDROGEN
CAPABILITIES NEW C250S
& C1250S
SERIES
MICROGRID
PRODUCTS
RENEWABLE
TECHNOLOGY
27New Technology &
Product Development
Capstone received two new patents by the U.S. Patent and Trademark Office
1. Patent 10,184,664, is for a multiple-fuel
capable, pre-mixed, low emission injector
for high flame speed fuel combustion.
2. Patent 10,197,282, is for a multi-staged,
lean pre-vaporizing, pre-mixing fuel injector
providing ultra-low emissions that meet
EPA Tier 4 requirements for power
generation.
These two patents support Capstone’s Technology Roadmap –
Targeting the expansion of multiple fuels, including high flame speed fuels such as
Hydrogen, while also maintaining Capstone’s industry-leading low emissions 28Strong Market Diversification
ENERGY NATURAL RENEWABLE CRITICAL POWER MICROGRID/ZERO
EFFICIENCY RESOURCES ENERGY SUPPLY EMISSION SYSTEMS
APPLICATIONS INCLUDE:
Large Retailers, Oil & Gas, Land Rigs, Wastewater Treatment Data Centers, Hospitals, Manufacturing, Retail,
Hospitality, Office Water Conversion, Gas Plants, Farm Digesters, Telecom, Power Rentals Hospitality, Data Center
Buildings, Recreation Compression Landfills,Food Processing
• SL Green Realty • Shell • Durango WWTP • Intel Data Center • Sierra Nevada
• Related Properties • EQT Corporation • Oneida WWTP • Kaiser Hospital • Philly Navy Shipyard
• Tishman Speyer • XTO Energy • Dallas WWTP • Kings County • Stone Edge Farms
• Brandywine • California Resource • Tuscany WWTP • Dryden Hospital • Open Access Tech
• Capreit • Williams Company • Carmel WWTP • Auburn Hospital • Goldwind, China
• Host Properties • Anadarko • Great Neck WWTP • Pertimina Hospital • Gordon Bubolz
• Marriott • Occidental • Taiwan Swine Farm • Memorial Sloan Kettering • Plaza Extra
• Wyndham • Pioneer • Malaysian Palm Oil Farms • White Memorial • Mali, Africa
• Woods Bagot • Pacific Resources • 247Solar
• B+K
29Strong Geographic
Diversification
Company continues to diversify
into new market verticals and
new geographies.
Ø During Fiscal Year 2019, we secured orders from 63
different distributors, representing 41 different countries.
63
Distributors
41
Countries
30Sample Customer Economics
Economics Microturbines Fuel Cell
Total System Cost $/kW 2,100 6,440
Investment Tax
$/kW 210 1,930
Credit
Annual
$/kW 140 200
Maintenance Cost
Years Simple Payback Comparison @ Gas Price = 6.50 $/MMBtu
40
Capstone Microturbine
35
w/o ITC
30
Bloom Energy w/o ITC
25
20
Capstone
15 Microturbines w/ ITC
10 Bloom Energy w/ ITC
5
0 Electricity Price
0.08 0.1 0.12 0.14 0.16 0.18 0.2 0.22 0.24
Source: EIA 12 month average industrial gas price $4.20
12 month average commercial gas price $8.10
31Leadership Team
Darren Jamison
President & Chief Executive Officer
Eric Hencken James Crouse Jeff Foster Kirk Petty Jennifer Derstine
Chief Financial Officer Chief Revenue Officer Senior Vice President of Senior Vice President Vice President of Marketing
& Chief Accounting Officer Customer Service & Product of Operations & Distribution
Development
32Board of Directors
• Independent director for companies in the chemical, industrial and contract • Previously an independent director for Maxwell Technologies, Magnetek
manufacturing sectors; previously a director for companies in the oilfield services Incorporated, Bioscrip Incorporated, and U.S. Oncology Corporation, companies
and packaging sectors in energy, automation and healthcare industries
• Group Vice President, Petrochemicals and Group Vice President, Strategy for • Chair of Audit, Compensation, or Nominating & Governance Committee for a
BP plc/Amoco Corporation, a $250 billion oil, gas, and energy company, through number of Boards
2005 • Chief Financial Officer of four publicly traded companies, including AdvancePCS,
• Executive roles with BP/Amoco in business management, business development Informix Corporation, Oxford Health Plans, Inc., and WellPoint, Inc. through 2004
and mergers & acquisitions, residing in North America, Asia and Europe
Chair of the Audit Committee
Chair of the Board Member of the Compensation Committee
HOLLY YON
Member of the Audit Committee
VAN DEURSEN JORDEN
• Managing Director, Echo Holdings, LLC, advisory services for M&A in oil and gas • Managing Principal of Sustainability Excellence Associates, LLC, a consulting firm
since 2019 specializing in strategic planning for sustainability and environment 2009-2016
• Chief Executive Officer, Boomerang Tube, LLC, a supplier of steel pipes and • Vice President, Corporate Sustainability Strategies, MGM Resorts International,
services for the energy industry 2018-2019 one of the world’s leading global hospitality companies 2006-2008
• Chief Executive Officer, Epic Industrial Solutions, LLC, provider of parts and • Leadership roles with Ford Motor Company and Visteon Corporation, including
services for industrial engines and compressors in the oil, gas and industrial Director of Distributed Power Generation and Director of Government Affairs and
markets 2015-2018 Corporate Responsibility
• Chief Executive Officer, Southwest Oilfield Products, Inc., an aftermarket
supplier for drilling rigs 2012-2015 Chair of the Compensation Committee
Member of Nominating and Corporate Governance Committee
PAUL Chair of Nominating and Corporate Governance Committee
GARY
DEWEESE MAYO
• President and Chief Executive Officer, Dynegy Inc., an independent power • President and Chief Executive Officer, National Association of Water Companies
producer and electricity marketer 2011-2018 since 2018
• Chief Financial Officer of UGI Corporation, a distributor and marketer of energy • Commissioner for the Federal Energy Regulatory Commission 2017-2018
products and services in 2011; and Chief Financial Officer then Chief Operating • Served on the Pennsylvania Public Utility Commission 2008-2017, as Chair 2011-
Officer of NRG Energy, Inc., a power generation and electricity marketer 2015, and on Pennsylvania’s Marcellus Shale Advisory Commission 2011
2004-2009 • President of the National Association of Regulatory Utility Commissioners,
• Chief Executive Officer of Foster Wheeler, a Swiss global engineering 2011-2017
conglomerate 2009-2010
Member of Nominating and Corporate Governance Committee
ROBERT Member of Audit Committee ROBERT
Member of the Compensation Committee
FLEXON POWELSON
• President and Chief Executive Officer, Capstone Turbine Corporation since 2006 • Executive Vice President and President, New Business, for NRG Energy, Inc., a
• President and Chief Operating Officer for Northern Power Systems, Inc., a Fortune 500 company that generates electricity and provides energy solutions
company that designs, manufactures and sells wind turbines into the global and natural gas to its customers 2011-2016
marketplace 2003-2006 • Executive Vice President & Chief Administrative Officer for NRG Energy
• Vice President and General Manager of Distributed Energy Solutions for 2006-2011
Stewart & Stevenson Services, Inc., a leading designer, manufacturer and • Executive leadership roles in human resources for Nash-Finch Company, Metris
marketer of specialized engine-driven power generation equipment to the oil and Companies, Inc. and General Electric
gas, renewable and energy efficiency markets 1996-2003
Member of Nominating and Corporate Governance Committee
DARREN DENISE Member of Compensation Committee
JAMISON WILSON 33Reconciliation of Non-GAAP
Financial Measure
Reconciliation of Reported Net Loss to EBITDA and Adjusted EBITDA Three months ended Nine months ended
(In thousands) December 31, December 31,
2019 2018 2019 2018
Net loss, as reported $ (4,907) $ (3,450) $ (14,948) $ (12,704)
Interest expense 1,289 202 3,853 506
Provision for income taxes — — 8 5
Depreciation and amortization 408 388 1,223 957
EBITDA (3,210) (2,860) (9,864) (8,378)
Stock-based compensation 303 292 669 743
Restructuring charges 257 300 925 1,072
Adjusted EBITDA $ (2,650) $ (2,268) $ (8,268) $ (9,421)
To supplement the Company’s unaudited financial data presented on a generally accepted accounting principles (GAAP) basis, management has used EBITDA and Adjusted
EBITDA, non-GAAP measures. These non-GAAP measures are among the indicators management uses as a basis for evaluating the Company’s financial performance as well as
for forecasting future periods. Management establishes performance targets, annual budgets and makes operating decisions based in part upon these metrics. Accordingly,
disclosure of these non-GAAP measures provides investors with the same information that management uses to understand the Company’s economic performance year-over-
year. The presentation of this additional information is not meant to be considered in isolation or as a substitute for net income or other measures prepared in accordance with
GAAP.
EBITDA is defined as net income before interest, provision for income taxes, depreciation and amortization expense. Adjusted EBITDA is defined as EBITDA before stock-based
compensation expense, restructuring charges, leadership incentive program, the change in warrant valuation and warrant issuance expenses. Restructuring charges includes
facility consolidation costs and one-time costs related to the company’s cost reduction initiatives. EBITDA and Adjusted EBITDA are not measures of the company’s liquidity or
financial performance under GAAP and should not be considered as an alternative to net income or any other performance measure derived in accordance with GAAP, or as an
alternative to cash flows from operating activities as a measure of its liquidity.
While management believes that the non-GAAP financial measures provide useful supplemental information to investors, there are limitations associated with the use of these
measures. The measures are not prepared in accordance with GAAP and may not be directly comparable to similarly titled measures of other companies due to potential
differences in the exact method of calculation. Management compensates for these limitations by relying primarily on the company’s GAAP results and by using EBITDA and
Adjusted EBITDA only supplementally and by reviewing the reconciliations of the non-GAAP financial measures to their most comparable GAAP financial measures.
Non-GAAP financial measures are not in accordance with, or an alternative for, generally accepted accounting principles in the United States. The Company’s non-GAAP financial
measures are not meant to be considered in isolation or as a substitute for comparable GAAP financial measures, and should be read only in conjunction with the Company’s
consolidated financial statements prepared in accordance with GAAP.
34For more information on please visit www.capstoneturbine.com
Follow Capstone twitter.com/CapstoneTurbine Follow Darren Jamison, CEO twitter.com/darren_jamison
Follow Capstone @capstoneturbine Follow Darren Jamison, CEO @darrenjamison_cpst
Follow Capstone linkedin.com/company/34302/ Follow Capstone youtube.com/CapstoneTurbine
CAPFebruary2020FL 16640 Stagg Street, Van Nuys, CA 91406 USA - Tel: 818.734.5300, Toll Free: 866.422.7786 Nasdaq: CPSTYou can also read