Application of a MOGA Algorithm and ANN in the Optimization of Apple Drying and Rehydration Processes
←
→
Page content transcription
If your browser does not render page correctly, please read the page content below
processes
Article
Application of a MOGA Algorithm and ANN in the
Optimization of Apple Drying and Rehydration Processes
Radosław Winiczenko, Agnieszka Kaleta and Krzysztof Górnicki *

                                          Institute of Mechanical Engineering, Warsaw University of Life Sciences—SGGW, 164 Nowoursynowska Str.,
                                          02-787 Warsaw, Poland; radoslaw_winiczenko@sggw.edu.pl (R.W.); agnieszka_kaleta@sggw.edu.pl (A.K.)
                                          * Correspondence: krzysztof_gornicki@sggw.edu.pl

                                          Abstract: The aim of the study was to estimate the optimal parameters of apple drying and the
                                          rehydration temperature of the obtained dried apple. Conducting both processes under such con-
                                          ditions is aimed at restoring the rehydrated apple to the raw material properties. The obtained
                                          drying parameters allow the drying process to be carried out in a short drying time (DT) and at
                                          low energy consumption (EC). The effect of air velocity (vd ), drying temperature (Td ), characteristic
                                          dimension (CD), and rehydration temperature (Tr ) on rehydrated apple quality was studied. Quality
                                          parameters of the rehydrated apple as: color change (CC), mass gain ratio (MG), solid loss ratio
                                          (SL), volume gain ratio (VG) together with DT and EC were taken into consideration. The artificial
                                          neural network was used for modeling of rehydrated apple quality parameters, DT, and EC. A
                                          multi-objective genetic algorithm was developed in order to optimize parameters of the drying and
                                          rehydration processes. The simultaneous minimization of CC, SL, DT, EC, and the maximization
                                          of MG and VG were considered with the following drying and rehydration processes parameters:
                                Td : 50–70 ◦ C, vd : 0.01–2 m/s, Tr : 20–70 ◦ C. The best solution has been found at drying temperature

                                          56.1 ◦ C, air velocity 1.3 m/s, characteristic dimension 2.0 mm, and rehydration temperature 59.2 ◦ C.
Citation: Winiczenko, R.; Kaleta, A.;
                                          This apple drying and rehydration resulted in MG = 3.51, SL = 0.57, VG = 4.77, CC = 11.2, DT = 5.4 h,
Górnicki, K. Application of a MOGA
                                          EC = 159.8 GJ/kg. The parameters of apple drying and rehydration processes can be recommended
Algorithm and ANN in the
                                          for the industry application.
Optimization of Apple Drying and
Rehydration Processes. Processes 2021,
                                          Keywords: apple; artificial neural network; drying; genetic algorithm; optimization; rehydration
9, 1415. https://doi.org/10.3390/
pr9081415

Academic Editor: Dariusz Dziki
                                          1. Introduction
Received: 12 July 2021                         Apples are one of the basic horticultural products and apple plantations are present
Accepted: 12 August 2021                  all over the world. Poland is a significant global producer of these fruits. Apples are
Published: 16 August 2021                 low caloric fruits and play a significant role in the human diet. They typically contain
                                          about 86% of H2 O, 12–14% of carbohydrate, 0.3% of protein, 0.2% of lipids, 2% of dietary
Publisher’s Note: MDPI stays neutral      fiber and many very important minerals (Ca, Mg, K). Apples may help in reducing the
with regard to jurisdictional claims in   effect of asthma and cholesterol levels [1–3]. Dried apples (instead of fresh) may be used
published maps and institutional affil-
                                          in many processed or ready-to-eat foods due to advantages such as the convenience of
iations.
                                          transportation, storage, preparation, and use. Dehydrated apples sometimes are rehydrated
                                          before consumption or further processing.
                                               Drying is one of the most common and important unit operation applied in such
                                          industrial sectors producing solid products as food, pharmaceutical, and chemical. Drying
Copyright: © 2021 by the authors.         generally is defined as removing of fluid or moisture from wet body by changing the
Licensee MDPI, Basel, Switzerland.        moisture into a gaseous phase [4,5]. Drying belongs to the processes that need high energy
This article is an open access article    because of the high value of the latent heat of water evaporation and low energy efficiency
distributed under the terms and
                                          of dryers. Moreover, the energy consumption and drying efficiency depend highly on the
conditions of the Creative Commons
                                          drying methods and the materials being dried [6]. The dryers consume approximately
Attribution (CC BY) license (https://
                                          12% of the energy employed in manufacturing processes, whereas on average about 10%
creativecommons.org/licenses/by/
                                          of the energy used in the food industry is allocated to the drying process [4,7,8]. About
4.0/).

Processes 2021, 9, 1415. https://doi.org/10.3390/pr9081415                                              https://www.mdpi.com/journal/processes
Processes 2021, 9, 1415                                                                                             2 of 14

                          50–70% of energy employed in wood process is used for drying [9]. It is stated that in such
                          manufacturing processes where material dehydration is needed, the drying cost amounts
                          to 60–70% of the total cost [4]. Therefore, increasing efficiency of drying systems for good
                          quality of dried products has been an important research area of the drying industry.
                                Many papers related to the drying of apple cubes have been found in the literature.
                          Dependence of temperature, relative humidity, velocity, and material size of thin-layer
                          apple (var. Idared) cubes on their drying kinetics [10] as well as the effects of the dry-
                          ing variables on the quality characteristics such as shrinkage and color of dried apple
                          were evaluated [11]. The kinetics of apple cubes drying with the convective method was
                          described by Figiel [12]. According to the author, apple cubes dried with the combined
                          method demonstrated better rehydrating properties manifested by absorption capacity,
                          dry-mater-holding capacity, and rehydration ability as compared to the apples dried only
                          with the use of the convective method.
                                Many methods of drying apples such as using heat pump, vacuum-microwave, or
                          intermittent techniques can be used in commercial scale for modification of the texture
                          attributes according to potential consumer preferences. However, heat pump vacuum-
                          microwave method is the best drying technique to produce crispy and healthy apple
                          snack with nice appearance, as reported by [13]. Pasławska et al. [14] investigated the
                          possibility of using the vacuum impregnation as a pre-treatment before drying apple cubes.
                          Apple cubes were dried by convective drying and microwave-vacuum drying. The above
                          drying methods allow to obtain the dried apples characterized by the reduced compressive
                          resistance, increased resistance to cutting, and less elasticity in relation to the raw material.
                          Diamante and Yamaguchi [15] investigated the effects of temperature, air velocity, and
                          loading density on the drying of infused apple. They optimized drying temperature, air
                          velocities, and loading densities, and drying times for hot air drying using response surface
                          method. Assis et al. [16] studied the effects of the osmotic pre-treatment with sucrose or
                          sorbitol solutions and different drying methods on the rehydration kinetics of apple cubes.
                          Samples were dried by hot air at 70 ◦ C, by microwave at 500 W, and by freeze-drying. The
                          rehydration rate and the rehydration capacity of the apple cubes dried by these methods
                          were not affected by the solute used in the pre-treatment with sucrose and sorbitol. Product
                          quality is becoming very important in the storage and drying processes [17,18]. The wide
                          variety of dried products and the interesting concern for meeting energy conservation and
                          product quality emphasize the necessity of dehydration optimization [19]. The rehydration
                          capability is one of the quality attributes of some food materials whereas some dried
                          products must be rehydrated before further processing or consumption [20].
                                Rehydration is a complicated process that indicated the degree of physical and chemi-
                          cal changes occurring during processing (treatments preceding drying, dehydration, and
                          rehydration) [21,22]. It can be accepted that rehydration indicates the degree of structural
                          and cellular damage caused to the product [23,24]. Rehydration can be described as a
                          process of moistening dry material, mainly using water. Three simultaneous processes
                          occur during rehydration, namely: the imbibition of moisture into dehydrated product,
                          the swelling, and the leaching of solubles (sugars, acids, minerals, and vitamins) [21,25].
                          Generally speaking, rehydration is a complex mass-transfer process that consists of several
                          physical mechanisms, including absorption of water, internal diffusion, convection inside
                          the large open pores and at the surface of product, and relaxation of solid structure [26].
                                Conventional optimization algorithms using linear and non-linear programming
                          sometimes have difficulty in finding the global optima or in case of multi-objective op-
                          timization, the Pareto front. A lot of research has now been directed toward genetic
                          algorithms (GAs) to solve multi-objective optimization problems. Genetic algorithms are a
                          biologically inspired highly parallel mathematical search algorithm pioneered by Holland.
                          GAs generate entire population of points, each with associated fitness value, tests each
                          point independently, and combines qualities from existing points to form a new population,
                          containing improved points [27]. They compute the fitness value using the information
                          concerning the quality of the solution produced by the members of the population (ob-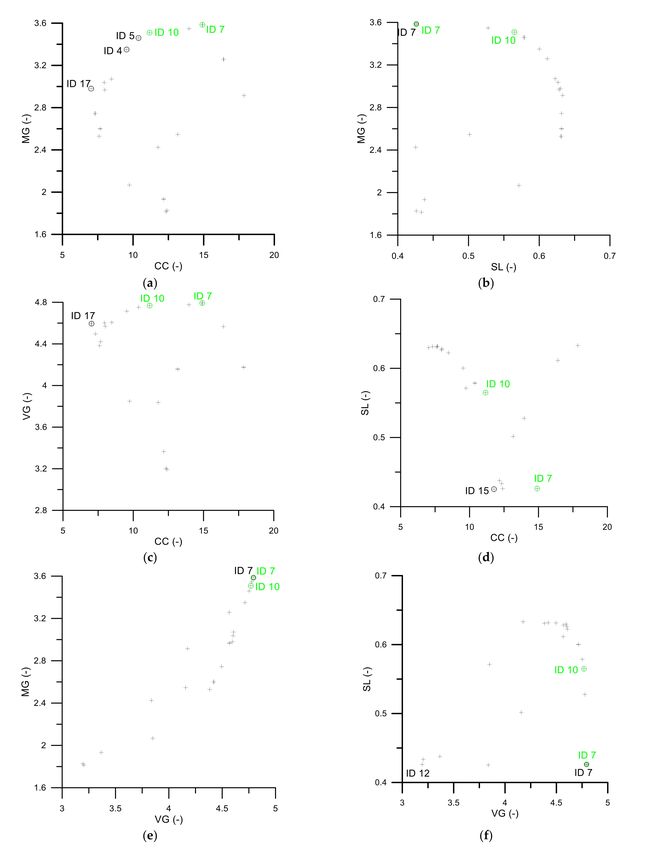
Processes 2021, 9, 1415                                                                                            3 of 14

                          jective function values) [28]. This adaptive evolutionary learning process relates to the
                          evolutionary selection procedure of genetic chromosomes. Genetic Algorithms rely on
                          the Darwinian principle of reproduction and survival of the fittest and natural genetic
                          operations like mutation [29,30]. Multi-objective genetic algorithm (MOGA) optimization
                          involves minimizing or maximizing multiple objective functions subject to a set of con-
                          straints. The basic steps of the multi-objective genetic algorithm were described in detail
                          by authors [31].
                                In literature the multi-objective optimization of apple drying was done [31,32]. The
                          simultaneous minimization of color difference, maximization of the volume ratio, and water
                          absorption capacity was successfully applied. Authors found optimal solution: drying
                          air velocity and temperature [31]. The simultaneous minimization of color difference and
                          volume ratio and the maximization of water absorption capacity were considered. The
                          optimal solution: drying air temperature, air velocity, rehydration temperature and kind of
                          rehydrating medium were conducted in [32].
                                Determining the optimal parameters of drying is important for solving the problems
                          of product quality and optimizing the quantity of energy consumed during dehydration.
                          However, to our knowledge, there are fewer or no items in the literature about this problem.
                          Darvishi et al. [33] conducted the optimization of dehydration process of sawory leaves,
                          taking into consideration criteria such as: drying variables (drying air temperature, drying
                          air velocity, infrared power density), minimum drying time, energy consumption, color
                          change, and maximum rehydration and moisture extraction ratios. There are no informa-
                          tion in the literature about optimization of the quantity of energy consumed during apple
                          dehydration.
                                The study aims to estimate the optimal parameters of apple drying and the rehydration
                          temperature. Conducting both processes under such conditions ensures the restoration of
                          the raw material properties of rehydrated apples. The obtained parameters allow the drying
                          process to be carried out in a short drying time (DT) and at low energy consumption (EC).

                          2. Materials and Methods
                          2.1. Materials
                               Apples var. Ligol, bought from Warsaw market (Poland), were used for conducting
                          the experiments. The initial moisture content of the apples was approximately 5.7 kg
                          water/kg dry mass (0.85 kg water/kg wet mass). They were washed, peeled, and cut into
                          slices (3 ± 1 and 10 ± 1 mm thickness) or cubes (10 ± 1 mm thickness).
                               The characteristic dimension (CD) of apples was calculated as [34]:
                          •    For slices CD = s;
                                           1      3
                          •    For cubes CD  2 = s2 ;

                               where s (mm) is the half of the slice thickness and cube thickness, respectively.

                          2.2. Drying
                               The apple samples were dried using forced convection in a laboratory dryer con-
                          structed in the Institute of Mechanical Engineering, Warsaw University of Life Sciences,
                          Warsaw, Poland. The dryer consisted of an airflow control unit, an electrical fan, a heating
                          and heating control unit, the drying chamber, and a measurement sensor. The airflow
                          control unit regulated the velocity of the drying air flowing through the drying chamber.
                          The desired air temperature was obtained by electrical resistance heating and controlled by
                          the heating control unit. The drying air velocity and temperature were measured directly
                          in the drying chamber. The samples were placed on a stainless steel wire tray of known
                          weight. The weighing of samples was done manually outside the chamber. Prior to placing
                          the apples in the dryer, the system was run for at least one hour to obtain stable conditions.
                               The drying air velocity (vd ) amounted to 0.5 m/s and 2.0 m/s. The drying air tem-
                          peratures were following (Td ): 50, 60, and 70 ◦ C. The final moisture content of the dried
                          apples was approximately 0.1 kg water/kg dry mass (0.09 kg water/kg wet mass). The
                          dehydration processes were conducted, in given conditions, in triplicate. The drying time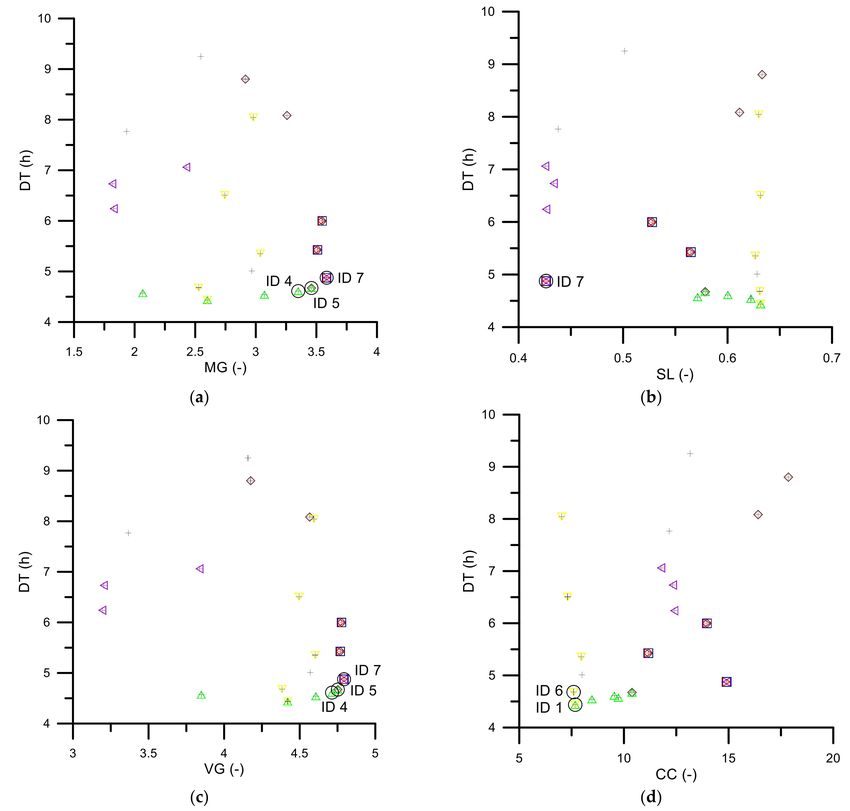
Processes 2021, 9, 1415                                                                                            4 of 14

                          (DT) was measured using a stopwatch (1 s accuracy). The dried material (given drying
                          conditions) was mixed and next stored in a container (no exposure to sunlight) for a week
                          at the temperature amounted to 20 ◦ C.

                          2.3. Rehydration
                               The process of dried apple rehydration was conducted in distilled water at following
                          temperatures (Tr ): 20, 45, and 70 ◦ C. The experiments lasted from 3 (Tr = 70 ◦ C) to 6 h
                          (Tr = 20 ◦ C) and was carried out in triplicate. The initial mass of the sample (dried apples)
                          showing rehydration was approximately 10 g. The dried apples mass (at beginning of the
                          process) to the mass of distilled water ratio amounted to 1:20. The water temperature was
                          constant, and it was not stirred during rehydration.

                          2.4. Mass and Volume
                                The mass of the sample (m) (dried and rehydrated apple, dry matter) was measured us-
                          ing an electronic scale WPE 300 (RADWAG, Radom, Poland; ±0.001 g accuracy). The apple
                          dry matter was determined before and after rehydration according to AOAC standards [30].
                          The mentioned measurements were conducted in three replicates. The maximum relative
                          error in the determination of the mass amounted to 0.1%.
                                The volume of the sample (V) (dried and rehydrated apple) was measured using the
                          buoyancy method in petroleum benzine [31]. The volume measurement was conducted
                          in triplicate. The maximum relative error in the determination of the volume amounted
                          to 5%.

                          2.5. Color
                               The scanner (CanoScan 5600F, Canon Inc., Tokyo, Japan, 4800 × 9600 dpi) was used to
                          the color determination of fresh and rehydrated apple samples. The images were loaded
                          into the sRGB color space, and then the mean brightness of pixels in each RGB channel
                          of the image was taken to express color parameters. The mean RGB values were linearly
                          transformed to CIE XYZ color space and then nonlinearly converted to CIELab coordinates.
                          The values of reference for the color parameters XYZ, at the standard observer of 10◦ and
                          illuminant D50, were 96.72, 100, 81.43, respectively [35]. According to [36], the Chroma (C)
                          and the hue angle (h) specific for CIELCh color space were defined. Details of the color
                          measurement can be found in [31].

                          2.6. Energy Consumption EC
                               The energy consumed during dehydration per kg of dried apples (EC) is defined
                          as [37–39]:
                                                               EQ + EW
                                                          EC =                                            (1)
                                                                   md
                          where: EQ (GJ) is the energy needed for heating the drying air, EW (GJ) is the energy
                          needed to drive the drying air through the dryer, and md (kg) is the mass of the obtained
                          dried apples,
                                                              EQ = AvρC∆Tτ                                       (2)
                                                                  EW = ∆PvAτ                                          (3)
                          where: A (m2 ) is the cross-section area, v (m/s) is the air velocity, ρ (kg/m3 ) is the air
                          density, C (GJ/(kg K)) is the air specific heat, ∆T (K) is the temperature difference, τ (s) is
                          the drying time, and ∆P (GPa) is the pressure drop.

                          2.7. Quality Parameters QP
                               The color change (CC), mass gain ratio (MG), solid loss ratio (SL), and volume gain
                          ratio (VG) were applied for the quality determination of rehydrated apple samples. The
                          quality parameters (QP) are defined in Table 1.
Processes 2021, 9, 1415                                                                                                             5 of 14

                          Table 1. Equations for quality parameters calculating of rehydrated apple.

                                                     Parameters                                           Equation No.
                                          r         2       2        2
                                                ∆L
                                   CC =        KL SL   + K∆C S
                                                           C C
                                                                 +  K
                                                                     ∆H
                                                                       S
                                                                      H H
                                                                                                                 (4)

                                                  MG = mrm−dmd                                                   (5)
                                                            −mdm r
                                                 SL = mdmmd dm  r
                                                                                                                 (6)
                                                            Vr                                                   (7)
                                                    VG = V    d
                          where: SL , SC , SH —the weight functions (adjusting internal non-uniform structure of CIELab (SL = 1,
                          SC = 1 + 0.045C, SH = 1 + 0.015C), KL , KC , KH —the variation from the reference conditions, ∆L, ∆C, ∆H—the
                          difference between tested (T ) and standard (S ) samples in luminance (L), chroma (C), and hue (H) (∆L = L T − LS

                          ∆C = CT − CS , ∆H = 2 CT · CS · sin ∆h                                       3
                                                  p
                                                                   2 ), m—mass (kg), V—volume (m ), subscripts d, dm, and r refer to dry,
                          dry matter, and rehydrated, respectively.

                          2.8. QP, DT, and EC Modeling Using the Artificial Neural Network
                               Artificial neural networks (ANN) comprise of autonomous processing elements (neu-
                          rons) with associated weights and activation functions. These neurons are simplified
                          computational models based on our understanding of biological neurons. The weights
                          represent the relationship between the neurons [40]. Various architectures including feed
                          forward neural networks with associated learning schemes such as back-propagation have
                          been proposed using networks of these neurons. Variants include recurrent networks and
                          radial basis function networks. The learning schemes provide a means of modifying the
                          weights [41]. Stone-Weierstrass and Kolmogorov theorems prove that feed forward neural
                          networks can approximate continuous functions to the desired degree of accuracy [42].
                          Moreover, the ANN can be used to learn non-linear relationships in a given data set.
                               The artificial neural network was used to QP, DT, and EC modeling. The ANN task
                          was to map input variables: Td , v, CD, and Tr (parameters of the drying and rehydration
                          processes) on to six output variables: CC, MG, SL, VG (quality parameters), DT and EC
                          to obtain the lowest mean squared error (MSE) and high: correlation coefficient (R) and
                          adjusted R-square.
                               Values of input and output parameters were normalized in the range from 0 to 1
                          (division by using their maximum values: 70, 2, 5.8, 70, 42.02, 3.6, 0.67, 4.8, 9.25, 397 for Td ,
                          v, CD, Tr , CC, MG, SL, VG, DT (in h) and EC (in GJ/kg), respectively). Data cases have
                          been randomly divided into training (70%), testing (15%), and validation (15%) sample
                          sets. A feed forward neural network with a backpropagation algorithm was employed.
                          The MATLAB Neural Networks Toolbox R2018a software with Lavenberg-Marquardt
                          algorithm for training was used.

                          2.9. Optimization Problem
                               A genetic algorithm (GA) was chosen to optimize the process parameters. GA is a
                          powerful optimization tool especially in irregular experimental regions. In the process
                          of drying and rehydration, complex and highly nonlinear phenomena take place [43].
                          Therefore, it is easy to estimate relationships between the input and the output of this
                          complex system using ANN and GA techniques. The main characteristic of GA over
                          the other optimization techniques is that they operate simultaneously with a huge set of
                          searching points to find optimal architecture instead of a single point [28]. GA performs
                          better than response surface methodology (RSM) when a large number of experiments
                          are affordable.
                               The multi-objective optimization (MOO) task was aimed to define the set of optimal
                          conditions of the dehydration and rehydration processes. The following functions: CC,
                          DT, EC, and SL were minimized whereas MG and VG ones were maximized according to
Processes 2021, 9, 1415 6 of 14
constraints on the drying (Td , v, CD) and rehydration (Tr ) parameters. The Equation (8)
presents the mentioned problem.
min CC( Td , vd , CD, Tr )
min DT( Td , vd , CD, Tr )
min EC( Td , vd , CD, Tr )
min SL( Td , vd , CD, Tr )
max MG( Td , vd , CD, Tr )
min( x ) = (8)
max VG( Td , vd , CD, Tr )
50 ◦ C ≤ Td ≤ 70 ◦ C
0.5 m/s ≤ vd ≤ 2.0 m/s
1.5 mm ≤ CD ≤ 5.78 mm
20 ◦ C ≤ Tr ≤ 70 ◦ C
The Pareto front for the MOO has been formulated applying nondominated sorting ge-
netic algorithm (NSGA II), implemented in MATLAB Global Optimization Toolbox R2018a.
The mentioned algorithm was discussed in [25], whereas NSGA II parameters are following:
the crossover function—intermediate, the crossover rate—85%, the migration—forward, the
mutation function—uniform, the mutation rate—15%, the number of generations—300 num-
ber of variables, the Pareto front population fraction—0.8, the size of the population—20
number of variables, the selection function—Tournament size = 2.
3. Results and Discussion
3.1. ANN
Different ANN structures (various transfer functions) for the approximation of the
relationship between the variables of dehydration and rehydration (Td , v, CD, and Tr ) and
apple quality parameters QP (CC, MG, SL, VG), drying time DT, and energy consumption
EC were tested (Table 2).
Table 2. ANN architectures tested.
Activate Function Number of Neurons in Activate Function Statistical Analysis
ID. in the Hidden Layer the Hidden Layer in the Output Layer MSE R Adjusted R-Square
1 4 0.002020 0.9914 0.9820
2 6 log-sigmoid 0.000309 0.9914 0.9820
3 log-sigmoid 8 0.001207 0.0990 0.0430
4 4 0.001664 0.9886 0.9761
5 6 pureline 0.000825 0.9917 0.9826
6 8 0.001983 0.9944 0.9883
7 4 0.003444 0.9853 0.9693
8 6 pureline 0.000970 0.9931 0.9855
9 tansig 8 0.000952 0.9950 0.9895
10 4 0.003110 0.9706 0.9390
11 6 log-sigmoid 0.004624 0.9743 0.9466
12 8 0.000520 0.9953 0.9901
On account of high adjusted R-square (0.9820), R-value (0.9914), and low MSE (0.0003),
the ANN with four neurons in the input layer (Td , v, CD, and Tr ), six neurons in the hidden
layer, and six neurons in the output layer (CC, MG, SL, VG, DT and EC) with log-sigmoid
transfer function for hidden and output layers was developed (ID 2 in Table 2). The best
validation performance was after 114 iterations (Figure 1a). The values of Adjusted R-
square and R were high enough, namely: 0.9841 and 0.9926 for training data, 0.9579 and
0.9865 for validation ones, 0.9685 and 0.9899 for test data, respectively (Figure 1b).Processes 2021, 9, 1415 7 of 14
Figure 1. The best performance of the ANN (a) and the ANN fit goodness (b).
3.2. MOGA
Table 3 shows 19 design points of the Pareto optimal set. Figures 2–4 presents the
non-dominated points of Pareto front.
Table 3. Pareto optimal sets.
Inputs Outputs
ID
Td (◦ C) vd (m/s) CD (mm) Tr (◦ C) MG (-) SL (-) VG (-) CC (-) DT (h) EC (GJ/kg)
1 62.44 1.2594 3.5581 56.41 2.60 0.63 4.42 7.67 4.44 283.84
2 66.99 1.6903 3.1241 37.41 3.07 0.62 4.61 8.47 4.54 294.00
3 60.48 1.2513 4.2814 47.66 2.07 0.57 3.85 9.74 4.57 396.82
4 66.64 1.4174 2.8837 50.61 3.35 0.60 4.71 9.54 4.61 248.83
5 64.98 1.2986 2.6938 56.03 3.46 0.58 4.75 10.39 4.67 216.07
6 60.28 1.3288 3.5348 44.76 2.53 0.63 4.38 7.60 4.68 308.62
7 62.11 1.6584 2.0158 47.86 3.59 0.43 4.79 14.91 4.88 342.51
8 55.33 1.7493 2.5717 42.51 2.97 0.63 4.57 8.00 5.10 281.57
9 55.75 1.5048 2.6483 57.37 3.04 0.63 4.60 7.96 5.36 262.38
10 56.10 1.2456 1.9942 59.16 3.51 0.57 4.77 11.16 5.43 159.80
11 53.83 1.5361 1.5146 48.42 3.55 0.53 4.78 13.96 6.00 235.15
12 63.85 1.3485 5.7152 55.26 1.83 0.43 3.19 12.40 6.24 396.98
13 60.81 0.7190 3.3839 45.81 2.74 0.63 4.50 7.31 6.51 261.63
14 64.24 1.2258 5.6621 51.41 1.82 0.43 3.20 12.33 6.73 396.98
15 58.02 1.8172 5.1563 46.69 2.43 0.43 3.84 11.77 7.06 396.98
16 64.45 1.1341 5.6831 47.77 1.93 0.44 3.37 12.17 7.77 396.98
17 59.07 0.6460 3.2791 54.20 2.98 0.63 4.60 7.03 8.04 235.70
18 55.53 1.1483 1.5125 31.98 3.26 0.61 4.57 16.41 8.08 145.40
19 53.81 0.9368 1.5520 41.26 2.91 0.63 4.18 17.86 8.80 138.71Processes 2021, 9, 1415 8 of 14
Figure 2. Pareto fronts: (a) EC-MG, (b) EC-SL, (c) EC-VG, (d) EC-CC, (e) EC-DT; +—data, O—the best solutions, —ECmin ,
—MGmax , —DTmin , —CCmin , —VGmax -, —SLmin .Processes 2021, 9, 1415 9 of 14
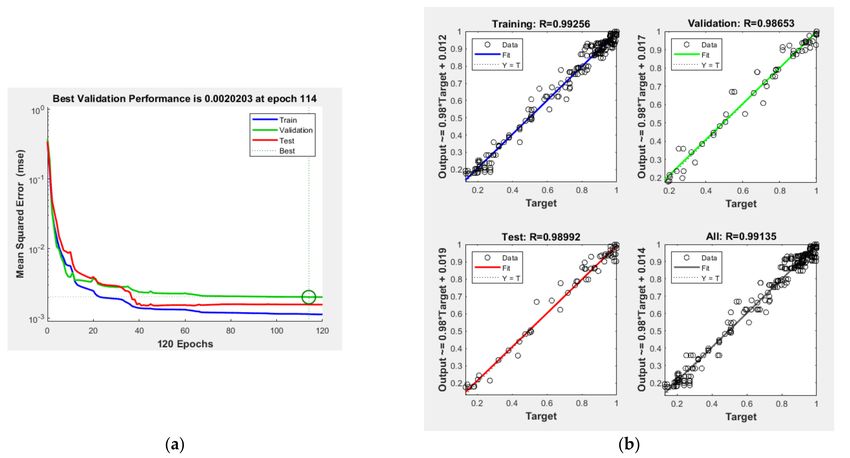
Figure 3. Pareto fronts: (a) DT-MG, (b) DT-SL, (c) DT-VG, (d) DT-CC; +—data, O—the best solutions, —ECmin , —MGmax ,
—DTmin , —CCmin , —VGmax -, —SLmin .Processes 2021, 9, 1415 10 of 14
Figure 4. Pareto fronts: (a) MG-CC, (b) MG-SL, (c) VG-CC, (d) SL-CC, (e) MG-VG, (f) SL-VG; +—data, O—the best solutions,
O—ID 7 and ID 10.Processes 2021, 9, 1415 11 of 14
ID10 (Figure 2) was the best solution for the faced optimization task (Equation (8)). It
is important to obtain, with possibly low energy consumption, a rehydrated product with
acceptable quality parameters from the dried material acquired by drying in a short time.
The solution features the following drying and rehydration parameters: Td = 56.1 ◦ C,
vd = 1.25 m/s, CD = 2.0 mm, and Tr = 59.2 ◦ C. The rehydrated product obtained in such
conditions shows CC = 11.2, DT = 5.4 h, MG = 3.51, SL = 0.57, VG = 4.77, EC = 159.8 GJ/kg
(CC 37.0% higher than CCmin , DT 18.2% higher than DTmin , MG 2.1% lower than MGmax ,
SL 24.7% higher than SLmin , VG 0.5% lower than VGmin , and EC 13.2% higher than ECmin ).
However, for the EC-SL relation (Figure 2b), we can notice that solution ID11 indicates
lower SL values (compared to ID 10) but with a higher EC. Solution ID 11 indicates the
following drying and rehydration parameters: Td = 53.8 ◦ C, vd = 1.54 m/s, CD = 1.5 mm,
and Tr = 48.4 ◦ C, and the obtained rehydrated product shows CC = 13.96, DT = 6.0 h,
MG = 3.55, SL = 0.53, VG = 4.78, EC = 235.2 GJ/kg (CC 49.60% and 20.0% higher, DT
26.8% and 9.5% higher, MG 1.0% lower and 1.1% higher, SL 19.4% higher and 7.0% lower,
VG 0.3% lower and 0.2% higher, and EC 41.0% and 32.1% higher than the minimum or
maximum values, respectively, and the value for ID10). For relations EC-CC (Figure 2d)
and EC-DT (Figure 2e), we may also accept solution ID5 to be an optimum solution that
indicates Td = 65.0 ◦ C, vd = 1.30 m/s, CD = 2.7 mm, and Tr = 56.0 ◦ C. The rehydrated
product obtained in such conditions shows CC = 10.39, DT = 4.67 h, MG = 3.46, SL = 0.58,
VG = 4.75, EC = 216.1 GJ/kg (CC 32.3% higher and 7.5% lower, DT 5.1% higher and 16.2%
lower, MG 3.5% and 1.4% lower, SL 26.5% and 2.4% higher, VG 0.8% and 0.3% lower, and
EC 35.8% and 26.0% higher than the minimum or maximum values, respectively, and
the value for ID10). Additionally, for the ED-CC relation, solution ID 17 (Td = 59.1 ◦ C,
vd = 0.65 m/s, CD = 3.3 mm, and Tr = 54.2 ◦ C) shows a lower CC (7.0) with just a slightly
higher EC (compared to ID 5) being 235.7 GJ/kg. For ID17, the CC is the lowest of all
values and 58.8% lower than the CC value obtained for ID 10. The comparison of the values
obtained for ID 17 to the minimum or maximum values, respectively, and the value for
ID 10 is as follows: DT 44.8% and 32.5% higher, MG 16.9% and 15.1% lower, SL 32.5% and
10.3% higher, VG 4.1% and 3.7% lower, and EC 41.2% and 32.2% higher.
ID7 (Figure 3) is the best solution for the faced optimization task (Equation (8)), where
it is important to obtain, with possibly short drying time, a rehydrated product with
acceptable quality parameters and acceptable consumption of energy used for drying
(however, this solution is not optimal for CC). The solution features the following drying
and rehydration parameters: Td = 62 ◦ C, v = 1.66 m/s, CD = 2.0 mm, and Tr = 47.9 ◦ C. The
rehydrated product obtained in such conditions shows CC = 14.9, DT = 4.9 h, MG = 3.59,
SL = 043, VG = 4.79, EC = 342.5 GJ/kg (CC 52.8% higher than CCmin , DT 9.0% higher than
DTmin , MG = MGmax , SL 0.2% higher than SLmin , VG = VGmin , but EC as much as 59.5%
higher than ECmin ).
Given the charts for DT-MG (Figure 3a) and DT-VG (Figure 3c), we can conclude that
the optimum solutions also include ID4 and ID5 (Td = 66.6 ◦ C, v = 1.42 m/s, CD = 2.9 mm,
Tr = 50.6 ◦ C, and Td = 65.0 ◦ C, v = 1.30 m/s, CD = 2.7 mm, Tr = 56.0 ◦ C, respectively), but
with ECID4 > ECID5 . When drying with the indicated parameters, we quickly (4.6 h and
4.7 h, respectively) obtain dried material, which then, in the rehydration process, intensively
increases both its weight and volume (MG: 3.4 and 3.5; VG: 4.7 and 4.8, respectively).
However, energy consumption is high (ECID4 = 248.8 GJ/kg; ECID5 = 216.1 GJ/kg), being
44.3% and 35.8% higher, respectively, compared to ECmin .
Nevertheless, if we consider the chart for DT-CC (Figure 3d), then solutions ID1 and
ID6 show such drying and rehydration parameters where the color of the rehydrated
product indicates the slightest change compared to the product taken for drying. Solution
ID 1 indicates the following drying and rehydration parameters: Td = 62.4 ◦ C, vd = 1.26 m/s,
CD = 3.6 mm, and Tr = 56.4 ◦ C, and the rehydrated product obtained in such conditions
shows CC = 7.67, DT = 4.4 h, MG = 2.6, SL = 0.63, VG = 4.42, EC = 283.8 GJ/kg (CC
9.1% higher, DT = DTmin , MG 27.5% lower, SL 48.5% higher, VG 7.8% lower, and EC
104.6% higher than the minimum or maximum values, respectively). Solution ID6 (which,Processes 2021, 9, 1415 12 of 14
when compared to ID1, shows a CC 1% lower with a DT being 5.5% higher) indicates the
following drying and rehydration parameters: Td = 60.3 ◦ C, vd = 1.33 m/s, CD = 3.5 mm,
and Tr = 44.8 ◦ C, and the rehydrated product obtained in such conditions shows CC = 7.60,
DT = 4.7 h, MG = 2.5, SL = 0.63, VG = 4.38, EC = 308.6 GJ/kg (CC 8.1% higher, DT 5.5%
higher, MG 29.5% lower, SL 48.3% higher, VG 8.6% lower, and EC 122.5% higher than the
minimum or maximum values, respectively).
Considering only the quality parameters of rehydrated apples it could be stated that
for the optimization problem expressed using Equation (8), ID 7 and ID 10 are the best
solution (Figure 4). However, when comparing the energy consumption for both cases
(ECID 7 = 342.5 GJ/kg, ECID 10 = 159.8 GJ/kg), solution ID 10 should be recommended.
Experimental verification proved that maximum error of modeling was lower than 4.86%.
In the previous research about multi-objective normalization of apple drying [31] and
drying and rehydration [32] the critical factors—drying time and energy consumption for
drying were not considered. Taking these factors into account is very important from the
point of view of material acquisition costs. The material should be of the best quality with
the lowest possible expenditure for its processing.
The new experimental run (Td = 56 ◦ C, vd = 1.3 m/s, CD = 2.0 mm, and Tr = 59 ◦ C
was used to verify the developed model. The experimentally determined values (Table 4)
were very close to the predicted values under the same drying and rehydration conditions.
The maximum absolute error obtained in the validation process was 4.46%. It proved the
consistency and accuracy of the obtained model.
Table 4. Validation results.
Quality of Rehydrated Apples
Validation
MG SL VG CC DT EC
Experimental values (yei ) 3.48 0.59 4.68 11.7 5.3 162
Predicted values (y pi ) 3.51 0.57 4.77 11.2 5.4 159.8
y −y
Errors = eiy pi pi ·100% 0.85 3.5 1.88 4.46 1.85 1.38
4. Conclusions
The effect of drying (drying temperature Td : 50–70 ◦ C, air velocity vd : 0.5–1 m/s,
characteristic dimension CD: 1.5–5.78 mm) and rehydration (rehydration temperature
Tr : 20–70 ◦ C) parameters on the quality of rehydrated apples: color change (CC), mass gain
ratio (MG), solid loss ratio (SL), and volume gain ratio (VG) and on the drying time (DT)
and energy consumption (EC) required for drying of apple were investigated.
A multi-objective optimization algorithm, based on Pareto optimization, genetic
algorithm and artificial neural network, was developed. Optimization objectives for
simultaneous maximization, MG and VG, and for minimization, CC, SL, DT, EC, were
used, whereas the objective functions were determined by application of an artificial neural
network. The Pareto optimal set was formulated applying non-dominated sorting genetic
algorithm II.
The parameters of apple drying and rehydration processes, derived from optimization
of both processes, can be recommended for the industry application. Use of the following
parameters: Td = 56.1 ◦ C, vd = 1.3 m/s, CD = 2.0 mm, and Tr = 59.2 ◦ C results in 3.51 for MG,
0.57 for SL, 4.77 for VG, 11.2 for CC, 5.4 h for DT, and 159.8 GJ/kg for EC. Conducting both
processes under received conditions allowed to obtain rehydrated apple with properties
similar to the raw material properties with comparatively shorter drying time and lower
energy consumption for drying.
Author Contributions: R.W. data analysis, methodology, modeling, optimization; A.K. manuscript
writing, manuscript critical revision; K.G. research proposal topic, data analysis, visualization,
manuscript writing. All authors have read and agreed to the published version of the manuscript.
Funding: This research received no external funding.Processes 2021, 9, 1415 13 of 14
Institutional Review Board Statement: Not applicable.
Informed Consent Statement: Not applicable.
Data Availability Statement: Not applicable.
Conflicts of Interest: The authors declare no conflict of interest.
References
1. Bora, G.C.; Pathak, R.; Ahmadi, M.; Mistry, P. Image Processing Analysis to Track Colour Changes on Apple and Correlate to
Moisture Content in Drying Stages. Food Qual. Saf. 2018, 2, 105–110. [CrossRef]
2. Sinha, N.K. Apples. In Handbook of Fruits and Fruit Processing; Hui, Y.H., Ed.; Blackwell Publishing: Ames, IA, USA, 2006;
pp. 263–278. ISBN 978-0-470-27773-7.
3. Park, Y.; Chang, Y.-S.; Park, J.-H.; Yang, S.-Y.; Chung, H.; Jang, S.-K.; Choi, I.-G.; Yeo, H. Energy Efficiency of Fluidized Bed Drying
for Wood Particles. J. Korean Wood Sci. Technol. 2016, 44, 821–827. [CrossRef]
4. Syahrul, S.; Hamdullahpur, F.; Dincer, I. Exergy Analysis of Fluidized Bed Drying of Moist Particles. Exergy Int. J. 2002, 2, 87–98.
[CrossRef]
5. Midilli, A.; Kucuk, H. Energy and Exergy Analyses of Solar Drying Process of Pistachio. Energy 2003, 28, 539–556. [CrossRef]
6. Motevali, A.; Minaei, S.; Khoshtagaza, M.H. Evaluation of Energy Consumption in Different Drying Methods. Energy Convers.
Manag. 2011, 52, 1192–1199. [CrossRef]
7. Nazghelichi, T.; Aghbashlo, M.; Kianmehr, M.H. Optimization of an Artificial Neural Network Topology Using Coupled Response
Surface Methodology and Genetic Algorithm for Fluidized Bed Drying. Comput. Electron. Agric. 2011, 75, 84–91. [CrossRef]
8. Tremblay, C.; Zhou, D. A Study of Efficient Drying Parameters for Bed Dryers. In Proceedings of the 2nd International Conference
on Fluid Flow, Heat and Mass Transfer, Ottawa, ON, Canada, 30 April–1 May 2015; p. 179.
9. Chaudhari, A.R.; Kostha, V.; Upadhyay, J.B. Optimum Energy Requirement of Fluidized Bed Dryer for Drying of Khoa. Int. J.
Chem. Stud. 2018, 6, 40–44.
10. Zlatanović, I.; Komatina, M.; Antonijević, D. Low-temperature convective drying of apple cubes. Appl. Therm. Eng. 2013, 53,
114–123. [CrossRef]
11. Seiiedlou, S.; Ghasemzadeh, H.R.; Hamdami, N.; Talati, F.; Moghaddam, M. Convective Drying of Apple: Mathematical Modeling
and Determination of some Quality Parameters. Int. J. Agric. Biol. 2010, 12, 171–178.
12. Figiel, A. Dehydration of apples by a combination of convective and vacuum-microwave drying. Pol. J. Food Nutr. Sci. 2007, 57,
131–135.
13. Chong, C.H.; Figiel, A.; Law, C.L.; Wojdyło, A. Combined Drying of Apple Cubes by Using of Heat Pump, Vacuum-Microwave,
and Intermittent Techniques. Food Bioprocess Technol. 2014, 7, 975–989. [CrossRef]
14. Pasławska, M.; St˛epień, B.; Nawirska-Olszańska, A.; Maślankowski, R.; Rydzak, L. Effect of Vacuum Impregnation on Drying
Kinetics and Selected Quality Factors of Apple Cubes. Int. J. Food Eng. 2017, 13, 20160309. [CrossRef]
15. Diamante, L.M.; Yamaguchi, Y. Response surface methodology for optimisation of hot air drying of blackcurrant concentrate
infused apple cubes. Int. Food Res. J. 2012, 19, 353–362.
16. Assis, F.R.; Morais, R.M.S.C.; Morais, A.M.M.B. Rehydration of osmotically pre-treated apple cubes dried by hot air, microwave,
and freeze-drying. Acta Alim. 2018, 47, 315–323. [CrossRef]
17. Kraśniewska, K.; Ścibisz, I.; Gniewosz, M.; Mitek, M.; Pobiega, K.; Cendrowski, A. Effect of Pullulan Coating on Postharvest
Quality and Shelf-Life of Highbush Blueberry (Vaccinium Corymbosum L.). Materials 2017, 10, 965. [CrossRef]
18. Zhang, J.-W.; Liu, H.-H.; Yang, H.; Yang, L. Drying Characteristics of Eucalyptus Urophylla × E. Grandis with Supercritical CO2 .
Materials 2020, 13, 3989. [CrossRef] [PubMed]
19. Górnicki, K.; Kaleta, A. Drying Curve Modelling of Blanched Carrot Cubes under Natural Convection Condition. J. Food Eng.
2007, 82, 160–170. [CrossRef]
20. Nayak, C.A.; Suguna, K.; Rastogi, N.K. Combined Effect of Gamma-Irradiation and Osmotic Treatment on Mass Transfer during
Rehydration of Carrots. J. Food Eng. 2006, 74, 134–142. [CrossRef]
21. Lewicki, P.P. Some Remarks on Rehydration of Dried Foods. J. Food Eng. 1998, 36, 81–87. [CrossRef]
22. Funebo, T.; Ohlsson, T. Microwave-Assisted Air Dehydration of Apple and Mushroom. J. Food Eng. 1998, 38, 353–367. [CrossRef]
23. Sacilik, K.; Elicin, A.K. The Thin Layer Drying Characteristics of Organic Apple Slices. J. Food Eng. 2006, 73, 281–289. [CrossRef]
24. Krokida, M.K.; Philippopoulos, C. Rehydration of Dehydrated Foods. Dry. Technol. 2005, 23, 799–830. [CrossRef]
25. McMinn, W.A.M.; Magee, T.R.A. Quality and Physical Structure of a Dehydrated Starch-Based System. Dry. Technol. 1997, 15,
1961–1971. [CrossRef]
26. Mulet, A.; Cárcel, J.A.; Sanjuán, N.; Bon, J. New Food Drying Technologies—Use of Ultrasound. Food Sci. Technol. Int. 2003, 9,
215–221. [CrossRef]
27. Holland, J.H. Adaptation in Natural and Artificial Systems; University of Michigan Press: Ann Arbor, MI, USA, 1975.
28. Goldberg, D. Genetic Algorithms in Search, Optimization, and Machine Learning; Addison-Wesley: Boston, MA, USA, 1989.
29. Michalewicz, Z. Genetic Algorithms + Data Structures = Evolution Programs; Springer: Berlin, Germany, 1992.
30. Davis, L. Handbook of Genetic Algorithms; Van Nostrand Reinhold: New York, NY, USA, 1991.Processes 2021, 9, 1415 14 of 14
31. Winiczenko, R.; Górnicki, K.; Kaleta, A.; Martynenko, A.; Janaszek-Mańkowska, M.; Trajer, J. Multi-Objective Optimization of
Convective Drying of Apple Cubes. Comput. Electron. Agric. 2018, 145, 341–348. [CrossRef]
32. Winiczenko, R.; Górnicki, K.; Kaleta, A.; Janaszek-Mańkowska, M.; Choińska, A.; Trajer, J. Apple Cubes Drying and Rehydration.
Multiobjective Optimization of the Processes. Sustainability 2018, 10, 4126. [CrossRef]
33. Darvishi, H.; Farhudi, Z.; Behroozi-Khazaei, N. Multi-Objective Optimization of Savory Leaves Drying in Continuous Infrared-
Hot Air Dryer by Response Surface Methodology and Desirability Function. Comput. Electron. Agric. 2020, 168, 105112.
[CrossRef]
34. Luikov, A.V. Analytical Heat Diffusion Theory; Academic: New York, NY, USA, 1968.
35. Colorimetry, 3rd ed; Internationale Beleuchtungskommission, Technical Report; CIE, Central Bureau: Vienna, Austria, 2004;
ISBN 978-3-901906-33-6.
36. Schanda, J. CIE Colorimetry. In Colorimetry: Understanding the CIE System; Schanda, J., Ed.; John Wiley & Sons, Inc.: Hoboken, NJ,
USA, 2007; pp. 25–78. ISBN 978-0-470-17563-7.
37. Motevli, A.; Minaei, S.; Banakar, A.; Ghobadian, B.; Khoshtaghaza, M.H. Comparison of energy parameters in various dryers.
Energy Convers. Manag. 2014, 87, 711–725. [CrossRef]
38. Nadi, F.; Górnicki, K.; Winiczenko, R. A novel optimization algorithm for Echium amoenum petals drying. Appl. Sci. 2020,
10, 8387. [CrossRef]
39. Vieira, M.G.A.; Estrella, L.; Rocha, S.C.S. Energy Efficiency and Drying Kinetics of Recycled Paper Pulp. Dry. Technol. 2007, 25,
1639–1648. [CrossRef]
40. Fausett, L.V. Fundamentals of Neural Networks: Architectures, Algorithms, and Applications; Prentice-Hall: Englewood Cliffs, NJ, USA,
1994; ISBN 978-0-13-334186-7.
41. Barr, A.; Feigenbaum, E. The Handbook of Artificial Intelligence; Addison-Wesley: New York, NY, USA, 1989; Volume 3.
42. Kung, S. Digital Neural Networks; Prentice-Hall: Englewood Cliffs, NJ, USA, 1993.
43. Omid, M.; Baharlooei, A.; Ahmadi, H. Modeling drying kinetics of pistachio nuts with multi-layer feed-forward neural network.
Dry. Technol. 2009, 27, 1069–1077. [CrossRef]You can also read