CAIXA GERAL DE DEPÓSITOS CONSOLIDATED OPERATIONS - at 31 March 2015 Unaudited accounts
←
→
Page content transcription
If your browser does not render page correctly, please read the page content below
CAIXA GERAL DE DEPÓSITOS
CONSOLIDATED OPERATIONS
                 at 31 March 2015
               Unaudited accounts
2          CONSOLIDATED OPERATIONS AT 31 MARCH 2015   CGD

    2013
CGD     CONSOLIDATED OPERATIONS AT 31 MARCH 2015                                                                                             3

Index

               1 – Summary of evolution in 1st quarter .................................................................4
               2 – CGD: Highlights ................................................................................................6
               3 – Consolidated information ..................................................................................8
                                  Results ...............................................................................................8
                                  Balance Sheet ..................................................................................10
                                  Liquidity ............................................................................................11
                                  Solvency ...........................................................................................12
               4 – Operating segments .......................................................................................13
                                  Commercial Banking ........................................................................13
                                  International Activity .........................................................................18
                                  Investment Banking..........................................................................19
               5 – Rating .............................................................................................................22
               6 – Sustainability...................................................................................................23
               7 - Consolidated Accounts ....................................................................................24

This document is an English translation of the original Portuguese language document “Atividade Consolidada da Caixa
Geral de Depósitos em 31 de março de 2015”. The Portuguese original prevails in the event of any inconsistency.

INDEX
4 CONSOLIDATED OPERATIONS AT 31 MARCH 2015 CGD
2013
1 – Summary of evolution in 1st quarter (1)
For comparability purposes, the amounts of net income and income before tax and non-controlling interests
for 1st quarter 2014, were adjusted to reflect the current percentage equity stake in the insurance companies
(15% in Fidelidade and 20% in Multicare and Cares) at the said date.
Results
CGD’s net interest income was up 15.5% over the same quarter 2014, benefiting from
a decline of its funding cost, also higher than the reduction in income from lending
operations.
Net operating income was up by a positive 2.8% over 1st quarter 2014 to €497 million
for the period.
Gross operating income, at €175.7 million, was boosted by the international activity
contribute, which represented 61.4% of the total in the 1st quarter 2015.
Provisions and impairment for the quarter were down 34.3% by €59 million to €112.9 in
comparison to €171.9 million year-on-year, reflecting the gradual improvement of credit
risk conditions in the markets in which CGD operates.
Income before tax and non-controlling interests was €65.4 million, representing growth
of €47.6 million in comparison to 1st quarter 2014, with the exclusion of the results of
the insurance companies, appropriated at the time of their disposal, to ensure
comparability.
CGD’s consolidated net income attributed to shareholder for 1st quarter 2015 improved
€1.9 million over the comparable amount registered last year to a negative €8.9 million,
including the impact of the fiscal treatment of the loan impairment temporarily not
deductible.
Balance sheet
CGD’s consolidated balance sheet was down 10.5% by around €11,808 million in 1st
quarter 2015, over the same quarter 2014, essentially on account of the sale of the
insurance business – Fidelidade, Companhia de Seguros, S.A. (80% in May 2014 and
an additional 5% in January 2015).
The loans and advances to customers portfolio, including loans with repo agreements,
at €72,408 million (gross), was down 1.6% by €1,208 million over March 2014. Of this,
€1,253 million are due to the net impact of mortgage loans in Portugal, that increased
the new operations by 29.9% over March 2014, but still insufficient to offset portfolio
repayments.
Reference should be made to the increase in the market share of loans and advances
to companies for maturities of up to 1 year evidencing our backing of the Portuguese
companies’ working capital financing (18.4% in February 2015).
1 The amounts for March 2014 have been restated to reflect the application of IFRS 10 which led to the inclusion of IMOBCI in the
consolidation perimeter by the full consolidation method; non-controlling interests in open-ended investment funds, included in
the consolidation, were reclassified to other liabilities and other income from financial operations.
SUMMARY OF EVOLUTION IN 1ST QUARTERCGD CONSOLIDATED OPERATIONS AT 31 MARCH 2015 5 There was a positive change of €3,509 million in customer resources in 1st quarter 2015 (up 5.3% in comparison to 1st quarter 2014), to €70,026 million. The loans-to-deposits ratio of 95.9% reflected a negative commercial gap of €2,840 million which evidences the robustness of CGD’s retail resources-taking capacity, expressed by the €3,431 million increase in customer deposits. Liquidity CGD returned to the primary market in January 2015 with a €1 billion covered bonds issuance, with a maturity of 7 years and a coupon rate of 1% (a spread of 64 bps over the mid-swaps rate). Translating its comfortable liquidity situation, CGD Group decreased its funding from the ECB last year by €3,278 million (47.8%) to €2,987 million at the end of March 2015. In parallel and across the same period, CGD Group also reduced the amount of its assets eligible for the ECB pool by €3,120 million (20.8%) to €11,910 million in March 2015. The €8,923 million in assets available for the referred to pool at the end of 1st quarter 2015, compared favourably with the preceding year’s €8,702 million. The liquidity coverage ratio (LCR) at the end of March, calculated under CRD IV / CRR rules, was 97.8% against the preceding year’s 99.3%. This was significantly higher than the minimum requirement of 60% from October 2015 on and very close to the 100% requirement for 2018. The net stable funding ratio (NSFR) of 126.0% at the end of March, calculated in accordance with the same rules, in comparison to the preceding year’s 125.1%, also confirmed CGD Group’s comfortable liquidity situation. Solvency The common equity tier 1 (CET 1) ratios calculated in accordance with CRD IV / CRR phased-in and fully implemented rules, and considering the deferred tax assets special regime, totalled 10.9% and 10.3%, respectively, at 31 March 2015. The above ratios were 11.3% and 9.7% one year previously (March 2014). The current amounts reflect the improvement in CGD’s solvency levels. The fully implemented leverage ratio of 6.0%, calculated under CRD IV / CRR rules, was also an improvement over the March 2014 ratio of 5%. SUMMARY OF EVOLUTION IN 1ST QUARTER
6                                                                                                       CONSOLIDATED OPERATIONS AT 31 MARCH 2015                                  CGD

                                                                                2013

                            2 – CGD: Highlights
                                                                                                                                                                 (EUR million)

                                                                                                                                                        Change
                                                                                                                                               2015-03 vs 2014-03
    RESULTS                                                                            2014-03            2014-12           2015-03              Total               (%)
    Net interest income                                                                       232.2                    -           256.7               24.5            10.5%
    Net inter. income incl. inc. from equity investm.                                         237.7                    -           274.6               37.0            15.5%
    Commissions (net)                                                                         126.5                    -           126.3                -0.2           -0.2%
    Non-interest income                                                                       245.9                    -           222.4              -23.5            -9.6%
    Net operating income from banking                                                         483.5                    -           497.0               13.5             2.8%
    Operating costs                                                                           301.5                    -           321.3               19.8             6.6%
    Gross operating income                                                                    182.0                    -           175.7                -6.3           -3.5%
    Income before tax and non-controlling interests                                            50.9                    -             65.4              14.5            28.4%
    Inc. before tax and non-cont. interests, adjusted                          (1)             17.7                    -             65.4              47.6          268.7%
    Net income                                                                                 22.4                    -             -8.9             -31.3                   -
    Net income, adjusted              (1)                                                     -10.7                    -             -8.9                1.9           17.5%
    BALANCE SHEET
    Net assets                                                                            112,413           100,152            100,605            -11,808            -10.5%
    Cash and loans and advances to credit instit.                                             3,911             5,130              5,357             1,447             37.0%
    Securities investments (2)                                                              18,862            19,562             19,906              1,044              5.5%
    Loans and advances to customers (net)                         (3)                       69,062            67,554             67,320             -1,742             -2.5%
    Loans and advances to customers (gross)                             (3)                 73,688            72,785             72,480             -1,208             -1.6%
    Central banks' and credit institutions' resources                                         9,444             6,002              5,935            -3,509           -37.2%
    Customer resources                                                                      66,517            71,134             70,026              3,509              5.3%
    Debt securities                                                                           8,430             7,174              8,126               -304            -3.6%
    Shareholders' equity                                                                      7,162             6,493              6,779               -383            -5.3%
    RESOURCES TAKEN FROM CUSTOMERS                                                        94,017           100,086           100,333                6,317               6.7%
    PROFIT AND EFFICIENCY RATIOS
    Gross return on equity - ROE (4) (5)                                                      2.9%              -3.2%              3.7%
    Net return on equity - ROE                (5)                                             1.9%              -3.6%              0.6%
    Gross return on assets - ROA                     (4) (5)                                  0.2%              -0.2%              0.3%
    Net return on assets - ROA                 (5)                                            0.1%              -0.3%              0.0%
    Cost-to-income           (4)                                                            62.1%              75.5%             64.3%
    Employee costs / Net operating income                         (4)                       36.0%              41.5%             37.6%
    Operating costs / Average net assets                                                      1.1%               1.3%              1.3%
    Net operating income / Average net assets                            (4)                  1.7%               1.7%              2.0%
    Note: The amounts for March 2014 have been restated to reflect the application of IFRS 10 which led to the inclusion of IMOBCI in the consolidation perimeter by the full
    consolidation method; non-controlling interests in open-ended investment funds, included in the consolidation, were reclassified to other liabilities and other income from
    financial operations.
    (1) For comparability purposes, the amounts for 1st quarter 2014, were adjusted to reflect the current percentage equity stake in the insurance companies (15% in
       Fidelidade and 20% in Multicare and Cares) at the said date.
    (2) Includes assets with repo agreements and trading derivatives.
    (3) Includes assets with repo agreements.
    (4) Ratios defined by the Bank of Portugal (instruction 23/2012).
    (5) Considering average shareholders' equity and net asset values (13 observations).

                                                                                                                                                               CGD: HIGHLIGHTS
CGD CONSOLIDATED OPERATIONS AT 31 MARCH 2015 7
(%)
CREDIT QUALITY AND COVER LEVELS 2014-03 2014-12 2015-03
Overdue credit / Total credit 7.1% 7.7% 8.1%
Credit more than 90 days overdue / Total credit 6.5% 7.1% 7.2%
Non-performing credit / Total credit (4) 8.1% 8.9% 9.1%
Non-performing credit (net) / Total credit (net) (4) 1.8% 1.8% 2.1%
Credit at risk / Total credit (4) 11.5% 12.2% 12.4%
Credit at risk (net) / Total credit (net) (4) 5.5% 5.3% 5.6%
Restructured credit / Total credit (6) 9.6% 10.6% 10.5%
Restr. crd. not incl. in crd. at risk / Total crd. (6) 5.3% 6.3% 5.2%
Overdue credit coverage 89.3% 94.3% 88.1%
Credit more than 90 days overdue coverage 97.3% 102.3% 99.2%
Crd. Imp. (P&L) / Loans & adv. custom. (aver.) 0.90% 1.18% 0.40%
STRUCTURE RATIOS
Loans & adv. customers (net) / Net assets 60.9% 66.8% 66.3%
Loans & adv. custom. (net) / Custom. dep. (4) 103.6% 94.5% 95.9%
SOLVENCY RATIOS (CRD IV/CRR) (7)
Common equity tier 1 (phased-in) 11.1% 10.9% 0.0%
Tier 1 (phased-in) 11.1% 10.9% 0.0%
Total (phased-in) 12.6% 12.7% 0.0%
Common equity tier 1 (fully implemented) 8.6% 9.8% 0.0%
Considering DTA:
Common equity tier 1 (phased-in) 11.3% 11.1% 10.9%
Tier 1 (phased-in) 11.3% 11.1% 10.9%
Total (phased-in) 12.9% 12.9% 12.4%
Common equity tier 1 (fully implemented) 9.7% 10.2% 10.3%
LIQUIDITY AND LEVERAGE RATIOS (CRD IV/CRR)
Leverage ratio (fully implemented) 5.0% 6.1% 6.0%
Liquidity coverage ratio 99.3% 103.6% 97.8%
Net stable funding ratio 125.1% 126.0% 126.0%
(6) Ratios defined by the Bank of Portugal (instruction 32/2013)
(7) Solvency ratios include results for the period.
CGD: HIGHLIGHTS8 CONSOLIDATED OPERATIONS AT 31 MARCH 2015 CGD
2013
3 – Consolidated information
Results
Consolidated net
income before tax In a context of continuously declining interest rates and greater competition, CGD’s
and non-controlling
interests of €65.4 consolidated net income before tax and non-controlling interests totalled €65.4 million. This
million up year-on- represents a growth of €47.6 million over 1st quarter 2014, with the exclusion of the results
year by €47.6 million of the insurance companies which were appropriated at the time of their disposal to ensure
on a comparable comparability.
basis
Notwithstanding the downwards trajectory of Euribor rates, active management of net
interest income particularly in respect of borrowing operations, produced a 10.5% year-on-
year growth of €24.5 million in net interest income which benefited from a decline in funding
Active management costs which was higher than the reduction in income from lending operations. Income from
of net interest
equity instruments in turn, increased by €12.5 million, leading to a 15.5% increase in net
income provides an
increase of 15.5% interest income including income from equity instruments.
Income from financial operations totalled €94 million at the end of the 1st quarter, in
comparison to €118.8 million in the same period of the preceding year, reflecting the positive
Good performance evolution of the public debt market in a context of a marked decline in interest rates.
by financial
operations Net commissions at €126.3 million, were very similar to those of the same quarter 2014
(down 0.2%).
Net operating income was up 2.8% over 1st quarter 2014 to €497 million.
Net operating
income up by a Operating costs were 6.6% up year-on-year by €19.8 million, notwithstanding the
positive 2.8% furtherance of the policy of optimising efficiency and operational rationalisation. This
particularly translated the behaviour of employee costs which were up 7.6% by €13.3 million
over the same period of the preceding year, reflecting the marked decline in the discount
rate on pensions liabilities and the expansionary dynamics of the Group’s international
Operating costs up activity, with an increase in the size of its branch office network and a larger employee
6.6%, particularly
complement, particularly in the case of subsidiaries BCI Moçambique (with the opening of
owing to the
expansion of an additional 34 branches between March 2014 and March 2015 and the recruitment of 450
international activity new employees) and Banco Caixa Totta de Angola with an additional 7 branches.
These latter two subsidiaries also made an expressive contribution to the 6.1% growth of
€6.1 million in external supplies and services.
Cost-to-income ratio In light of the evolution described and notwithstanding the growth of net operating income,
of 64.3% against the cost-to-income indicator was 64.3% against the 62.1% registered in the same quarter
75.5% at the end of 2014, albeit significantly more favourable than the 75.5% posted at the end of 2014.
2014
CONSOLIDATED INFORMATIONCGD CONSOLIDATED OPERATIONS AT 31 MARCH 2015 9
OPERATING COSTS AND DEPRECIATION
(EUR million)
Change
2014-03 2015-03 Total (%)
Employee costs 174.7 188.0 13.3 7.6%
Other administrative expenses 100.5 106.6 6.1 6.1%
Depreciation and amortisation 26.3 26.7 0.4 1.4%
Total 301.5 321.3 19.8 6.6%
Translating the combination of all of these factors, gross operating income of €175.7 million International
operations make a
in the quarter was down 3.5% over the same period last year. Special reference should be
relevant contribution
made to the highly positive performance of international activity, whose contribution to to gross operating
consolidated gross operating income was up 40.2% to €107.8 million. income
CONTRIBUTION TO GROSS OPERATING INCOME
(EUR million)
2014-03 2015-03
Domestic commercial banking 69.8 59.8
International activity 76.9 107.8
Investment banking 35.9 12.2
Other -0.7 -4.0
Gross operating income 182.0 175.7
Provisions and impairment for the quarter were down 34.3% by €59 million to €112.9 million,
in comparison to the €171.9 million for the same period last year. The gradual improvement
Reduction of cost of
in the economic and financial environment permitted a reduction of credit risk which stood credit risk to 0.40%
at 0.40% in 1st quarter 2015, in comparison to 0.90% for the same quarter of the preceding (0.90% in 1st quarter
year. 2014)
PROVISIONS AND IMPAIRMENT IN PERIOD
(EUR million)
200.0 171.9 -34.3% 112.9
180.0
160.0
140.0
120.0
100.0
80.0 168.5
71.4
60.0
40.0
20.0 3.3 41.5
0.0
2014-03 2015-03
Credit impairment net of reversals
Provisions and impairment of other assets (net)
Maintenance of
Tax costs for the 1st quarter totalled €54.4 million owing to the impact of the fiscal treatment downwards trajectory
of the loan impairment temporarily not deductible and the extraordinary contribution of €7.5 of provisions and
million payable by the banking sector, leading to consolidated negative net income of €8.9 impairment costs
million. This was an improvement of €1.9 million over the result posted in the same period
of the preceding year.
CONSOLIDATED INFORMATION10 CONSOLIDATED OPERATIONS AT 31 MARCH 2015 CGD
2013
Balance Sheet
The Group’s consolidated net assets, at the end of March 2015, were up 0.5% by €453
Reduction of assets, million over the end of the preceding year to €100,605 million. The 10.5% decrease of
particularly owing to €11,808 million in comparison to the same month last year was largely the result of the
the disposal of the disposal of the equity of the Group’s insurance companies (80% in May 2014 and an
capital of the Group’s additional 5% in January 2015).
insurance
businesses The loans and advances to customers portfolio, including loans with repo agreements, at
€72,480 million (gross) and €67,320 (net). The year-on-year reduction of loan balances was
1.6% (gross) and 2.5% (net).
Securities investments, including assets with repo agreements and trading derivatives, were
up 5.5% by €1,044 million over March 2014 to €19,906 million. This portfolio was up 1.8%
by €344 million over the end of 2014.
Total liabilities of €93,825 million were down 10.9% over March 2014. This also translated
the effects of the disposal of the insurance business together with a €3,278 million reduction
of funding from the ECB.
Customer resources were up €3,509 million in 1st quarter 2015 (up 5.3% over 1st quarter
Robust retail 2014) to €70,026 million.
resources-taking
capacity The deposits-to-loans ratio of 95.9% reflected a negative commercial gap of €2,840 million
and evidences CGD’s robust retail resources-taking capacity.
LOANS TO DEPOSITS RATIO
(EUR million)
160,000 103.6% 94.5% 95.9%
140,000
120,000
100,000 66,157 70,718 69,589
80,000
60,000
40,000
68,515 66,864 66,749
20,000
0
2014-03 2014-12 2015-03
Customer deposits
Loans and advances to customers (net)
The credit overdue for more than 90 days ratio was 7.2%. In spite of the fact that it was
Credit overdue for higher than the preceding year’s ratio of 6.5%, it has stabilised against the 7.1% of December
more than 90 days of the preceding year. The respective impairment coverage ratio in March 2015 was 99.2%.
stabilises against
December 2014 The credit at risk and restructured credit ratios, calculated according to Bank of Portugal
criteria, were 12.4% and 10.5% respectively (12.2% and 10.6% at the end of 2014).
Reference should be made to the penalising effect of the reduction of the portfolio balance
on these indicators.
CONSOLIDATED INFORMATIONCGD CONSOLIDATED OPERATIONS AT 31 MARCH 2015 11
Liquidity
Following the implementation of the monetary policy initiatives tending to reduce funding
costs and stimulate economic growth, in 2014, the ECB Council decided, at the start of 2015,
to expand the quantitative easing programme to include, starting March, investment grade
bonds denominated in euros and issued by governments of member states and European
institutions.
This collection of ECB measures has sustained a trend towards the reduction of market
interest rates to historically low and even negative values in some cases, making it possible
to stimulate lending to corporates and individuals by reducing funding costs.
Sustained reduction
In its awareness of the ECB’s favourable funding terms and in the sphere of this authority’s of ECB funding at
€2,980 million in
strategy, CGD continued to substitute a part of its funding from the ECB in the first 3 months
March against
of 2015 by new TLTROs (“targeted longer term refinancing operations”) notwithstanding a €3,110 at the end of
reduction of its total liabilities to the ECB. 2014
CGD’s funding from the ECB was down €250 million over December 2014 to €1.25 billion at
the end of March. On a CGD Group level, total resources taken from the monetary authority
were also down from €3.11 billion at the end of 2014 to €2.99 billion in March 2015.
ECB FUNDING (CONSOLIDATED)
(EUR million)
9,000 -64.5%
vs. 2012-12
8,000
7,000
6,000
5,000
4,000 8,415
3,000 6,335
2,000
3,110 2,987
1,000
0
2012-12 2013-12 2014-12 2015-03
As regards the assets pool eligible for Eurosystem operations and notwithstanding a slight
reduction of €163 million of the total within CGD Group in comparison to the end of the Pool assets
preceding year, the amount of available pool assets remained stable at close to €9 billion. remained stable at
€9 billion
CGD went to the market in January with a new covered bonds issuance of €1 billion with a
maturity of 7 years at a coupon rate of 1%. This was a historically low level for Portuguese
debt issuances with this maturity. The final placement was oversubscribed by 1.4 and
attracted investors with a significant geographical spread. Particularly noticeable were
German investors (23%).
The issuance’s objectives were easily exceeded with a much higher placement than in past New covered bonds
issuances (€1 billion in comparison to €750 million in 2013 and 2014), with a longer maturity issuance in January
of 7 years and a visible reduction of funding costs. 2015, of €1 billion
with a maturity of 7
years, at a
historically low
coupon rate of 1%
CONSOLIDATED INFORMATION12 CONSOLIDATED OPERATIONS AT 31 MARCH 2015 CGD
2013
The liquidity coverage ratio (LCR) at the end of March, calculated under CRD IV / CRR rules,
was 97.8% against the preceding year’s 99.3%. This was significantly higher than the
minimum requirement of 60% from October 2015 on and very close to the 100% requirement
for 2018.
Comfortable liquidity
situation confirmed
The net stable funding ratio (NSFR) of 126.0% at the end of March, calculated in accordance
by LCR ratio (97.8%)
and NSFR ratio with the same rules, in comparison to the preceding year’s 125.1%, also confirmed CGD
(126%) Group’s comfortable liquidity situation.
Solvency
The Group's shareholders' equity, down 5.3% by €383 million over the end of March 2014 to
€6,779 million at the end of March 2015, was influenced by the evolution of "other reserves
and retained earnings". The evolution in comparison to the end of the preceding year,
reflecting the increase in fair value reserves and non-controlling interests, was a positive
4.4%.
SHAREHOLDERS’ EQUITY
(EUR million)
2014-03 2014-12 2015-03
Share capital 5,900.0 5,900.0 5,900.0
Fair value reserves 526.8 411.8 545.6
Other reserves and retained earnings -185.6 -437.9 -669.4
Non-controlling interests 898.6 966.9 1,012.2
Net income 22.4 -348.0 -8.9
CET 1 phased-in and Total 7,162.3 6,492.8 6,779.5
fully implemented
totalled 10.9% and The common equity tier 1 (CET 1) ratios calculated in accordance with CRD IV / CRR
10.3%, respectively phased-in and fully implemented rules, and considering the deferred tax assets special
regime, totalled 10.9% and 10.3%, respectively, at 31 March 2015. The above ratios were
11.3% and 9.7% one year previously (March 2014). The current amounts reflect the
improvement in CGD’s solvency levels.
Improvement of the The fully implemented leverage ratio of 6.0%, calculated under CRD IV / CRR rules, was
leverage ratio to also an improvement over the March 2014 ratio of 5%.
6.0%
CONSOLIDATED INFORMATIONCGD CONSOLIDATED OPERATIONS AT 31 MARCH 2015 13
4 – Operating segments
Commercial Banking
In first quarter 2015, Caixa maintained its strategic focus on backing companies in a
particularly positive context associated with “Portugal 2020 Programmes”. Continuing along
its trajectory of strengthening its position as a “corporate bank”, with account managers Across-the-board
specialising in SMEs, micro-enterprises and entrepreneurs – it furthered and enhanced its economic support to
all sectors
backing for the economy across all economic sectors and particularly in the case of
producers of tradable goods and exporting companies, based on a comprehensive sectoral
range of products and services and a strong international presence focusing on backing the
treasury function and corporate capitalisations.
Companies:
Caixa retained the strategy for its approach to individual customers, developed in 2014, with
guideline principles based on retaining customer loyalty, use of products, knowing its Comprehensive
sectoral offer
customers and meeting their needs, together with profitability.
Strong
international
Caixa implemented a series of actions designed to further enhance its offer in 1st quarter
presence
2015, particularly:
Focus on treasury
support and
A more dynamic commercial approach, focusing on finding new customers and corporate
retaining the loyalty of existing customers by maximising their value to the Bank via capitalisations
commercial relationships;
Integrated offers targeted at specific customer groups such as young people, Caixa
Woman and Caixa Activa;
Launch of Caixa Comércio e Serviços (“Commerce and Services”) package, as an Individual customers
– guideline principles:
integrated banking products and services solution, including POS, with special
prices for one-off sales of products and payment of a fixed instalment; Retaining of
customer loyalty
Functional improvements to Caixa E-Banking and Caixadirecta, in terms of access Use of products
to the online foreign exchange platform to complement our trade finance offer and Knowledge and
launch of a new app for Windows Phone 8.1, accessible by smartphone, providing customer
satisfaction
a pleasant, interactive navigational experience with a graphical overview of a
Profitability
customer’s global position and account balances and movements;
Product and services innovation by reinforcing renting facilities (associated with
brand campaigns) and the provision of non-financial corporate services such as
application processes for incentives programmes;
Improvement of
Campaigns for the corporate segment: Caixa E-Banking and
Caixadirecta
- “Reinvigoration of Iberian Offer”, campaign on the theme: “We know how functionalities
hard you’ve worked to be present in the Iberian market”;
- PME Excelência (“Excellence SMEs”) and PME Líder (“Leading SMEs”)
campaigns, announcing Caixa's results in 2014 (an 85% increase in PME
Excelência and 15% increase in PME Líder statuses), on the theme: “O New campaigns to
balanço está feito. Aproveite o embalo” (“The stock has been taken. Now enhance corporate
it’s up to you”). offer
- “Pacotes Empresas” (“Corporate Packages”) campaign, on the theme
“Good management also means paying less” with tickets for summer
festivals for applications received by 31 July.
OPERATING SEGMENTS14 CONSOLIDATED OPERATIONS AT 31 MARCH 2015 CGD
2013
CGD Group furthered its programme to optimise the capillarity of its sales network, as part
of its sustained development of an integrated multichannel offer.
Caixa continued to adjust its physical domestic retail network in the first three months of
Adjustments to 2015. The network, at 31 March, comprised 700 branches with face-to-face services (20
domestic branch
fewer than at the end of 2014), 42 self-service branches and 26 Caixa Empresas offices,
office network to 768
business units totalling 768 business units (down 2.3% over December 2014).
Notwithstanding this reduction Caixa is still the only bank having a branch office network
with a physical presence in all municipal districts nationwide, and continues to focus on
positive differentiation in terms of customer experience and commercial dynamics, by
expanding dedicated management services to more than 1 million individual and 40,000
Caixa Mais and corporate customers, comprising:
Caixazul services:
two complementary The Caixazul service, available at 565 branches (81% of the branch office network)
approaches to at the end of 2014, with 924 dedicated managers;
individual customers
The Caixa Mais service with 1,333 commercial assistants at 666 branches (95% of
the branch office network);
The Caixa Empresas service. This is a personalised management service
comprising an integrated approach to the business and individual requirements of
Caixa Empresas
its customers, geared to:
service posts a 7.1%
increase in turnover - SMEs, across a proprietary network of 26 offices with 101 dedicated
deriving from CGD’s
managers,
“corporate bank”
approach - The self-employed and micro-enterprises with a team of 317 dedicated
managers and Caixa Empresas spaces at 694 Caixa branch offices.
The Caixazul and Caixa Mais service models account for 61.4% of turnover in the individual
customers segment. The Caixa Empresas service on the branch office network, with
turnover of €4,043 million, grew 7.1% year-on-year.
Our unwavering commitment to integrated channel management and humanisation of
distance channels endeavours to provide for customers’ main needs, ensuring procedural
coherence as a business facilitator and placing the Bank at the forefront in terms of seamless
channels.
Resources
CGD retains its lead
of the customer The market share of customer deposits continued to be dominant in Portugal at 28.9% in
deposits market with February 2015. Special reference should be made to individual customers with 31.9%.
28.9%
Caixa launched various savings and investment solutions across 1st quarter 2015 to promote
the retention and growth of suitably profitable balance sheet resources. Reference should
be made, in terms of deposits to the two bi-monthly resource-taking initiatives (in the form of
a base and integrated deposits offer) and automatic savings solutions. Thirteen tracker
Deposits in Portugal deposits with guaranteed capital on maturity, short and medium term with varied interest
up 4.2% to €57,187
million structures were commercialised.
The first three months of 2015 witnessed a positive evolution of resource-taking on the
domestic branch office network with an additional €3,813 million over the same period last
year, particularly deposits, which grew 4.2% to €57,187 million.
Domestic resource- Resource-taking in the corporate segment was up 7.9%, particularly comprising deposits (up
taking up 7.9% 6.6%), financial insurance (up 11.4%) and investment funds (up 35.7%), which offset the
(corporate) and 3.4%
3.4% downturn in the case of bonds.
(individual
customers) Resource-taking as a whole was up 3.4% in the case of individual customers. Particular
OPERATING SEGMENTSCGD CONSOLIDATED OPERATIONS AT 31 MARCH 2015 15
reference should be made to the growth of funds and financial insurance (up 24.6% and
22.3%, respectively). Deposits were slightly down by 0.2%, as opposed to bonds which
remained unchanged year-on-year.
Regarding the general government segment, March 2015 registered a year-on-year growth
of 49.8% in deposits, raising the respective market share to 39.3% in February 2015.
Favourable evolution
In Group terms, the resources-taken balance (excluding the interbank market) totalled of off-balance sheet
€109,233 million, i.e. year-on-year growth of 5.7%, to which a contributory factor was also resources
the favourable evolution of off-balance sheet resources which were up 10.9% over the end contributes to
of March 2014. increase in total
resources taken
RESOURCES TAKEN BY CGD GROUP – BALANCES
(EUR million)
Change Change
2015-03 vs 2014-03 2015-03 vs 2014-12
2014-03 2014-12 2015-03 Total (%) Total (%)
Balance sheet 77,493 80,737 80,607 3,114 4.0% -130 -0.2%
Retail 68,198 72,796 71,707 3,509 5.1% -1,088 -1.5%
Customer deposits 66,157 70,718 69,589 3,431 5.2% -1,129 -1.6%
Other customer resources 2,041 2,078 2,119 78 3.8% 41 2.0%
Institutional investors 8,395 7,041 8,000 -396 -4.7% 959 13.6%
EMTN 2,948 2,282 2,336 -611 -20.7% 55 2.4%
Covered bonds 4,520 4,579 5,516 996 22.0% 937 20.5%
Other 928 180 147 -781 -84.1% -32 -18.0%
Portuguese State - Conting. convert. bonds 900 900 900 0 0.0% 0 0.0%
Off-balance sheet 25,818 27,291 28,626 2,808 10.9% 1,335 4.9%
Total 103,312 108,027 109,233 5,921 5.7% 1,206 1.1%
Total (excl. inst. inv. and Portuguese state) 94,017 100,086 100,333 6,317 6.7% 247 0.2%
Not considering resources taken from institutional investors and CoCo bonds, the year-on-
year change comprised an additional €6 317 million (up 6.7%).
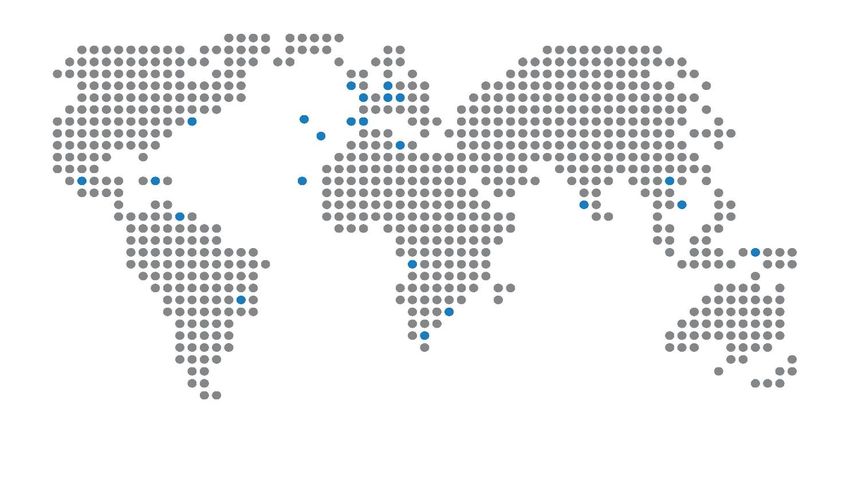
The international area’s contribution to the deposits total, particularly the business units in
Asia, Africa and France, remained highly favourable (up 18.2% over 1st quarter 2014 to
€15 941 million).
CUSTOMER DEPOSITS - INTERNATIONAL ACTIVITY Increase of 18.2% in
(%) international area
deposits, particularly
Other from business units
Spain in Asia, Africa and
9% 15%
France
PALOP France
26% 16%
Asia
34%
Note: PALOP – Portuguese Language Speaking African Countries
OPERATING SEGMENTS16 CONSOLIDATED OPERATIONS AT 31 MARCH 2015 CGD
2013
Credit
The economic environment in Portugal and its main trading partners in the euro zone has
conditioned corporate demand for credit, both in terms of amount and type. In these
circumstances, the volume of new corporate lending in CGD’s domestic activity is still
insufficient to offset portfolio repayments and is reflected in a 6.4% reduction of the
respective balance.
New Crédito PME Investe (“SME Invest”) credit lines for SMEs totalled around €35.5 million
in 2015, with a total portfolio of €1,412 million at 31 March 2015.
CGD continued to come 2nd in the ranking of PME Crescimento (“SME Growth”) lines in 2014,
with 17.8% of the market, as well as in the secondary general line of credit with a market
share of 18.0% while retaining its lead of the secondary exports line with 32.7%, confirming
its strategy of backing exporting companies.
CGD retained the leadership of the Investe QREN (“SRF Invest”) line with a market share of
49.0%.
18.0% market share CGD had an 18.0% share of loans and advances to companies in February 2015 (against
of loans and 18.1% at the end of 2014) in a context of highly aggressive competition from the major banks
advances to
operating in this segment in Portugal.
companies
MARKET SHARE – CORPORATE LOANS
(%)
19%
18%
18.1% 18.1% 18.0%
17%
17.3%
16% 16.4% 16.4%
Favourable evolution
of market share of 15% 15.5%
loans and advances
to companies with
maturities of up to 1 14%
year in a highly 2009-12 2010-12 2011-12 2012-12 2013-12 2014-12 2015-02
competitive context
Reference should be made to the increase in the market share of loans and advances to
companies for maturities of up to 1 year from 17.9% in December 2014 to 18.4% in February
Mortgage loans 2015, evidencing our backing of the Portuguese companies’ working capital financing.
portfolio down 4.1%
in spite of the 29.9% New mortgage credit operations in Portugal were up 29.9% year-on-year to €149.4 million.
year-on-year growth The volume of repayments and settlements outpaced the volume of new operations,
in new contracts resulting in a year-on-year reduction of 4.1% in the amount of portfolio credit
OPERATING SEGMENTSCGD CONSOLIDATED OPERATIONS AT 31 MARCH 2015 17
MORTGAGE CREDIT PORTFOLIO – BRANCH OFFICE NETWORK
(PORTUGAL)
(EUR million)
35,000 -4.1%
30,000
25,000
20,000
15,000 30,350 29,097
10,000
5,000
0
2014-03 2015-03
In consolidated terms, loans and advances to customers (gross) totalled €72,480 million at
the end of 1st quarter 2015. This was down 1.6% by €1,208 million year-on-year. CGD
Portugal was responsible for €54,956 million and the Group’s other business units for
€17,523 million, representing 76% and 24% of the loans and advances to customers total
respectively.
LOANS AND ADVANCES TO CUSTOMERS (a) (CONSOLIDATED)
(EUR million)
Change Change
2015-03 vs 2014-03 2015-03 vs 2014-12
2014-03 2014-12 2015-03 Total (%) Total (%)
CGD's operations in Portugal 57,702 55,670 54,956 -2,746 -4.8% -714 -1.3%
Corporate 22,283 21,289 20,919 -1,364 -6.1% -370 -1.7%
General government 3,014 3,139 3,097 83 2.7% -42 -1.3%
Institutionals and other 936 768 819 -118 -12.5% 50 6.6%
Individual customers 31,468 30,474 30,121 -1,347 -4.3% -353 -1.2%
Mortgage loans 30,350 29,418 29,097 -1,253 -4.1% -321 -1.1%
Other 1,118 1,056 1,024 -94 -8.4% -32 -3.0%
Other CGD Group companies 15,985 17,114 17,523 1,538 9.6% 409 2.4%
Total 73,688 72,785 72,480 -1,208 -1.6% -305 -0.4%
(a) Before impairment and including loans with repurchase agreement.
The banks in Africa posted year-on-year growth of 31.5% in their loans and advances to
customers (gross), to €3,195 million, in 1st quarter 2015. Reference should be made to BCI
Gross credit
in Mozambique with a 38.9% increase of €444 million and, in the case of Macau, to the 64.7% particularly includes
year-on-year increase of €1,047 million, in lending by BNU. In short there was a 12.4% year-on-year growths
increase of loans and advances to customers by international operations to €14,863 million of 39% and 65% by
in March 2015. BCI and BNU,
respectively
OPERATING SEGMENTS18 CONSOLIDATED OPERATIONS AT 31 MARCH 2015 CGD
2013
International Activity
Aware of the international area’s fundamental role in the Group’s current development and
the business potential existing in the geographical diversity of its international platform, CGD
International activity has encouraged interconnection between diverse entities with the aim of leveraging its own
with an enhanced and its customers’ business based on a single commercial network.
strategic importance
based on the strong With a presence on four continents, CGD Group has a vast international commercial network
integration of Caixa’s
with 460 branches and corporate offices, which has been progressively broadened,
global network
particularly in Angola and Mozambique as countries which achieved a more than 30%
increase in the rate of geographic expansion between 2012 and first quarter 2015.
The initiatives to reinvigorate international business developed in the first quarter were
International branch responsible for the global increase of trade finance operations and a significant increase in
office network with the number of customers whose internationalisation projects rely upon CGD backing.
460 branches and
corporate offices Reference should also be made to the organisation of various actions to reinvigorate and
empower business, both in Portugal and in several of Caixa’s priority markets, to leverage
business opportunities for Group customers.
As regards CGD’s management of lines of credit for Portuguese exports, around €50 million
Increase in trade was disbursed to exporting companies accompanied by various initiatives to extend the
finance operations periods of use of currently existing lines.
and number of
customers whose With different levels of growth in line with the market in which they operate, the business
internationalisation is units in CGD Group’s international area pursued the objective of strengthening their position,
backed by CGD
with special emphasis in African counties in which they seek to play an active role in
endeavouring to increase the percentage of the population holding a bank account.
The Group's banks in the African market have reinvigorated their local partnerships with the
objective of backing the economy and their customers' business growth, with the objective
Strengthening of the
position of the of achieving benchmark status on the country’s banking map.
international
business units as In Mozambique, BCI (Banco Comercial e de Investimentos) and Camões - Instituto da
benchmark Cooperação e da Língua, Instituto para a Promoção das Pequenas e Médias Empresas
institutions in their (IPEME) and AMB (Association of Mozambican Banks) jointly entered into an agreement to
respective markets, provide financial backing and define the terms and conditions of the financial support from
with special
FECOP (Fundo Empresarial de Cooperação Portuguesa), which has an overall credit ceiling
reference to African
countries. of more than €270 million meticais. This Fund aims to make loans to micro, small and
medium-sized enterprises, associations and cooperatives in various areas of activity.
On the other hand and as in 2014, BCI launched a 500 million meticais line of credit for
women entrepreneurs (twice the preceding amount) to provide special funding to individual
BCI launches a 500 women entrepreneurs and SMEs managed by women. The increase in the line of credit
million meticais line follows last year’s broad acceptance of this offer.
of credit for women
entrepreneurs Strengthening its image as a bank which is truly engaged in the country’s development, BCI
signed an agreement at the end of 2014 under which it became a founding member of the
Gorongosa Business Club. In its choice of the “Educational Project for Vulnerable Children”,
as one of the six priorities of the Park’s Rehabilitation Project proposed to BCI, the bank
aims to contribute towards helping children living inside the Park and on its periphery.
In Cape Verde, Banco Interatlântico (BI) and the Ministry of Culture, via the Cultural Bank,
entered into a partnership agreement in March, setting up a line of credit for projects eligible
for promoting the sector. The Cultural Bank has been provided with more resources to fund
OPERATING SEGMENTSCGD CONSOLIDATED OPERATIONS AT 31 MARCH 2015 19
projects, with BI contributing to the development of the local artistic community and the
perception of its activity as a business.
The commitment to expanding the branch office network in Angola and Mozambique has
translated into Group banks’ activity in these countries whose net income levels increased International area
makes a positive
by 43% and 58% respectively. contribution of €22.3
million to
The Group’s international area continues to make an important contribution in achieving consolidated net
€22.3 million in consolidated net income in the first quarter. income
INTERNATIONAL ACTIVITY CONTRIBUTION TO THE CONSOLIDATED
NET INCOME
(EUR million)
2014-03 2015-03 Change
Banco Nacional Ultramarino (Macau) 9.4 14.4 5.0
Banco Caixa Geral (Spain) 7.1 10.5 3.4
France Branch 7.5 9.6 2.1
Banco Caixa Geral Totta Angola 3.5 5.1 1.5
Other -4.8 -17.2 -12.4
Total International 22.7 22.3 -0.4
The highest performance levels were turned in by the business units located in Asia and
Africa, with BNU Macau having posted a positive level of net income of €14.4 million in the
1st quarter in comparison to €9.4 million for the same quarter last year. Banco Caixa Totta
de Angola and BCI in Mozambique contributed €5.1 million and €4.5 million, respectively.
In Europe the recovery of the results of BCG Spain (€10.5 million) and the France branch
(€9.6 million), enabled an overall net income level of €6.3 million to be achieved, up 142%
year-on-year.
International area’s
In operating terms, international operations contributed €108 million to gross operating contribution to gross
income. This was up 40% year-on-year and represented around 62% of the Group’s operating income up
consolidated gross operating income. In spite of the 15.2% growth of structural costs, partly 40% to €108 million
on account of the expansion of the branch office network in Angola and Mozambique, the
26.3% increase in overall net operating income from banking helped to improve cost-to-
income in the international area to 50.5% in comparison to the March 2014 ratio of 55.3%.
19% growth in
Reference should also be made to the international area’s contribution to the Group’s
resource-taking by
liquidity, based on a global 19% increase in resource-taking from customers to €16.2 billion the international area
and representing around 23% of the Group customers’ resources against 20.5% in the same
period of the preceding year.
Special reference should be made to the markets of Angola (up 49.6% by around €533.7
million), Mozambique (up 29.7% by around €434.5 million), Macau (up 22.7% by around
€958.8 million) and France (up 10.8% by around €250.3 million), which, as a whole,
represented 84.5% of the international area’s global growth.
Investment Banking
CaixaBI with net
Caixa Banco de Investimento’s (CaixaBI’s) activity in the 1st quarter generated net operating operating income of
income of €18.2 million. This would have been €28.4 million if adjusted for the negative €18.2 million
impact of write-offs of around €10.2 million in the derivatives portfolio, corresponding to year-
on-year growth of 12.4%.
OPERATING SEGMENTS20 CONSOLIDATED OPERATIONS AT 31 MARCH 2015 CGD
2013
The existing macroeconomic framework continued to penalise the Bank’s results of €0.2
million in the 1st quarter, affected by higher provisions and impairment, totalling €9.4 million,
plus the €10.2 million in income from financial assets.
Cost-to-income of
21.5% after Cost-to-income of 21.5% remained clearly lower than that of its peers.
adjustment
CaixaBI was involved in various emblematic deals, consolidating its leading position in the
investment banking area. The following are the main business area highlights.
Project finance
Reference should be made, in this area, to the completion of the economic-financial
rebalancing operation for the municipal public service water supply concession for the
municipal district of Cascais – Águas de Cascais – which included an addendum to the loan
agreements.
Structured finance
Mention should be made of the advisory services in the sphere of the structuring and
organisation of the process for the reorganisation of the financial liabilities of the Promor and
Marques Groups, in addition to the financial services for the disposal of CGD – Spain
branch’s loan to the Habitat project.
Corporate finance – advisory
Reference should be made to the financial advisory services to Fidelidade as part of the
process for the economic and financial valuation of Via Directa.
Economic and financial appraisals were also carried out on diverse CGD associates, in the
sphere of impairment and equity stake analyses, as well as an economic-financial appraisal
of associates Águas de Portugal and Caixa Leasing e Factoring for Parcaixa.
Debt capital market
Particular reference should be made to the following major operations in the primary bond
market:
Republic of Portugal: joint lead manager and bookrunner for the Treasury bond
issuance of €3,500 million maturing in 2025, the new 10 year benchmark and the
Treasury bond issuance of €2,000 million, maturing in 2045 which was the
Portuguese Republic’s issuance with the longest maturity;
CGD: joint lead manager and bookrunner for the €1,000 million covered bonds
issuance maturing in 2022;
REN: joint lead manager and bookrunner for the €300 million notes issuance
maturing in 2025;
NOS: joint lead manager and bookrunner for the €150 million bond issuance
maturing in 2022;
Altri/Celbi: organisation and lead of a €35 million bond issuance maturing in 2021;
Bank of America: co-lead manager for a €750 million notes issuance maturing in
2025.
CaixaBI also organised and led seven new commercial paper programmes, particularly NOS
(€100 million), Portucel (€100 million), Secil (€50 million), RAR/Colep (€23.5 million) and
Barraqueiro Group (€20 million) issuances.
OPERATING SEGMENTSCGD CONSOLIDATED OPERATIONS AT 31 MARCH 2015 21
Equity Capital Market
In 1st quarter 2015, the Bank was the joint bookrunner for the disposal of an equity stake
held by José de Mello Energia, S.A. in EDP in the form of an accelerated bookbuilding
process. The referred to equity stake comprised a block of 73.2 million EDP shares, for 2.0%
of its share capital. This highly successful offer was oversubscribed and raised a total
amount of approximately €249.0 million.
Brokerage
According to data published by the CMVM for February 2015, CaixaBI/CGD brokered an
amount of €845 million in the domestic equities market, coming 2nd in the brokers’ ranking
with an accumulated market share of 12.8%.
Reference should be made to CaixaBI’s involvement in the following market operations:
José de Mello Energia: joint bookrunner in the accelerated bookbuilding process on
2% of EDP’s share capital.
Other operations: ABB on 22.5% of Havas and the Ecolslops and ELTE IPOs.
Financing and structuring area
CaixaBI’s performance as a liquidity provider remained positive with the Bank continuing to
operate on a collection of securities listed on Euronext Lisbon and with Euronext having
attributed its maximum “A” rating to CaixaBI for all securities and categories. Reference
should also be made to the Bank’s pioneering activity in the new segment created by
Euronext to stimulate the liquidity of retail investors in the form of the Retail Matching Facility. Maximum “A” rating
as a liquidity provider
Syndication and sales across all securities
(Euronext)
Reference should be made to CaixaBI’s participation in the following issuances:
Republic of Portugal: joint lead manager and bookrunner for the Treasury bond
issuance of €3,500 million maturing in 2025 and the Treasury bond issuance of
€2,000 million, maturing in 2045 and as a specialised securities trader, in the public
debt auctions taking place during the quarter.
CGD: joint lead manager and bookrunner for the €1,000 million covered bonds
issuance maturing in 2022;
REN: joint lead manager and bookrunner for the €300 million notes issuance
maturing in 2025;
NOS: joint lead manager and bookrunner for the €150 million bond issuance
maturing in 2022;
Bank of America: co-lead manager for a €750 million notes issuance maturing in
2025
CaixaBI was also responsible for 51 commercial paper issuances for an amount of €560
million.
Venture capital
64 projects were analysed and 21 approved. The approved projects comprised a potential
investment of approximately €106.4 million of which €2.1 million proceeded.
OPERATING SEGMENTS22 CONSOLIDATED OPERATIONS AT 31 MARCH 2015 CGD
2013
5 – Rating
Portuguese Republic’s and CGD’s ratings are as follows:
CGD Portugal
Short Long Short Long
Date Date
Term Term Term Term
Standard & Poor's B BB- 2014-11 B BB 2015-03
FitchRatings B BB+ 2015-02 B BB+ 2015-03
Moody's N/P Ba3 2015-03 N/P Ba1 2014-07
DBRS R-2 (mid) BBB (low) 2015-01 R-2 (mid) BBB (low) 2014-11
RATINGCGD CONSOLIDATED OPERATIONS AT 31 MARCH 2015 23
6 – Sustainability
CGD continues to make the investment in the future of current generations, of the national
economy and the planet as a source of essential resources, incorporating international best
practices in ethics, social and environmental responsibility, and acting in five key areas: Sustainability
responsible banking, promotion of the future, environment protection, engagement with programme –
operating areas:
stakeholders and human assets management.
- Responsible
A path started in 1880, with the express purpose of disseminating, promoting and banking
encouraging the spirit of economy and savings in less wealthy classes, that inspires our - Promotion of the
contribution to sustainability. future
- Protection of the
Member bank of United Nations programs: Global Compact and UNEP – Finance environment
Initiative - Involvement with
Pioneer in financial literacy, with the largest and most comprehensive program in stakeholders
this context: Saldo Positivo - Human assets
management
1st Portuguese Bank with an environmental management system and ISO 14001
certification
Only Iberian bank leading the climate change combat, promoting the green economy
and low-carbon (A +) – Carbon Disclosure Project
Only Iberian bank in Carbon Disclosure Index Performance – Carbon Disclosure CGD – 1st
Project Portuguese bank
with an
Promoter of youth volunteering through the educational program Young Volunteam
environmental
in Portuguese high schools management system
With the largest private group of blood donors in Portugal certified to ISO
14001
CGD is the bank with the highest brand Reputation in Portugal and also maintains the
leadership in key brand indicators, with emphasis on the aspects of image and brand values
- Trusted and Solid Brand - and corporate image, the latter affecting the following variables:
Relevance in its sector Caixa leads the
Social and environmental responsibility banking reputation
ranking in Portugal
Support strategic sectors of the economy
Sustainability
Relevance to universities / academy
Reference should be made to CGD’s lead of the banking reputation ranking in Portugal,
based on the Reputation Institute’s brand appraisal model in which reputation is defined and
quantified on the basis of consumers’ perception of 7 characteristics: products/services;
innovation; workplace; governance; citizenship; leadership; performance.
Caixa Geral de Depósitos
21 May 2015
SUSTAINABILITY24 CONSOLIDATED OPERATIONS AT 31 MARCH 2015 CGD
2013
7 - Consolidated Accounts
Balance Sheet at 31 de March 2015 (*)
(EUR million)
Change Change
2015-03 vs 2014-03 2015-03 vs 2014-12
Assets 2014-03 2014-12 2015-03 Total (%) Total (%)
Cash and cash equivalents with central banks 1,235 2,118 1,741 506 41.0% -377 -17.8%
Loans and advances to credit institutions 2,676 3,012 3,616 940 35.1% 604 20.1%
Loans and advances to customers 68,515 66,864 66,749 -1,766 -2.6% -115 -0.2%
Securities investments 18,271 18,972 19,163 893 4.9% 191 1.0%
Assets with repurchase agreement 1,138 1,281 1,314 176 15.4% 33 2.6%
Non-current assets held for sale 13,840 804 821 -13,019 -94.1% 17 2.1%
Investm. in subsid. and associated companies 43 319 297 254 591.4% -22 -6.8%
Intangible and tangible assets 822 828 839 17 2.1% 11 1.3%
Current tax assets 114 55 42 -72 -63.0% -13 -23.3%
Deferred tax assets 1,336 1,425 1,407 71 5.3% -18 -1.3%
Other assets 4,424 4,474 4,614 191 4.3% 140 3.1%
Total assets 112,413 100,152 100,605 -11,808 -10.5% 453 0.5%
Liabilities
Central banks' and credit institutions' resources 9,444 6,002 5,935 -3,509 -37.2% -67 -1.1%
Customer resources 66,517 71,134 70,026 3,509 5.3% -1,108 -1.6%
Financial liabilities 1,718 2,121 2,426 708 41.2% 305 14.4%
Debt securities 8,430 7,174 8,126 -304 -3.6% 952 13.3%
Non-current liabilities held for sale 11,842 2 2 -11,839 -100.0% 0 16.2%
Provisions 878 842 846 -32 -3.7% 4 0.5%
Subordinated liabilities 2,546 2,428 2,455 -91 -3.6% 27 1.1%
Other liabilities 3,876 3,956 4,009 133 3.4% 53 1.3%
Sub-total 105,251 93,659 93,825 -11,426 -10.9% 166 0.2%
Shareholders' equity 7,162 6,493 6,779 -383 -5.3% 287 4.4%
Total 112,413 100,152 100,605 -11,808 -10.5% 453 0.5%
(*) The amounts for March 2014 have been restated to reflect the application of IFRS 10 which led to the inclusion of IMOBCI in the consolidation perimeter by the
full consolidation method; non-controlling interests in open-ended investment funds, included in the consolidation, were reclassified to other liabilities and other
income from financial operations.
CONSOLIDATED ACCOUNTSCGD CONSOLIDATED OPERATIONS AT 31 MARCH 2015 25
Income Statement at 31 de March 2015 (*)
(EUR thousand)
Change
2014-03 2015-03 Total (%)
Interest and similar income 876,010 774,884 -101,126 -11.5%
Interest and similar costs 643,794 518,185 -125,609 -19.5%
Net interest income 232,216 256,700 24,484 10.5%
Income from equity instruments 5,458 17,928 12,469 228.4%
Net interest inc. incl. inc. from eq. investm. 237,674 274,627 36,953 15.5%
Income from services and commissions 161,691 157,960 -3,731 -2.3%
Costs of services and commissions 35,187 31,646 -3,541 -10.1%
Commissions (net) 126,504 126,314 -190 -0.2%
Income from financial operations 118,812 93,966 -24,846 -20.9%
Other net operating income 544 2,080 1,536 282.4%
Non-interest income 245,859 222,360 -23,500 -9.6%
Net operating income 483,533 496,987 13,454 2.8%
Employee costs 174,704 188,001 13,297 7.6%
Other administrative expenses 100,480 106,577 6,097 6.1%
Depreciation and amortisation 26,344 26,705 361 1.4%
Operating costs and depreciation 301,527 321,283 19,756 6.6%
Gross operating income 182,006 175,704 -6,302 -3.5%
Provisions and impairment of other assets (net) 3,348 41,481 38,133 1138.9%
Credit impairment net of reversals 168,544 71,370 -97,174 -57.7%
Provisions and impairment 171,892 112,851 -59,042 -34.3%
Income from subsidiaries held for sale 39,031 -307 -39,337 -100.8%
Income from associated companies 1,764 2,829 1,065 60.4%
Inc. before tax and non-controlling interest 50,908 65,375 14,467 28.4%
Tax 18,109 54,407 36,297 200.4%
Current and deferred 10,816 46,890 36,074 333.5%
Extraordinary contrib. on the banking sector 7,293 7,517 223 3.1%
Consolidated net income for period 32,799 10,968 -21,830 -66.6%
of which:
Non-controlling interest 10,366 19,837 9,471 91.4%
Net income attrib. to CGD shareholder 22,432 -8,869 -31,301 -139.5%
(*) The amounts for March 2014 have been restated to reflect the application of IFRS 10 which led to the inclusion of IMOBCI
in the consolidation perimeter by the full consolidation method; non-controlling interests in open-ended investment funds,
included in the consolidation, were reclassified to other liabilities and other income from financial operations.
CONSOLIDATED ACCOUNTSYou can also read