SIME DARBY BERHAD Investor Presentation - November 2017
←
→
Page content transcription
If your browser does not render page correctly, please read the page content below
SIME DARBY BERHAD
Investor Presentation
November 2017
Disclaimer
   This document is strictly confidential to the recipient. It is being supplied to you solely for your information and may not be reproduced, redistributed or passed
   on, directly or indirectly, to any other person or published, in whole or in part, for any purpose. Upon request, you shall promptly return this document all
   other information made available in connection with this document, without retaining any copies. The distribution of this document in other jurisdictions may
   be restricted by law, and persons into whose possession this document comes should inform themselves about, and observe, any such restrictions.

   This document does not constitute and is not an offer or invitation to sell, or any solicitation of any offer to subscribe for or purchase any securities of any
   company referred to in this document in any jurisdiction. The companies referred to herein have not registered and do not intend to register any securities
   under the US Securities Act of 1933, as amended (the “Securities Act”), and any securities may not be offered or sold in the United States absent registration
   under the Securities Act or an exemption from registration under the Securities Act. By attending the presentation you will be deemed to represent, warrant
   and agree that to the extent that you purchase any securities in any of the companies referred to in the presentation, you either (i) are a “qualified
   institutional buyer” within the meaning of Rule 144A under the Securities Act, or (ii) you will do so in an “offshore transaction” within the meaning of
   Regulation S under the Securities Act.

   By attending this presentation and accepting a copy of this document, you represent and warrant that (i) you have read and agreed to comply with the
   contents of this notice; (ii) you will maintain absolute confidentiality regarding the information contained in this document including information presented
   orally or otherwise in accordance with your confidentiality obligation; and (iii) you are lawfully able to receive this document and attend this presentation
   under the laws of other jurisdiction in which you are subjected and other applicable laws.

   This document is for the purposes of information only and is not intended to form the basis of any investment decision. This presentation may contain forward-
   looking statements by Sime Darby Berhad that reflect management’s current expectations, beliefs, intentions or strategies regarding the future and
   assumptions in light of currently available information. These statements are based on various assumptions and made subject to a number of risks,
   uncertainties and contingencies and accordingly, actual results, performance or achievements may differ materially and significantly from those discussed in
   the forward-looking statements. Such statements are not and should not be construed as a representation, warranty or undertaking as to the future
   performance or achievements of Sime Darby Berhad and Sime Darby Berhad assumes no obligation or responsibility to update any such statements.

   No representation or warranty, express or implied, is given by or on behalf of Sime Darby Berhad or its related corporations (including without limitation, their
   respective shareholders, directors, officers, employees, agents, partners, associates and advisers) (collectively, the “Parties”) as to the quality, accuracy,
   reliability, fairness or completeness of the information contained in this presentation or its contents or any oral or written communication in connection with
   the contents contained in this presentation (collectively, the “Information”), or that reasonable care has been taken in compiling or preparing the
   Information. None of the Parties shall be liable or responsible for any budget, forecast or forward-looking statements or other projections of any nature or any
   opinion which may have been expressed or otherwise contained or referred to in the Information.

   The Information is and shall remain the exclusive property of Sime Darby Berhad and nothing herein shall give, or shall be construed as giving, to any
   recipient(s) or party any right, title, ownership, interest, license or any other right whatsoever in or to the Information herein. The recipient(s) acknowledges
   and agrees that this presentation and the Information are confidential and shall be held in complete confidence by the recipient(s).

   All the images, pictures and photos including design drawings in relation to the company’s property development projects contained in this document are artist
   impression only and are subject to variation, modifications and substitution as may be recommended by the company’s consultants and/or relevant authorities.

Strictly Private & Confidential                                                   1
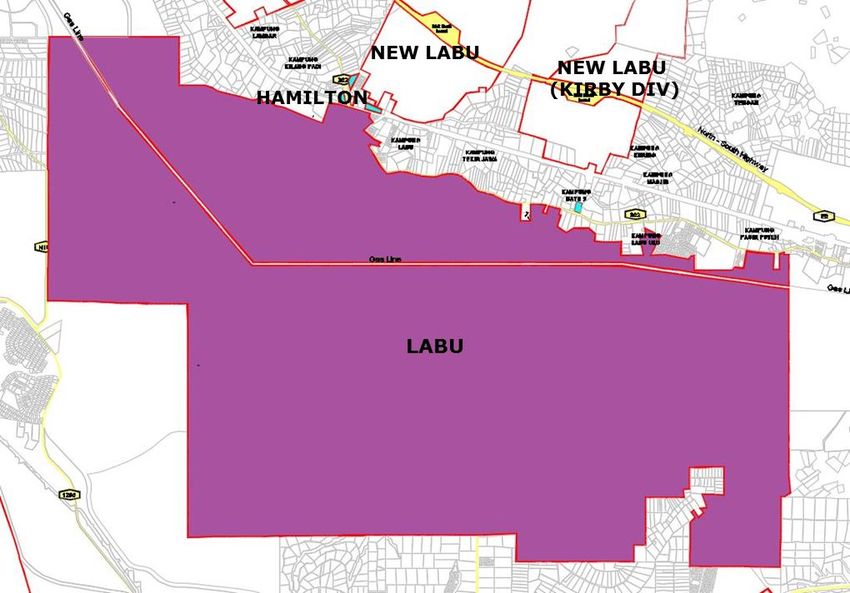
Table of Contents

 Section                              Page

  1.       Sime Darby Berhad           3

  2.       Motors Division             13

  3.       Industrial Division         21

  4.       Logistics Division          32

  5.       Others                      35

  6.       Appendices                  38

Strictly Private & Confidential   2

Sime Darby Berhad
 Company Overview

Strictly Private & Confidential   3
Sime Darby Berhad
    Who We Are at a Glance
                                                                                                                                                     Motors       Industrial     Logistics    Healthcare

                #2       BMW dealer globally

                #3       Caterpillar dealer globally

                                                                                                                        China
                4 ports & 2 water treatment plants                                                                                                     South Korea
                in China
                                                                                                                                 Macau
                                                                                                                                                        Hong Kong
                                                                                                                                            Taiwan
                6    hospitals in Malaysia & Indonesia
                                                                                                                Thailand                 Vietnam

                                                                                                                    Malaysia
               FY17 Financial Snapshot(3)                                                                                                          Brunei
                                                                                                                    Singapore
                                                                                      Maldives
            Revenue                             PBIT                                                                                                                       Papua New Guinea
            RM31,087 m                          RM784 m                                                             Indonesia
                                                                                                                                                                                Solomon Islands

            EBITDA                              PATAMI                                                     Christmas Island
            RM1,319 m                           RM615 m                                                                                                                          New Caledonia

                                                                                                                                                         Australia
                                               Shareholders’
            Total Assets                                                         18 Countries & Territories(1)
                                               Funds
            RM25,211 m
                                               RM14,995 m
                                                                                 20,233             Employees(2)
                                                                                                                                                                                New Zealand

Notes:
(1) Geographical footprint defined as locations in which Sime Darby Berhad has assets or employees, and includes JV’s operations (i.e. Ramsay Sime Darby Health Care operates
in Indonesia); (2) As at 30 June 2017. Excludes employees of Ramsay Sime Darby Healthcare; (3) Continuing operations only, refer to 2017 Annual Report for further details.
    Strictly Private & Confidential                                                                 4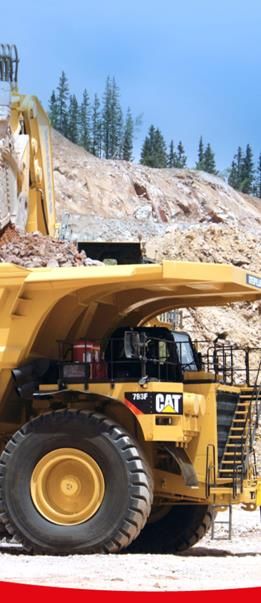
Sime Darby Berhad
Business overview
Motors Industrial Logistics Healthcare
Retail, distribution and assembly Comprehensive range of equipment Ports & Logistics and Water 50:50 JV with Ramsay Healthcare
businesses and services i.e. new and used Management in Shandong, Eastern for the management of hospitals
Presence in 10 countries & machine and engine sales, rental China and provision of healthcare
territories across APAC, over 40 and full range of product support Entered Shandong in 2005 and is services
years experience services currently the largest multi-purpose
Network of more than 109 port in Yellow Delta River, (FY17; RM mm)
Represents 31 brands, ranging
from luxury brands (e.g. BMW, branches throughout APAC Shandong
Porsche, Rolls Royce) to mass Balanced sectoral exposure in Weifang Port – dry bulk, break 682 682
market brands (e.g. Ford, mining, construction, forestry, bulk, liquid bulk, general cargo &
Hyundai), as well as trucking marine and energy container (2)
Assets Invested
names (e.g. Hino and Mack) Also provides comprehensive range Jining Ports (3 ports) – Stevedoring Capital
BMW dealer since 1972 and is the of industrial solutions via Allied & storage services for coal & coal
second largest BMW dealer group Brands and Energy Solutions related products
globally CAT dealer since 1929 and is the Water treatment plants (2 plants) – Others
third largest CAT dealer globally supplies clean water to residential,
commercial and industrial users in
the BEDA area(1)
(FY17; RM mm) (FY17; RM mm) (FY17; RM mm)
10,127 MALAYSIA VISION VALLEY
20,602 PBIT Margin
PBIT Margin PBIT Margin
303 21.1%
633 3.1% (4)
2.5%(4)
253 12% stake in Eastern & Oriental
64
Owns c.8,800 acres of land in the
Malaysia Vision Valley region and 4
Revenue PBIT Revenue PBIT Revenue PBIT corporate towers in Ara Damansara
(3) (3) (3)
ROAIC ROAIC ROAIC
9,355 10.9% 11,391 3.2%(1) 2.9% 30% stake in Tesco Malaysia
8,089 2,694
5,826 2,294 Provision of shared services to all
Sime Darby pure plays
Insurance broking services in
Assets Invested
(2)
Assets Invested (2)
Assets Invested
(2)
Malaysia, Singapore and Hong Kong
Capital Capital Capital Holder of SIME DARBY trademarks
Notes: (1) BEDA - Binhai Economic-Technological Development Area (2) Invested capital is total assets (excluding tax
assets and intercompany balances) less operating liabilities (i.e. all liabilities except borrowings, intercompany balances,
Strictly Private & Confidential 5 leases and tax liabilities (3) ROAIC is PBIT divided by average invested capital (4) Excludes impairments and provisions of
RM257mn related to Bucyrus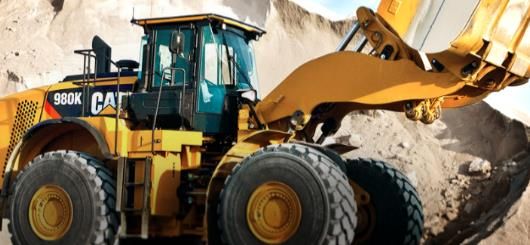
Sime Darby Berhad
Group FY2017 Financials
   (FYE June; RM mm)

Total Revenue                                                                                                        Capital Structure(1)

              By Segment                                     By Geography                                                                             Debt/Equity: 20.8%
Logistics, 1%                  Others, 0%                          Others,                                                      15,370
                                                                     0%                                                                            375
                                                Australasia(2),
                                                    29%                     Malaysia,
                                                                              15%
      Industrial,                                                                                                                14,995
         33%                                                                                                                                                   3,194
                                                                                                                                                                                             2,072
                                                                                                 SEA (excl.
                                                                                                                                                               1,948
                                                                                                M'sia), 18%                                                    1,246
                                                                                                                                 Equity                         Debt                         Cash
                     Motors,                                                                                                    Shareholders' Funds                  Non-controlling Interests
                      66%                                           China(2),
                                                                     38%                                                        Long Term Borrowings                 Short Term Borrowings

                                                                                                                                Bank Balances, Deposits & Cash
                             Revenue: RM31,087 mm

Adjusted EBITDA(5) & Adjusted PBIT(6) (By Segment)                                                                   Total Borrowings (By maturity)

          Adjusted EBITDA                                     Adjusted PBIT                                                                Total borrowings: RM 3,191 mm(4)
         Others,                                               Others,
           3%                                                    8%                                                           1,944
Logistics,                                        Logistics,
                          Motors,                    6%                        Motors
   7%
                           51%                                                  62%

                                                                                                                                                                                                  757
                                                      Industrial,
                                                         24%                                                                                          302
                                                                                                                                                                            188
        Industrial
          39%
                                                                                                                            < 1 year              1-2 years             2-5 years             > 5 years

    Adj. EBITDA: RM1,613 mm                                Adj. PBIT: RM1,078 mm
 Notes:
 (1) Excludes Net Assets of discontinuing operations; (2) China consists of China, Hong Kong, Macau & Taiwan; (3) Australasia consists of Australia, New Caledonia, New Zealand, Papua New Guinea & Solomon Islands;
 (4) Excludes interest of RM 3 mm; (5) Based on segment results. RM1,319m FY2017 EBITDA adjusted for Bucyrus impairment and provision (RM257mn) and BMW Vietnam impairment and provisions (RM37mn); (6) Based on
 segment results. Adjustments same as for EBITDA.
Strictly Private & Confidential                                                                            6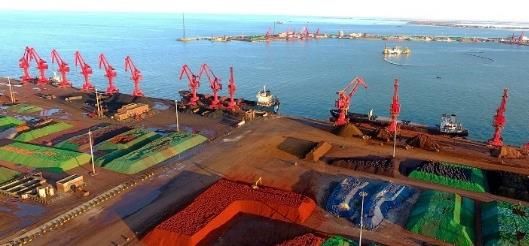
Segmental Financials
Core businesses of Motors and Industrial provide the highest ROAIC
Historical ROAIC (FY17 ROAIC vs 10-year and 5-year average)
By Segment
Core businesses: Notwithstanding
FY17
16% Industrial’s performance in FY2017,
10-year average
13% 5-year average the Motors and Industrial core
12%
11% businesses provide the highest ROAIC
8%
for Sime Darby Berhad
6%
5% 4% 5%
(1)
3% 3% 3%
Logistics’ and Healthcare’s ROAIC are
significantly lower
Industrial Motors Logistics Healthcare
Invested Capital as at 30 June 2017
By Segment
8,089 Others, 2%
Healthcare,
4%
5,826
Logistics,
13%
Industrial,
2,294 47%
682 415 Motors
34%
Industrial Motors Logistics Healthcare Others
Total Invested Capital: RM17,306 mm
Note:
(1) Excludes impairments and provisions of RM257mn related to Bucyrus
Strictly Private & Confidential 7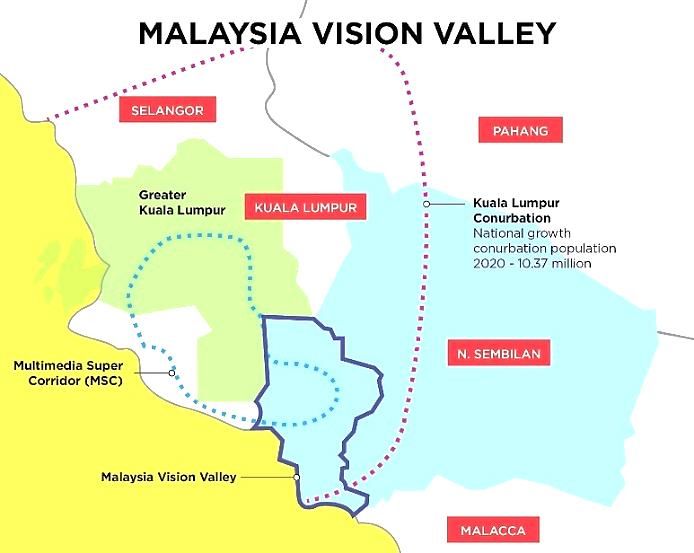
Segmental Financials
Motors: Stable performance; Industrial: Cycle has bottomed out
Revenue (RM bn) PBIT (RM mn) ROAIC (%) Commentaries
FY17: RM20.6bn FY17: RM633mn FY17: 11%
Motors achieved its
highest ever revenue
in a decade on the back
10-year 10-year 503 10-year of organic and
15.0 13%
average average average inorganic expansion
Motors
Profits have recovered
5-year 5-year 5-year despite adverse
18.7 591 12%
average average average market conditions in
key markets like Malaysia
(currency depreciation &
10-year 10-year 10-year
711 21% GST), Singapore (COE
high 20.6 high high
limits) and China (cooling
economy)
FY17: RM10.1bn FY17: RM253mn(1) FY17: 3%(1)
Industrial has been hit by
cooling demand for
10-year 10.6
10-year 10-year coking coal and low crude
843 16%
average average average oil prices
Industrial
However, FY17 revenue
5-year 5-year 5-year increased for the first
average 11.5 average 703 average 8% time after 3 consecutive
years of decline which
gives hope that the cycle
10-year 10-year 10-year may have bottomed out
high 14.4 high 1,396 high 25%
Note:
(1) Excludes impairments and provisions of RM257mn related to Bucyrus
Strictly Private & Confidential 8
The New Sime Darby Berhad
What’s different?

                       FOCUSED            LEAN                  AGILE

           • Focus on core         • HQ: Small GHO(1),    • Single-tier board
             trading model           reduced staff from     structure
           • Footprint across        450 to c.70          • Greater
             Asia Pacific          • Operations:            decentralisation to
             growth region           Continued              business units
                                     operational right-
                                     sizing

Note: (1) GHO: Group Head Office
Strictly Private & Confidential             9
The New Sime Darby Berhad
Value creation: Delivering returns and growth
To be the leading Motors & Industrial
multi-national in Asia Pacific
RATIONALISING
OPERATIONAL ACCELERATING
NON-CORE
EXCELLENCE GROWTH
BUSINESSES
• Optimise cost • New markets and • Re-deploy capital
structure new brands towards our core
• Strengthen • Complementary businesses and key
resilience to down adjacencies projects
cycles • Strategic M&A /
Joint Ventures
Strictly Private & Confidential 10 Sime Darby BerhadThe New Sime Darby Berhad
Well-positioned to tap on Asia Pacific’s growth
Proven Trading and Long-standing Partnership
Services Business Model with Established Brands
Resilient ROAIC for the past 10 years(1) SINCE SINCE
despite challenging business conditions
1929 1972
Balanced Portfolio Tapping on Asia’s Growing
Exposure Affluence
Mass Market Segment
Average Annual GDP Growth
Luxury Segment of Asian countries(2)
Vietnam 6.5
Mining
China 6.4
Construction
Indonesia 5.3
Forestry Asia Pacific 4.8
Marine Malaysia 4.6
Energy Thailand 3.5
Well-positioned for World 3.3
Assembly (Motors only) New Zealand 2.8
New Equipment/
Commodity Upcycle Australia 2.7
Hong Kong 2.5
Vehicle Sales
Singapore 2.4
After-sales/
Parts & Services
Industrial stands to
benefit from increased
22% Taiwan 2.2
Coal % of world energy
demand for coal Geographies with current presence
Rental & Used consumption by 2040(3)
Regional growth rates
(1) FY2008-FY2017; (2) Bloomberg’s Forecasted Average Annual GDP Growth YoY% (2017-2019) – as at 9 June 2017; (3) Source: Wood Mackenzie
Strictly Private & Confidential 11Qualified & Experienced Management Team
Jeffri Salim Davidson Dato’ Lawrence Lee Cheow Hock
Group Chief Executive Officer Managing Director, Sime Darby Motors
Appointed Deputy Group CFO in 2016 and previously Senior Appointed as Managing Director of Motors Division since 2007
Vice President of Industrial Division (China, Singapore & 27 years of experience in the automotive industry in the Asia
Power Systems) Pacific region, and leads Sime Darby Motors, a major player
Held various senior leadership positions in Sime Darby Berhad in the Asia Pacific automotive industry with presence in 10
including the Finance Director of Tractors Malaysia Sdn Bhd countries
and Managing Director of China Engineers Limited He is a Fellow of the ICAEW, and a member of the Malaysian
Holds a BSc in Geology from University College London Institute of Accountants
(United Kingdom), and a Chartered Accountant (ICAEW) by
profession
Mustamir Mohamad Scott William Cameron
Group Chief Financial Officer Managing Director, Sime Darby Industrial
Appointed as Head of Group Finance for Sime Darby Group in Appointed as Managing Director of Industrial Division in 2007
2014 25 years of experience in the Caterpillar family. Began his
Previously served in various senior positions in Sime Darby, career with Price Waterhouse in Brisbane, Sydney and New
including Head of Strategy & Business Development in Sime York before joining Hastings Deering (Australia) Limited as
Darby Plantation; Head of EVP Office, Sime Darby Plantation; the Finance Director in 1992. Currently the Dealer Principal of
and Senior Manager of Value Management in Group Strategy, the Hastings Deering Group
Sime Darby Berhad Holds a degree in Commerce from University of Queensland.
He holds a degree in Accounting and Finance from the London He is a Fellow of the Institute of Chartered Accountants in
School of Economics and Political Science, is a Fellow of Australia and a Fellow of the Australian Institute of Company
ICAEW and a member of the Malaysian Institute of Directors
Accountants (MIA)
Datuk Thomas Leong Yew Hong Timothy Lee Chi Tim
Group Chief Strategy Officer Managing Director, Sime Darby Logistics
Appointed as Head of Strategy and Corporate Finance for Appointed as Managing Director of Logistic Division in 2011
Sime Darby Group in 2016 Over 20 years of operational experience in the ports and
Previously Executive Vice President of Maybank’s Group container terminal management industry in Hong Kong
Strategy & Business Development and has held senior Previously the Operations Manager of the Hong Kong
positions in Accenture and Deloitte Consulting, based in Business Unit for Modern Terminals Limited (the second
Australia, Hong Kong and Malaysia largest port operator in Hong Kong) prior to joining Sime
Holds a BSc in Software Engineering from Australian National Darby
University, and an MBA (International Corporate Finance)
from University of Sydney
Strictly Private & Confidential 12Motors Division Strictly Private & Confidential 13
History & Key Milestones
Solid Track Record Across 10 Markets in the Asia Pacific Region
BMW (HK & Macau) New Zealand Malaysia & China Vietnam, Taiwan,
1972
1998
2010
2013
Acquired the sole importer Acquired 80% of Appointed distributor & Malaysia, Australia
and distributor of BMW cars Continental Car retailer of Porsche in Acquired official BMW &
& motorcycles in HK & Services Ltd i.e. Malaysia Mini importer & distributor
Macau multi-franchise Added the Lamborghini for Vietnam
dealership based marque to its retail Appointed sole distributor
in Auckland business in China for Kia in Taiwan
Commenced assembly of
Mazda vehicles in Inokom
for export to Thailand
JV with Ford BMW (Malaysia) Trucks (New Rolls Royce Macau, Acquired BMW Brisbane,
1981
1987
2004
2012
to distribute Ford Appointed Zealand) Porsche Sydney Australia
vehicles in authorised sole Investment in the Rolls Royce Macau
Malaysia importer & truck business in dealership commenced
distributor of New Zealand (Mack, operations
BMW in Malaysia Renault & Hino) Acquired Porsche
Sydney
Entered hire & drive Peugeot Fiat & Alfa Romeo
2017
1982
2001
business Motors Hyundai Malaysia (Australia)
through the Hertz Appointed Addition of Fiat & Alfa
2005
Acquired Hyundai
franchise for Malaysia distributor of business and Inokom Romeo dealerships in
and Brunei Peugeot Motors assembly facility in Australia
in Australia & Malaysia
New Zealand
BMW (Singapore) BMW (Singapore) Jaguar & Land Rover
2014
1979
1997
Obtained dealership Won the BMW AG (Malaysia), Ferrari
rights of BMW cars & award for achieving (Brisbane)
motorcycles in the highest BMW Obtained sole
Singapore sales worldwide distributorship of Jaguar &
Land Rover in Malaysia
Added Ferrari to Brisbane,
Australia
Source: Company website
Strictly Private & Confidential 14Sime Darby Motors
We represent strong luxury and mass market brands across APAC
Malaysia Singapore Thailand Australia New Zealand Hong Kong Macau China
China Taiwan
Distributor Distributor Dealer Dealer Distributor Distributor Distributor Dealer Distributor
& Dealer & Dealer & Dealer & Dealer & Dealer & Dealer
Assembly
Dealer
Assembly
(Inokom)
Rental Rental Rental
Source: Corporate Presentation, Company website
Strictly Private & Confidential 15Sime Darby Motors
Focused on Expansion in Asia Pacific
HK & Macau
Taiwan
China
No. 2 BMW Dealer Globally
Expand aftersales and
used car business
Thailand
Malaysia
Invest in new dealerships
and acquire dealership
groups
Expand assembly Singapore
capabilities
Australia
New Zealand
Current Presence
Dealership/distributorship
Assembly
Strictly Private & Confidential 16Sime Darby Motors
The Growth Strategy Moving Forward
IV
III
Mergers &
acquisitions
II
New marques &
markets
Objectives I
Expand along ▪ Accelerate growth
value chain
and achieve
Strengthening ▪ Expand dealerships economies of scale
the core into new markets or
represent new
▪ Capture value-
marques
added services
beyond new car
sales
▪ Organic market ▪ Grow car assembly ▪ Expand commercial ▪ Explore
growth business through vehicle franchises acquisition of
▪ Expand aftersales partnerships with ▪ Represent new dealership
Levers and grow used car manufacturers brands in the Asia groups
business Pacific
Strictly Private & Confidential 17 Sime Darby BerhadSime Darby Motors
Key Financial Highlights
Revenue (RM mm) PBIT (RM mm)
Record sales of the trucking business across all brands in Impacted by GST in Stronger contributions
NZ, higher sales volume in China and increased COE quota Malaysia and government from Malaysia and
& timely launches of new BMW models in Singapore policy in China China operations
702 711
20,602
633 635 633
18,646 19,155
17,745
16,597 17,266
503
14,818 474
386
10,098
7,926 7,510
164 184
FY2008 FY2009 FY2010 FY2011 FY2012 FY2013 FY2014 FY2015 FY2016 FY2017 FY2008 FY2009 FY2010 FY2011 FY2012 FY2013 FY2014 FY2015 FY2016 FY2017
Invested Capital(1) (RM mm) ROAIC(2) (%)
Reduction in working capital - inventories,
receivables and cash balances
Increase in working capital and 6,431
6,086 21.2%
acquisition of BMW Brisbane and 5,755 5,826 20.2%
18.3%
Vietnam
4,033 14.1%
3,738 12.6%
3,226 10.9%
2,602 2,720 2,743 8.3%
6.9% 7.6%
6.6%
FY2008 FY2009 FY2010 FY2011 FY2012 FY2013 FY2014 FY2015 FY2016 FY2017 FY2008 FY2009 FY2010 FY2011 FY2012 FY2013 FY2014 FY2015 FY2016 FY2017
Notes:
(1) Invested capital is calculated as total assets (excluding tax assets and intercompany balances) less operating liabilities (i.e. all liabilities except borrowings, intercompany balances, leases and tax liabilities
(2) ROAIC is calculated as PBIT divided by average invested capital
Strictly Private & Confidential 18Sime Darby Motors
Units Sold, Revenue & PBIT by Region (1/2)
FY17 Sales Contribution Reported Revenue & PBIT
Marques Units Sold
& Units Sold (RM mm)
Malaysia 7.3% 4.7% 2.6% 6.2%
333
204 223
Malaysia, 31,230
17% 26,607 87
Malaysia
4,563 4,323
18,571 17,663 3,573
3,385
2014 2015 2016 2017 2014 2015 2016 2017
Units sold: 17,663
Revenue PBIT PBIT Margin
SEA (Excl. M’sia) 1.0% 0.8% 4.3% 1.5%
18,693 192
SEA (excl. Malaysia)
16,396
75 (1)
SEA (excl. 34 28
M'sia), 24% 12,623 12,696
5,026
4,516
3,334 3,353
2014 2015 2016 2017
2014 2015 2016 2017
Units sold: 18,693 Revenue PBIT PBIT Margin
Note:
(1) includes a goodwill impairment of RM19 mm and provision on inventories of RM18 mm in Vietnam
Source: Audited accounts, Corporate presentation
Strictly Private & Confidential 19Sime Darby Motors
Units Sold, Revenue & PBIT by Region (2/2)
FY17 Sales Contribution Reported Revenue & PBIT
Marques Units Sold
& Units Sold (RM mm)
China / HK / 3.5% 1.6% 1.7% 2.7%
Macau / Taiwan
250 231
124 134
China/HK/Macau, 33,915 34,293 8,549
41% 31,827 7,984
East Asia
31,596 7,758
7,227
2014 2015 2016 2017 2014 2015 2016 2017
Units sold: 34,293
Revenue PBIT PBIT Margin
Australia / New
0.7% 3.7% 2.8% 3.0%
Zealand
Australia / New Zealand
18,060 118
104
16,663 16,266 90
Australia/
NZ, 17% 13,325
18 3,454
3,212 3,270
2,622
2014 2015 2016 2017 2014 2015 2016 2017
Units sold: 13,325 Revenue PBIT PBIT Margin
Source: Audited accounts, Corporate presentation
Strictly Private & Confidential 20Industrial Division Strictly Private & Confidential 21
History & Key Milestones
Long-standing Partnership with Caterpillar Since 1929

          Sime Darby & Co                                             China Engineers Ltd
          (Kumpulan Sime Darby                                        became a subsidiary of the group
  1910

                                                             1972
          Bhd) established in
          Malacca, Malaysia

                                   Tractors dealerships                                Hastings Deering                               USD8.8 bn acquisition of Bucyrus by
                                                                                                                                      Caterpillar. Hastings Deering became the
                            1957

                                                                                1992

                                                                                                                               2011
                                   extended to                                         Acquired Hastings Deering
                                   Peninsular Malaysia,                                Group, Caterpillar dealer in                   first Caterpillar dealer in the world to sell,
                                   Singapore, Brunei and                               Australia (Queensland and                      service and support the new range of
                                   Christmas Island                                    Northern Territory), Papua New                 Caterpillar underground and surface mining
                                                                                       Guinea and Solomon Islands                     equipment

                                          Tractors Singapore was                                         Caltrac                                 Partnership with ENGIE
                                          established in Singapore.                                      Hastings Deering acquired               Partnership agreement with
                                   1964

                                                                                                  2000

                                                                                                                                          2017
                                                                                                         Caltrac, the Caterpillar                ENGIE to (i) develop solar
                                                                                                         dealer in New Caledonia                 energy, and (ii) integrated
                                                                                                                                                 facilities management services
                                                                                                                                                 in Malaysia.

                CAT (Malaysia)                                               Tractors Malaysia began its
         1929

                                                                      1984

                Sime Darby, through Sarawak                                  manufacturing and assembly
                Trading Company was appointed as                             operations
                a Caterpillar dealer for Sarawak.

Strictly Private & Confidential                                                              22
Sime Darby Industrial
Strong brands and comprehensive market reach throughout APAC
Energy Solutions
CAT Dealer Operations Allied Brands Group
Group
Malaysia
Malaysia, Brunei (via JV with Hong Kong &
Kubota Corp & Macau, China
Marubeni Corp)
Singapore, Maldives, Christmas Island Asia Pacific
region Hong Kong &
(JV with Terberg Macau
Benschop)
Hong Kong, Macau
Malaysia,
Christmas Island Mecomb Group:
Southeast China (Province of Guangdong, Guangxi, China
(Indian Ocean), Singapore, Malaysia
Hainan, Fujian, Hunan, Jiangxi) and Xinjiang
Singapore and Thailand
Australia (Queensland & Northern Territory), PNG
& SI
Malaysia Australia
New Caledonia
Malaysia, Hong Engineering &
Australia,
Kong, Macau, Technical Services:
China &
China, South Malaysia
Malaysia
Korea
Singapore Vietnam
Christmas
Australia, Island (Indian
Malaysia & Ocean),
Singapore Singapore,
Maldives
Strictly Private & Confidential 23Regional Presence Across 17 Countries and
Territories, Supported by a Network of Branches
Principal activities
Xinjiang
– Sale, rental and used equipment of Caterpillar
South Korea
Hunan equipment and engine
Jiangxi
Fujian – Sale of parts, service maintenance, equipment
CHINA/HK Guangdong
Guangxi monitoring system and technology equipment's
Hainan
Regional presence: 14 countries & territories(1)
Macau/HK No. of branches: 109(2)
VIETNAM Orderbook: RM2.4 bn (as at 30 September 2017)
Total no. of employees: 7,875 (as at 30 June 2017)
MALAYSIA
BRUNEI
MALDIVES
SINGAPORE PAPUA NEW GUINEA
Regional No. of Construc- Power
SOLOMON industry branches Forestry Mining Quarry
CHRISTMAS ISLAND (1) tion Systems
ISLANDS presence
Northern Territory NEW
CALEDONIA
Queensland
China &
HK, Macau
63
AUSTRALIA
23
South East
Asia
(4 depot & 7
CAT rental
stores)
LEGEND
China / HK / Macau / South Korea
Australasia 23
Malaysia
South East Asia
Australia and Pacific Islands
Note: (1) Regional presence defined as locations in which Sime Darby Industrial has assets or employees; (2) Refers to Caterpillar branches only
Strictly Private & Confidential 24Sime Darby Industrial
Key Industry Highlights
Queensland Hard Coking Coal FOB (USD/tonne)
Metallurgical coal prices have
400
stabilised around 350
USD200/tonne vs. average FOB
US/t FOB QLD
300
cost for Queensland producers of 250
USD100/tonne. 200
150
The return to profitability has 100
sparked renewed capital 50
investment by BHP Billiton and 0
Q1/10
Q2/10
Q3/10
Q4/10
Q1/11
Q2/11
Q3/11
Q4/11
Q1/12
Q2/12
Q3/12
Q4/12
Q1/13
Q2/13
Q3/13
Q4/13
Q1/14
Q2/14
Q3/14
Q4/14
Q1/15
Q2/15
Q3/15
Q4/15
Q1/16
Q2/16
Q3/16
Q4/16
Q1/17
Q2/17
Q3/17
Adani in Australia.
Coal will continue to remain
relevant as a source of power in
the next two decades.
Utilisation is projected to remain
constant at 10 trillion
kilowatthours, ~30% of fuel
requirements.
Source : EIA International Energy Outlook 2016
Strictly Private & Confidential 25Sime Darby Industrial
The Growth Strategy Moving Forward
IV
III
Grow new
businesses
II
Organic growth
Objectives I ▪ Develop new business
Operational
pillars that are
excellence complementary or
adjacent to the core
Strengthening ▪ Capture value-added
the core services beyond new ▪ Expand dealerships into
equipment sales new markets or
▪ World Class represent new marques
performance
▪ Deliver additional
3% sales margin
▪ Recovery after four ▪ Microsoft - Leverage ▪ Expand rental and ▪ Negotiate with
successive years of technology to recut used equipment Principals to acquire
market contraction business processes and capability in Asia additional
▪ Grow market leadership reduce working capital by ▪ Deploy customer territories – CAT,
for sales, spare parts, 2 months technology as a Kubota, New Holland,
Levers services and solutions ▪ 6 Sigma – Reduce competitive Terberg
transaction cost e.g. credit differentiator ▪ Explore new range of
control, logistics & freight allied products and
▪ Procurement – energy solutions
renegotiate terms services
Strictly Private & Confidential 26Sime Darby Industrial
Key Financial Highlights
Revenue (RM mm) PBIT (RM mm)
14,429 1,396
13,575 1,331
12,073
10,962 1,106
10,637 1,039
9,946 10,127
8,645 898
8,210 793
7,629 725
552
341
253
(3)
FY2008 FY2009 FY2010 FY2011 FY2012 FY2013 FY2014 FY2015 FY2016 FY2017 FY2008 FY2009 FY2010 FY2011 FY2012 FY2013 FY2014 FY2015 FY2016 FY2017
Invested Capital(1) (RM mm) ROAIC(2) (%)
Acquisition of Bucyrus 7,908 7,903 7,828 8,089 25.3%
7,788 7,670 24.3% 23.9%
business for c.RM1.2bn
21.4%
20.2%
5,156 16.8%
4,251 13.2%
3,601
3,255
7.1%
4.3%
3.2%
(3)
FY2008 FY2009 FY2010 FY2011 FY2012 FY2013 FY2014 FY2015 FY2016 FY2017 FY2008 FY2009 FY2010 FY2011 FY2012 FY2013 FY2014 FY2015 FY2016 FY2017
Note:
(1) Invested capital is calculated as total assets (excluding tax assets and intercompany balances) less operating liabilities (i.e. all liabilities except borrowings, intercompany balances, leases and tax liabilities
(2) ROAIC is calculated as PBIT divided by invested capital
(3) Excludes impairments and provisions of RM257mn related to Bucyrus
Strictly Private & Confidential 27Sime Darby Industrial
Product support revenue increases significantly during industry down cycle
FY17 Revenue by segment vs FY12
FY12 Total Revenue: RM13,575 mm FY17 Total Revenue: RM10,127 mm
Allied Business, 5% Allied Business, 5% Energy Solutions,
Energy Solutions,
4%
3%
Power Systems, 8% Power Systems, 6%
Service, 14% Equipment, 37%
Service, 13%
Equipment, 50%
Parts
21% Parts
34%
FY12: During the mining boom, sales of FY17: Currently, at the bottom of the cycle,
new equipment was the main revenue revenue from product support has
driver at 52%, with product support increased significantly to 47% (34%
contributing 35% (22% parts and 13% parts and 14% service), while new
service). equipment sales is lower at 37%.
Strictly Private & Confidential 28Sime Darby Industrial
Revenue & PBIT by Region (1/2)
FY17 Sales Contribution &
Products / Services Revenue (RM mm) PBIT (RM mm)
YoY Orderbook
FY17 Sales Contribution CAT New Equipment &
Engines 11.6% 8.5% 5.2% 4.4%
Malaysia, 11% 1,423
150
1,230
Excavators Dozers 1,099
Malaysia
993 104
Forest machine Lift trucks
52 48
Orderbook
Rental & Used Equipment
266
190 Parts & Services
2014 2015 2016 2017
Allied Solutions
2014 2015 2016 2017
Energy Solutions PBIT Margin
30 Sep 2016 30 Sep 2017
FY17 Sales Contribution CAT New Equipment &
Engines 22.9% 12.8% 11.2% 4.6%
Southeast Asia (excluding
SEA (excl. M'sia)
7% 1,205
1,146 237
1,020
Excavators Wheel loaders
Malaysia)
737
144
114
Marine engines
Orderbook
Rental & Used Equipment 34
299 322
Parts & Services
2014 2015 2016 2017 2014 2015 2016 2017
PBIT Margin
30 Sep 2016 30 Sep 2017
Note:
(1) Orderbook as at Aug 2017
Strictly Private & Confidential 29Sime Darby Industrial
Revenue & PBIT by Region (2/2)
FY17 Sales Contribution &
Products / Services Revenue (RM mm) PBIT (RM mm)
YoY Orderbook
FY17 Sales Contribution CAT New Equipment &
Engines 5.5% 4.7% 3.9% 3.5%
China / HK /
Macau, 27%
142
China, HK & Macau
2,691
2,610 2,605
Excavators Dozers 112
2,401 102
93
Wheel loaders Marine engines
Orderbook
Rental & Used Equipment
418
355 Parts & Services
2014 2015 2016 2017 2014 2015 2016 2017
PBIT Margin
30 Sep 2016 30 Sep 2017
FY17 Sales Contribution CAT New Equipment &
Engines 7.4% 3.1% 1.4% 4.5%
Australia & Pacific Islands
Australia & Pacific
Islands, 55%
6,894 510
6,126
Large mining Underground 5,600
5,328
trucks mining loaders
253
192
Orderbook Hydraulic Dozers
mining shovels 73
1,247
Rental & Used Equipment
329
Parts & Services 2014 2015 2016 2017 2014 2015 2016 2017 (2)
30 Sep 2016 30 Sep 2017 PBIT Margin
Note:
(1) Orderbook as at Aug 2017
(2) Excludes impairments and provisions of RM257mn related to Bucyrus
Strictly Private & Confidential 30Sime Darby Industrial
Safety & Health Performance
Lost Time Injury Frequency Rate
Incidents per million
man-hours worked
3.3 3.4
52% reduction
2.7 in incidents
2.5
1.6
FY2013 FY2014 FY2015 FY2016 FY2017
Industrial Division is focused on embedding the belief that all incidents are preventable.
The combination of the values in the “Visible Felt Leadership Programme”, “Life Saving Commitments”
awareness program and Noggin OCA incident management system has lead to a 52% reduction in incidents
per million man-hours worked from 3.4 to 1.6 (FY2017).
Strictly Private & Confidential 31Logistics Division Strictly Private & Confidential 32
Business Overview
Targeted Total Capacity of ~100 million MT by 2020
Sime Darby Logistics is the primary operator of Weifang Port, of which operations cover dry bulk, break bulk, liquid bulk, general cargo and
container handling services.
The Division also operates three river ports located in Jining, Shandong Province. The Jining Ports provide basic port related services such as
stevedoring and storage services primarily for coal and coal-related products
The two water treatment plants operated by the Division are located in the Binhai Economic-Technological Development Area (“BEDA”) adjacent to
Weifang Port and supplies clean water to residential, commercial and industrial users in BEDA
Location of Assets Annual Throughput & Capacity
1 Weifang Port (Sea Port)
FY2017
Throughput - bulk 19.9 mm MT
1 Throughput - container 219.8k TEU
2
Capacity - bulk 32.6 mm MT
Capacity - container 463.2k TEU
Target Capacity - bulk 40.6mm MT
(FY2020)
3
2 Jining Ports (River Port)
FY2017
Throughput 11.2 mm MT
Capacity 16.4 mm MT
Target Capacity (FY2020) 18.7 mm MT
3 Weifang Water
FY2017
Throughput 40.6 mm m3
Capacity 51.1 mm m3
Strictly Private & Confidential 33Key Financial and Operational Highlights
Revenue (RM mm) PBIT (RM mm)
Lower Jining Port tariffs as a result of
intense competition & tighter environmental
controls by Jining authority
303 103
294 294
77 28
250 44 60 70
53 64
6 12
37 23
250 75
241 243 64 65
213 41
2014 2015 2016 2017 2014 2015 2016 2017
Ports Water Ports Water
Invested Capital(1) (RM mm) ROAIC(2) (%)
2,294
2,101 5.2%
1,898 4.7%
4.4%
1,561
2.9%
2014 2015 2016 2017 2014 2015 2016 2017
Notes:
(1) Invested capital is calculated as total assets (excluding tax assets and intercompany balances) less operating liabilities (i.e. all liabilities except borrowings, intercompany balances, leases and
tax liabilities
(2) ROAIC is calculated as PBIT divided by average invested capital
Strictly Private & Confidential 34Others Strictly Private & Confidential 35
Ramsay Sime Darby Health Care (RSDHC)
The Strategy Moving Forward
                                                             Active Beds: 1,152                          Bed Capacity: 1,541

                      50%                            Assets in
                                                     Malaysia
                                                                  Subang Jaya Ara Damansara        ParkCity
                                                                                                                  MEDIPLEX   RSDH College
                                                                 Medical Centre Medical Centre   Medical Centre
                                                                                                                  Wellness
                                                                                                                   Centre

                                                     Assets in
                       50%                           Indonesia
                                                                  RS Premier     RS Premier       RS Premier
                                                                  Jatinegara      Bintaro          Surabaya

    Asia-focused Portfolio                                    Positive Prospects

                                                                                    ▪   Fast growing sector in Asian emerging
                                                             Demographic                markets due to population growth &
                                                               Trends                   increasing life expectancy
                      China
                                                                                    ▪   Rising affluence in Asia
                                         Existing presence

               Myanmar HK Macau         Target markets
                        Vietnam                                  Organic
                                                                                    ▪ Driving cost reduction and attaining
                                                                                        operational excellence will also drive
               Thailand         Philippines                      Growth
                                                                                        profit growth
                             Malaysia

      Singapore
                                                             Availability of
                                                                                    ▪ Strategic partnerships in Asia
                Indonesia                                    Opportunities

Strictly Private & Confidential                                   36
Malaysia Vision Valley Land
~8,800 acres of land – Option to sell to SD Property
Highlights of MVV Option to sell ~8,800 acres
MVV is a large scale project announced by the Malaysian
Prime Minister during his 2016 Budget speech, and is a
component of the Government's 11th Malaysia Plan and the
National Transformation Plan.
Tenure of development
30-year project
Total development area
379,000 acres
Coverage area
Seremban and Port
Dickson in Negeri
Sembilan Sime Darby Berhad holds c.8,800 acres of land
in MVV area, acquired for RM2.5 bn in FY17
The area is intended to focus on 4 key development drivers: Signed 29 option agreements with SD
Property for the potential sale of 29 parcels
High-technology manufacturing
The options are valid for a 5-year period (plus
Tourism
3 years extension option)
Skill-based education and research
The timing of exercise of the option by Property
Specialised services
will be dependent on the MVV development plan
MVV development is expected to: which is currently being developed
Attract investments of RM290bn by 2045 Transfer value will be based on market price at
Create 1.38 million new job opportunities
the point of exercise
Strictly Private & Confidential 37Appendices Strictly Private & Confidential 38
Sime Darby Berhad
Proposed Corporate Structure Post-Proposals

                                                                                                                  (RM million)
                                                                                                                  30-Jun-17             Motors Industrial Logistics             Others   Group
                                                                                                                  External Debt            756         1,304           312        822        3,194
                                                                                                                  Cash                     513          454            175        930        2,072
                                                                                                                  Revenue               20,602        10,127           303         55    31,087
                                                                                                                  PBIT                     633            (4)           64         91         784

                 Motors                                        Industrial                                          Logistics                               Healthcare & Others

                                                                                                                                                                50%     Ramsay Sime Darby
      100%                                              100%         Sime Darby                            100%                                                          Health Care Sdn
                Sime Darby Motors                                                                                  Sime Darby Utilities
                                                                  Industrial Holdings                                                                                      Bhd group
                     Sdn Bhd                                                                                            Sdn Bhd
                                                                       Sdn Bhd
                                                                                                                                                                12%
                                                                                                                                                                         Eastern & Oriental
                                                                                                                                                                             Berhad(1)

                                                                                                                                                                100%         Kumpulan Sime
                                                                                                                                                                              Darby Bhd(2)

                                                                                                                                                                100%     Sime Darby Global
                                                                                                                                                                        Services Centre Sdn
                                                                                                                                                                               Bhd(3)
                                                                                                                                                               60% or
Notes:                                                                                                                                                         100%
(1) Principal activities – hotel ownership & management, property development and property investment                                                                    Insurance Broking
(2) Existing owner of 8,793 acres of land located at Labu, Negeri Sembilan, which are earmarked for the Malaysia Vision Valley Project. Sime Darby                           business(4)
    Property Bhd (“SD Property”) is granted call options to purchase these lands at any time during the option period (5 years with an option to
    extend for another 3 years)
(3) Principal activities – Provision of support services to group companies, including Sime Darby Plantation Bhd (“SD Plantation”) and SD Property.
    Entered into master services agreements with SD Plantation and SD Property to continue to provide shared services for a period of 3 years                   100%        Sime Darby
(4) Principal activities – insurance and reinsurance brokers, insurance advisory and consultancy services. Malaysia – 60% owned Sime Darby                               Malaysia Berhad(5)
    Lockton, Singapore and Hong Kong – 100% owned
(5) Principal activities – holding of trademarks (SIME DARBY mark, logo and tagline). Entered into trademark and brand license agreement with SD
    Plantation and SD Property for the licence of the trademarks for a period of 4 years
Strictly Private & Confidential                                                                39
SDB Group
FY2017 Balance Sheet
Historical Financials
Healthcare
(FYE June; RM million) Motors Industrial Logistics Proforma
& Others
Fixed Assets 2,973 3,795 1,738 145 8,651
Associates, JVs and Investments 109 339 414 1,021 1,883
Inventories 3,461 3,619 3 20 7,103
Trade & Other Receivables 2,098 2,034 295 91 4,518
Other Assets 19 138 - (11) 146
Tax Assets 160 328 41 309 838
Intra Group Balances 10 758 1 (769) -
Cash & Bank Balances 513 463 176 920 2,072
Total Assets 9,343 11,474 2,668 1,726 25,112
Share Capital 2,200 300 200 6,599 9,299
Reserves 1,305 5,095 510 (1,214) 5,696
Shareholders' Equity 3,505 5,395 710 5,385 14,995
Non Controlling Interests 214 18 120 23 375
Total Equity 3,719 5,413 830 5,408 15,370
Borrowings & Leases 756 1,315 312 822 3,205
Intra Group Balances 1,631 2,139 1,189 (4,959) -
Tax Liabilities 148 274 6 32 460
Trade & Other Payables 3,006 2,217 143 405 5,771
Other Liabilities 83 116 188 18 405
Total Liabilities 5,624 6,061 1,838 (3,682) 9,841
Total Equity & Liabilities 9,343 11,474 2,668 1,726 25,112
Invested Capital 5,826 8,089 2,294 1,097 17,306
ROAIC (%) 10.9 (0.1) 2.9 4.6
Debt/Equity (%) 63.9 49.8 73.9 20.9
Notes:
(1) Invested capital is total assets (excluding tax assets and intercompany balances) less operating liabilities (i.e. all liabilities except borrowings, intercompany balances, leases and tax liabilities
(2) ROAIC is PBIT divided by invested capital
Strictly Private & Confidential 40End Strictly Private & Confidential 41
You can also read


