Violations of Neoclassical Economic Theory in the NBA Labor Market
←
→
Page content transcription
If your browser does not render page correctly, please read the page content below
Violations of Neoclassical Economic Theory in the
                     NBA Labor Market
                                              Jordi Adoumie
                                   University of California, Berkeley
                                        Economics Department
                                        jadoumie@berkeley.edu

                                                Spring 2019

                                                    Abstract

           This paper analyzes the labor market of the National Basketball Association, NBA, to de-
        termine how performance is linked to compensation. In an efficient market, we would expect
        that compensation is directly correlated with performance. Naturally, the better a player per-
        forms, the more that individual should be paid. In other words, if the decision makers in the
        NBA act as rational agents, we should be able to model players’ compensation as a function of
        their performance. In reality, this paper finds that performance is a poor indicator of compen-
        sation and discusses plausible explanations for this finding as well as the potential implications
        for other labor markets.

1      Introduction
    PricewaterhouseCoopers recently published a sports industry report, “projecting that the sports
market in North America will grow at a compound annual rate of 4.0% annually”, which will bring
the industry to nearly $74 billion in combined annual revenues by 2020.1 As the sports industry
as a whole continues to grow, it becomes increasingly important for economists to understand
the fundamental financial factors in this field. This paper aims to analyze the labor market in the
National Basketball Association (NBA) to gain a better understanding of one of the largest growing
    1. Adam W. Jones, “At the Gate and Beyond: Outlook for the Sports Market Through 2019,” 2016, 1, 2.

                                                        1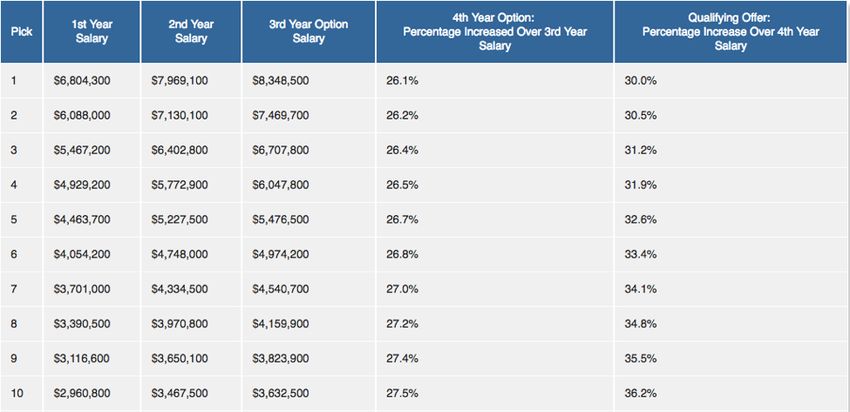
segments of the sports industry. The NBA created $7.5 billion in revenues across thirty teams in
2018, an increase of 25% from the year prior and is projected to continue to grow at this clip for
the next 10 years.2 As the NBA continues to grow at an incredible pace, a number of questions
begin to arise around the financial structure of the league and what it reveals about neoclassical
financial theory. For example, are there opportunities for arbitrage in this market and if so, to what
extent do financial agents in the NBA rationally take advantage of these opportunities?

     Specifically, labor markets in the sports industry are uniquely positioned as an experimen-
tal field for behavioral economics research. First, there are large financial incentives from arbi-
trageurs in understanding the dynamics at play as billions of dollars are generated year over year.
Furthermore, sports labor markets may be the only labor markets where performance metrics are
so meticulously tracked in real time. Data analytics has become increasingly popular in sports, a
concept that can be no better explained by anyone other than Michael Lewis, a financial journal-
ist and best-selling author who has spent a life-time dedicated to understanding financial-markets
and writes about his findings in great detail for the broader public. I urge anyone who is inter-
ested to learn more about the growing trend of data analytics and the financial impact it has had
in the sport’s industry to read Lewis’s book, Moneyball: The Art of Winning an Unfair Game.3
In essence, mathematicians, statisticians and computer scientists have developed advanced player
metrics across many sports over the past thirty years to help teams gain a competitive advantage
in creating rosters. Scouts, agents, and general managers have come to rely on these performance
metrics to conduct business. In the NBA, these player metrics are widely available and updated
instantly after every game. Compensation information for every player in the league is also pub-
licly available. The instant availability of both advanced performance metrics and compensation
information creates a unique opportunity for economists to conduct a wide range of research that
would not be available in other labor markets.

    This paper will evaluate the effectiveness of the relative compensation structure across the
NBA. The following research aims to develop a greater understanding of whether the way players
are paid falls in line with classical economic theory, specifically analyzing how strongly compen-
sation and performance are linked. Assuming that NBA franchises are rational agents, we would
expect that players are paid in a manner that is reflective of their overall performance. To the ex-
tent that this expectation is not true, this paper will evaluate the possible explanations for why an
  2. “Forbes Releases 20th Annual NBA Team Valuations,” 2018, accessed November 15, 2018, https://www.
forbes.com/sites/forbespr/2018/02/07/forbes- releases- 20th- annual- nba- team- valuations/
#797f8f8634e6.
  3. Michael Lewis, Moneyball: The Art of Winning an Unfair Game (New York: W.W. Norton, 2011).

                                                  2
inefficient labor market exists in the NBA and subsequently discuss what these findings may imply
about a wider range of economics research.
In order to understand some of the processes used in this paper, it is important to provide a
general background of the financial landscape of the NBA as it pertains to player contracts and
compensation. The Collective Bargaining Agreement, or the CBA, is a contract between players
and team owners that formally and legally addresses the rules of the league. Larry Coon, a known
expert of the CBA, explains the agreement as a legal document that, “defines the salary cap...the
minimum and maximum salaries, the rules for trades, [and] the rules for the NBA draft”.4 The
salary cap effectively disables teams from spending over a certain threshold amount on their players
every season, and is calculated as a percentage of the total basketball related income, or BRI, that
is projected to be earned before each season. As of the 2017-2018 season, the salary cap was
set at $99.093 million, and is split between players on each team’s roster as management deems
fit; however, there are minimum and maximum individual salaries that must be maintained in the
market. For example, no single player can make more than 35% of a team’s total salary cap.5
At a first glance, it already appears that contracts may be constructed in a manner that inhibits
the efficiency of price movements. If any individual player were to be a much better performer
than other players in the league, the fact that there is a maximum salary that a player can receive
indicates that the value of any player is intrinsically restricted by the artificial cap in place. The
amount a player gets paid per season is also largely based on how many years a player has been in
the league. Teams are allowed to pay a higher percentage of their total salary cap to players that
have been in the league for longer periods of time.
In this paper we will split the NBA labor market into two distinct player pools: Rookie Pools
and Experienced Pools. The reason for this distinction stems from the fact that the NBA has
different salary rules for rookies and all other players, so it is important to divide the market into
separate categories when considering how performance and compensation are linked. The first
part of our research will evaluate how compensation and performance is linked for players that are
under “rookie scale contracts”. Rookies enter the league in what is known as the NBA Draft which
functions similarly to the drafting process in many popular sports. In the NBA draft, there are two
total rounds with thirty picks per round. It is important to note that for rookies, “salaries for first
round picks are set according to a strict scale, determined by their draft position” with contracts
4. Larry Coon, “Larry Coon’s NBA Salary Cap FAQ,” 2018, http : / / www . cbafaq . com / salarycap . htm #
copyright.
5. Ibid.
3that last for a maximum of four years.6 Essentially, the first pick in the draft will make the most
money and each subsequent draft pick will continue to make less money than the previous pick.
Fig. (4) in the Appendix provides a visualization of this breakdown. The compensation structure
for rookies is actually a bit more convoluted in reality, but this general understanding will suffice
for our research.
Any player that is no longer on a rookie contract will be included in the Experienced Pool. This
consists of players that have played through all four years of their rookie contracts and are on new
contract deals as well as players that may have signed a contract extension after their second year
in the league, when players are eligible to negotiate new contract deals with their current team.7
This distinction will allow us to effectively analyze how performance and compensation are linked
within the two markets that are naturally created by the NBA’s Collective Bargaining Agreement.
2 Literature
The most well-known research related to sports labor markets was conducted by behavioral
economists, Cade Massey and Richard Thaler. In their paper, “The Loser’s Curse: Overconfidence
v. Market Efficiency in the National Football League Draft”, they explore the inefficiencies of the
NFL draft and determined that, “top draft picks are overvalued in a manner that is inconsistent
with rational expectations and efficient markets”.8 Their research unearthed the tendency that NFL
teams display in overpaying for the opportunity to draft players early on in the NFL draft. While
Massey and Thaler’s paper was one of the first papers to point out that market inefficiencies occur
in the sports industry, their analysis solely concerned draft picks and not the entire NFL labor
market as a whole. In this paper, I hope to expand on Massey and Thaler’s work by not only
looking at how inefficiencies exist within the NBA draft setting with players in the Rookie Pool,
but also how these inefficiencies can be extended to the broader NBA labor market – to players in
the Experienced Pool.
A fellow Berkeley student, Adhiraj Watave, conducted a similar study as Massey and Thaler
on the NBA draft in his 2016 thesis paper, “Relative Value of Draft Position in the NBA”.9 His
conclusions were similar to their results as he found that NBA teams also consistently overvalue
6. Coon, “Larry Coon’s NBA Salary Cap FAQ.”
7. Ibid.
8. C. Massey and Richard Thaler, “The Loser’s Curse: Decision Making and Market Efficiency in the National
Football League Draft,” Management Science 59, no. 7 (2013): 1479–1495.
9. Adhiraj Watave, “Relative Value of Draft Position in the NBA” (master’s thesis, UC Berkeley, 2016).
4early draft picks. This paper will take a similar approach to some of Watave and Thaler’s work
to first evaluate performance and compensation metrics as they relate to players in the Rookie
Pool. Furthermore, this paper will go beyond both of these areas of research in evaluating how
performance and compensation are related outside of the draft setting, specifically how players are
compensated for their performance within the Experienced Pool.
Tom Ziller’s SBNation article provides some interesting insights into this topic of study as
a qualitative exploration of what the opportunity costs are of overpaying players in the NBA.10
His article argues that teams should be more aware of their tendencies to overpay players because
it inhibits them from using their limited resources in acquiring players that will actually help the
team win. While this article is interesting, it provides next to no quantitative assessment of whether
teams are in fact overpaying players. Lastly, Aaron Barzilai, a former Philadelphia 76ers executive,
wrote an article that assessed the relative value of an NBA draft pick in a similar fashion to the
work done by Watave in his senior thesis.11
3 Performance Metrics Methodology
The first important decision to make in this research process was to decide which advanced
metrics most accurately capture the overall performance of NBA athletes. While it is interesting
to analyze statistics such as PPG, points per game, or RPG, rebounds per game, these simple stats
do not accurately reflect a player’s holistic contributions to a team’s success. In reality, individual
performance is much more convoluted than the amount of points or rebounds a player generates per
game. Therefore, it was important to find statistics that effectively measure overall performance.
The three statistics that are used as performance indicators throughout the rest of this paper
were created by professional statisticians and are commonly used to evaluate basketball perfor-
mance by NBA analysts. Fortunately, they are also widely available to the public. The first statistic
that appears in this research is PER, or player efficiency rating. This metric was developed by
John Hollinger, a popular sports analyst, and he describes it as, “a rating of a player’s per minute
productivity” on the court.12 This metric takes into account positive accomplishments on the court,
“such as field goals, free throws, 3-pointers, assists, rebounds, blocks and steals, and negative ones
10. Tom Ziller, “What a 1st-round pick in the NBA Draft is really worth, and why,” 2014, https://www.sbnatio
n.com/nba/2014/6/24/5817122/nba-draft-2014-value-picks.
11. Aaron Barzilai, “Assessing the Relative Value of Draft Position in the NBA Draft,” 2007, https : / / www .
82games.com/barzilai1.htm.
12. John Hollinger, “What is PER?,” 2011, http : / / www . espn . com / nba / columns / story ? columnist =
hollinger_john&id=2850240.
5such as missed shots, turnovers and personal fouls”.13 In order to calculate PER we must first
find the “unadjusted PER”, or uPER. The formula for calculating uPER can be expressed as the
following:14
uPER = (1/MP) ∗
[3P
+ (2/3) ∗ AST
+ (2 − factor ∗ (team AST/team FG)) ∗ FG
+ (FT ∗ 0.5 ∗ (1 + (1 − (team AST/team FG)) + (2/3) ∗ (team AST/team FG))
−VOP ∗ T OV
−VOP ∗ DRB% ∗ (FGA − FG) (1)
−VOP ∗ 0.44 ∗ (0.44 + (0.56 ∗ DRB%)) ∗ (FTA − FT )
+VOP ∗ (1 − DRB%) ∗ (T RB − ORB)
+VOP ∗ DRB% ∗ ORB
+VOP ∗ ST L
+VOP ∗ DRB% ∗ BLK
− PF ∗ ((lg FT /lg PF) − 0.44 ∗ (lg FTA/lg PF) ∗VOP) ]
A breakdown of each of the acronyms used in the formula above is provided in Figure (5) of the
Appendix. uPER is a great measure of a player’s overall performance, but it does not take into
consideration a team’s pace, or the number of possessions that a team has on average over the
course of a game. In order to standardize this metric across all players, it is important to calculate
a pace factor for every team in the league. Pace factors can easily be found on ESPN, Basketball
Reference, or a number of popular sports blogs. After determining an appropriate pace factor, PER
can be calculated as follows:15
PER = pace adjustment ∗ uPER (2)
The next statistic used throughout the rest of this paper is VORP, or value over replacement player.
This measures a player’s contribution to a team and compares that to what a theoretical “replace-
ment player” would achieve. A “replacement player” is a player that has the same position as the
13. Hollinger, “What is PER?.”
14. John Hollinger, “Calculating PER,” 2018, https://www.basketball-reference.com/about/per.html.
15. Ibid.
6player we wish to analyze, but is being paid the minimum level of salary. VORP can be calculated
as follows:16
VORP = [BPM] − (−2.0) ∗ (% of minutes played) ∗ (team games)/82 (3)
A breakdown of the acronyms used in this equation can be found in Figure (5) of the Appendix.
The last statistic that will be used throughout the rest of the paper is Win Shares per 48 Minutes,
WS/48. WS/48 is considered to be how much any individual player contributes to a team’s win over
the course of an entire game, which is 48 minutes in length. The formula for WS/48 is calculated
as follows:17
WS/48 = 1.00 ∗ (FG) ∗ (1 − ((team AST)/(team FG)
+ 0.50 ∗ (FG) ∗ ((team AST)/(team FG)
+ 1.00 ∗ ((FGA) − (FG)) (4)
+ 0.44 ∗ (FTA)
+ 0.50 ∗ (AST )
All of these statistics indicate different information about a player’s holistic level of performance.
It should be noted that higher numbers are indicative of higher performance for each of these stats.
When analyzed in conjunction with one another, these stats will represent a player’s performance
throughout the rest of the paper.
4 Performance and Compensation in the Rookie Pool
The first part of the labor market we wish to analyze is the Rookie Pool. Once again, this pool
consists of players that were selected in the NBA draft and have their compensation predetermined
by draft order. The data used in this section was obtained from two sources, Basketball Reference18
and ESPN.19 Compensation information and performance information was gathered from 2005
to 2014 for players that were selected in the first round of the NBA draft. These years were
used in order to ensure that every rookie player included in the data had at least four years of
available information to analyze over the course of their respective rookie contracts. This means
16. “About Box Plus/Minus (BPM),” 2017, https://www.basketball-reference.com/about/bpm.html.
17. “NBA Win Shares,” 2017, https://www.basketball-reference.com/about/ws.html.
18. “Basketball Reference,” 2019, https://www.basketball-reference.com/players/.
19. “ESPN,” 2019, http://www.espn.com/nba/salaries.
7that performance metrics were analyzed from 2005-2018. Any player that was drafted after 2014
is not included in this analysis as the length of their rookie contract can extend into the next few
seasons. It is fair to assume that teams may pay rookie players not for their immediate performance,
but rather for their potential performance over the entire length of their rookie contracts. In order
to account for this phenomenon in the calculations, performance metrics were averaged over the
course of a player’s entire rookie contract. Furthermore, only players that played an average of
at least forty-one games per season during their rookie contracts were selected. This filter was
applied in order to mitigate abnormal outliers that would influence the final results by playing either
extremely well or extremely poorly over a short number of games and were not representative of
the overall population we wish to analyze.
The three performance metrics that were selected, PER, VORP and WS/48 were then calculated
and averaged over the length of each player’s respective rookie contracts for the reasons outlined
above. The averages obtained in this process were subsequently bucketed by draft order from 1-30.
For example, every player that was selected as the third pick in the NBA draft from 2005 to 2014
was placed in a specific bucket to be analyzed together and this process was repeated for every
pick in the draft. For draft picks that fell in the range of 15-30, there were less players that met
the criteria of playing an average of at least 41 games per season during their rookie contracts. In
order to ensure meaningful results, these picks were collected and joined together into groups of
2-3 picks per bucket. This is better illustrated through the visualizations of the results included
below. Then, in order to effectively scale the results, each bucket was divided by the first picks’
average salary and the first picks’ average performance metrics. In other words, since the first
picks in the draft always have the highest salary over the course of their rookie contracts, their
salary was scaled to 1.0 and all other players would have a scaled salary less than 1.0. In a similar
fashion, performance metrics were all scaled to the first picks’ performance as well. In an ideal
market, we would expect that the first pick in the draft would have the highest level of performance
too. Therefore, the first picks’ performance was scaled to 1.0; however, unlike compensation,
it is possible for players that were selected later in the drafting process to have higher levels of
performance and therefore it is possible that some players had performance metrics greater than
1.0.
In order to analyze whether compensation is a good indicator of performance in the Rookie
Pool, scaled performance metrics were weighted by the respective scaled compensation informa-
tion. Line-plots were generated for each of the weighted performance metrics: PER / $, VORP /
$ and WS per 48 / $. The results for each of the performance metrics support the results of both
8Watave and Thaler in their respective research processes. Specifically, it seems that performance
is a poor indicator of compensation in the Rookie Pool of the NBA across all three performance
metrics selected:
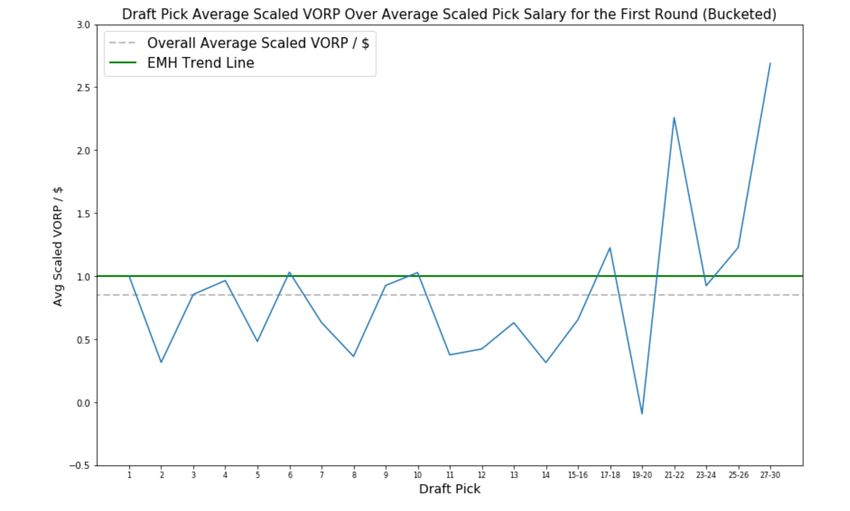
Figure 1: Line-plots of average scaled PER, WS/48, & VORP weighted by relative compensation
for first round NBA draft picks from 2005-2014
9For all of the visualizations above we would expect results that closely follow the solid dark
trend line in a perfectly efficient labor market. The relative amount that a player is paid should be in
theory directly proportional to that player’s performance. The solid EMH (efficient market hypoth-
esis) trend line is what we would expect to see if every player was paid perfectly according to their
performance. Once again, the first picks in the draft were given compensation and performance
values that were scaled to 1.0. Players that are picked later in the draft have scaled compensation
values that are less than 1.0 because they are paid less than the first picks. Theoretically, we assume
that performance is proportionate to compensation. For example, if a player has a compensation
value of 0.90, they are paid 90% of what the first pick is earning. Subsequently, we would expect
for this player to have an associated performance value of 0.90, indicating that his performance is
10% less than the first pick’s performance. In essence, we assume that compensation is directly
tied to performance levels and for each dollar that a team spends on a player the team receives
a constant marginal increase in productivity or performance. Instead, we see somewhat volatile
plots that actually increase with the order in which rookies were selected in the NBA draft. This
indicates two interesting results that violate the assumptions of neoclassical economics within the
Rookie Pool. First, it supports Watave’s research that NBA teams seem to over-value the ability
to pick early on in the draft process. Teams are consistently willing to overpay top draft picks
based on their relative performance levels. Second, these results indicate that performance and
compensation are not strongly linked in the Rookie Pool. In fact, when considering performance
10metrics that are weighted by compensation, it seems players that are paid less perform relatively
better per dollar spent. This is more clearly understood by breaking apart the buckets used in the
visualizations above and analyzing each draft picks’ average weighted performance from 2005 -
2014.
The results of this analysis are shown by the scatter plots below:
Figure 2: Scatter-plots of weighted PER, WS/48, & VORP to Draft Pick position in the Rookie
Pool from 2005 - 2014.
11These results suggest that the compensation structure in the Rookie Pool of the NBA is far
from an efficient process. If players were efficiently compensated for their performance, we would
expect for the slope of each of these plots to be zero because all players should be directly com-
pensated for their respective levels of performance. However, all three weighted metrics appear
to be positively correlated with the order in which players are drafted. Specifically, these results
show that players that are selected later in the drafting process tend to have higher weighted per-
formance metrics. This indicates that per dollar spent, players picked towards the end of the draft
have higher rates of productivity. Once again, these results support many of the conclusions made
by Massey & Thaler in regards to the NFL Draft. The implications of an inefficient drafting pro-
cess are wide reaching, but what if the entire labor market in sports functions in a similar manner?
In other words, what if inefficiencies in sports labor markets can be extended beyond rookie scale
contracts?
5 Performance and Compensation in the Experienced Pool
In order to analyze how compensation and performance are linked in the Experienced Pool of
the NBA labor market, I began by pulling data from the most recent completed NBA season, the
2017 – 2018 season. Once again, only players that are not on rookie-scale contracts were included
in the Experienced Pool. The same advanced metrics were analyzed: PER, VORP, and WS/48.
Only players that played in over 41 games, or over half of the season, were included to avoid
12outliers that skew the analysis. These filters resulted in a total of 354 players in the Experienced
Pool for the 2017 – 2018 season.
This pool is slightly more difficult to analyze because there is no specific compensation sched-
ule that teams adhere to as is the case within the Rookie Pool. Within the Rookie Pool we saw
that compensation was predetermined by draft order. In the Experienced Pool, compensation is
determined directly by the market. Any team that wants to acquire a player can offer a player any
salary as long as it adheres to the guidelines set by the CBA. Yet, we can essentially analyze this
pool in a similar fashion to that of the Rookie Pool. In essence, each player in the experienced pool
is assigned a position from 1-354 based on their compensation levels. The highest paid player is
assigned to the 1st position, the second highest paid player is assigned to the second position, and
so on and so forth. This creates a structure that is similar to the draft order seen in the Rookie Pool
which is essentially a ranking system that determines compensation. This allows us to analyze the
Experienced Pool in a similar manner to the Rookie Pool. Now, many of the assumptions made in
the Rookie Pool can be extended to the Experienced Pool of players. Specifically, in a perfectly
efficient market we would expect the player in the first position to have the same level of weighted
performance as the player in the last position. In other words, we assume that players are directly
compensated for their performance and that performance should be a near perfect indicator of a
player’s salary.
We can continue to create weighted performance metrics that factor in compensation with a
nearly identical process to the one used within the Rookie Pool. First, we scale every players’
compensation to the compensation of the player in the first position. The player in the first position
will consequentially have a compensation level of 1.0 and every subsequent position will have a
compensation level that is less than 1.0. Furthermore, we can scale every players’ performance
levels to the performance of the player in the first position. Once again, we would expect that the
highest paid player in the Experienced Pool would have the highest holistic performance; however,
it is possible for players with lower salaries to perform better than the player in the first position,
leading to scaled performance metrics that are greater than 1.0. Now, we can analyze the results
from the Experienced Pool in a similar fashion to the Rookie Pool. For visualization purposes,
scatter-plots are the most effective way to illustrate the results:
13Figure 3: Scatter-plots of weighted PER, WS/48, & VORP to player position in the Experienced
Pool for the 2017-2018 NBA season.
These results indicate that inefficiencies continue to exist in the Experienced Pool of the NBA
labor market. Once again, we would expect there to be no correlation between player position
and weighted performance. However, similar to what we saw in the Rookie Pool, it appears that
14for PER and WS/48, players that have lower salaries tend to have higher weighted performance
metrics. This finding is interesting because agents also have more information about how players
perform in the Experienced Pool. Most players in the Experienced Pool have played for a number
of years and have been critically analyzed by scouts, managers, and agents. One would expect
that the Experienced Pool would be more efficient than the Rookie Pool as rational agents would
properly adjust for the mistakes they may have made in the draft setting. Not having enough
information on the future performance of incoming rookies creates a lot of speculation, which is
one plausible explanation for inefficiencies that occur in the Rookie Pool. It is fair to say that
analyzing college performance, how most agents determine the value of incoming NBA players,
may not directly apply to how these players will perform in the NBA. Yet, even after obtaining
information on how players perform in the league, there is still evidence of inefficiencies in the
market.
Interestingly, the results for VORP were more in line with our expectations of an efficient NBA
market. First, the amount of variation that is attributable to Player Position is incredibly low - R2
is practically zero. In a completely efficient market we would expect there to be no variation what-
soever: the player in the first position should have the same weighted performance as the player
in the last position. It is possible that VORP is a more accurate measure of performance than both
PER and WS/48 and subsequently appears to reflect a somewhat efficient market; however, most
basketball analysts contend that PER is the single most important factor to consider in determining
holistic performance, which notably exhibited the highest R2 - 89.5%. The high R2 value indicates
that player position can account for nearly 90% of the variation in the data set which we would
expect to exhibit no variation in an efficient market. In other words, it seems incredibly likely that
inefficiencies exist in the Experienced Pool of the NBA labor market. I leave the interpretation of
the VORP results in the Experienced Pool for further academic research.
6 Conclusion & Discussion
This paper set out to analyze the structure of the labor market in the NBA. Specifically, it
set out to determine to what extent compensation could be linked to player performance. In an
efficient market we might assume that players are directly paid in a manner that is proportionate
to their performance. In other words, NBA teams act as rational agents in the market and are able
to perfectly pay players based on their contributions to the team’s overall success. However, the
results obtained within both the Rookie and Experienced Pools proves otherwise – players with
lower salaries consistently outperform their counterparts when evaluating weighted performance.
15Massey and Thaler pointed out the tendency that teams made in overvaluing early draft picks
in the NFL Draft. This paper has been able to replicate many of these results within the setting
of the NBA while extending the analyses to include the entire labor market as a whole. What the
results suggest about labor markets in the sports industry is not immediately clear, yet it could be
a key piece of information in reevaluating the current compensation structure across many popular
sports. Of course, it is important to draw attention towards a variety of factors that may also
dictate compensation in the open market of the sports industry that have not yet been brought to
light. Many of the following considerations would be excellent areas for economists and sports
enthusiasts to conduct further research.
First, it is important to consider the underlying motivations of NBA teams. From the per-
spectives of sports enthusiasts, such as myself, it is almost natural to immediately assume that all
teams value winning and will subsequently maximize the combined performance of the players
they sign on to their rosters in efforts to win; however, it is incredibly important to realize that ra-
tional agents in an economic setting do not necessarily care about winning, rather they care about
making money. If it is the case that agents in the market will make more money for any reason
outside of winning, then it stands within reason that the NBA market is still efficient. However,
there is a strong argument that can be made for why winning directly correlates to making more
money. In a research paper I wrote about NBA player contracts, I breakdown why in the NBA
setting it has been seen repeatedly throughout the league’s history that teams that historically win
the most games also generate the most revenue in the league. I recommend anyone who is inter-
ested to find out more to read the paper, “The Basketball Boom: A Balanced Perspective on Player
Contract Ethicality”.20 The general idea that is outlined in that paper is that teams that have won
the most championships historically continue to earn the most revenue. Furthermore, teams that
are more recently beginning to win are capturing more revenue as a direct result of their winning.
Fans like to watch teams win, and fans are the customers of the business. However, there are still
certain circumstances where we may see that teams can obtain exorbitant monetary benefits from
players that are overpaid but still manage to draw in large amounts of viewership and revenue. A
great example is Kobe Bryant’s farewell tour of the 2015-2016 season. While Kobe is frequently
regarded as one of the best players of all time and was being paid the highest salary in the league
in 2015, $25 million, he was performing at a much lower level than what his compensation would
have indicated.21 However, so many fans of the NBA loved Kobe that nearly every game he played
20. Jordi Adoumie, “The Basketball Boom: A Balanced Perspective on the Ethicality of NBA Player Contracts,”
2017,
21. Michael Pina, “LA Lakers Paid Immeasurable Price for Kobe Bryant’s Farewell Tour,” 2017, https://ble
acherreport . com / articles / 2632938 - la - lakers - paid - immeasurable - price - for - kobe - bryants -
16in that season sold out and he generated an incredible amount of money for many teams around the
league – specifically his home-team the Los Angeles Lakers. To this effect, it is important in fu-
ture research to consider how some players may generate large amounts of revenue for the league
and get fairly compensated for this revenue generation regardless of whether their performance
supports their salary.
Another interesting consideration for future research would be to focus on how risk and the
length of player contracts affect sports labor markets. This is specifically relevant when conducting
further analyses within Experienced Pools. Typically, players negotiate multi-year contracts with
teams that effectively inhibit price movements for a set period of time. Every financier understands
that risk is a major part of business – the golden rule suggests that the higher the level of risk an
asset possesses, the higher its returns must be to justify the corresponding risk. This fundamental
concept of finance is also at play within labor markets, specifically within the sports industry.
A great player may well deserve a very large salary, but there is a specific amount of risk that
management must calculate when determining how to proceed in offering a great player a fair and
competitive deal. The most prominent risk in sports is any risk of injury. If a player injures himself,
teams are still responsible for paying that player’s salary. This could have huge repercussions if a
team decides to go all-in on one individual that unfortunately injures himself and is consequentially
rendered useless on the court. On the other hand, teams may be willing to pay certain players higher
levels of money than what they may be currently worth, hoping that their performance will exceed
expectations on a long-term contract. These are respectable strategies and considerations deployed
by teams in the NBA. Future research on this topic would elevate the results of this paper.
One last factor that is particularly interesting to consider is how off-court performance may be
quantified and accounted for in evaluating player performance and compensation in future models.
Currently, real-time data is directly captured to provide information of how a player performs
on the court – how positive is a player doing during basketball games. Yet, there are a range
of other intangible aspects of performance that cannot be simply modeled with the information
available to the public. A full NBA season for a player consists of training camps, preseason
games, team practices, individual trainings, video research and analytics, and strategy meetings
with other players and with the team’s management and coaching staff. Many of the contributions a
player makes within an organization very well may not be captured holistically by the performance
metrics that sports analysts study – stats that are solely derived from in-game action. While any
players’ off-court contributions may not be easily quantifiable, they may also be an important
farewell-tour.
17consideration that agents in the market consider when determining compensation.
While it is clear that there are a number of areas that have yet to be researched in this field,
the results obtained in this paper powerfully indicate that compensation and performance are not
linked in a manner that most economists would expect to be found in an efficient market. Whether
these insights suggest that the NBA should restructure its current compensation structure and how
these insights can be collectively tied to other labor markets is left for further research.
18Acknowledgements
I would like to emphasize how valuable the resources listed in the literature section of this
paper have been in conducting a variety of the analyses that went into this research project. If
not for the tremendous insights provided by the individuals previously mentioned, specifically the
work done by Massey, Thaler, and Watave, many of the results I was able to obtain would not have
been achievable.
I would also like to thank Professor Hawkins for bringing this idea to life from the concepts
that I first learned in his Behavioral and Financial Economics course and for being an invaluable
resource throughout the semester in helping me structure my ideas in a cohesive and professional
manner; Gregory Yannett for continuously providing input on how to collect, analyze and visualize
data; Natalie Dunn for editing this paper more times than I can even remember, and a number of
friends for supporting me throughout the course of the semester.
19Appendix
Figure 4: Partial Breakdown of NBA Rookie Salary by Draft Pick (Picks 1-10)
Figure 5: Breakdown of Acronyms Used in Advanced Metric Formulas
20References
“About Box Plus/Minus (BPM),” 2017. https://www.basketball-reference.com/about/
bpm.html.
Adoumie, Jordi. “The Basketball Boom: A Balanced Perspective on the Ethicality of NBA Player
Contracts,” 2017.
Barzilai, Aaron. “Assessing the Relative Value of Draft Position in the NBA Draft,” 2007. https:
//www.82games.com/barzilai1.htm.
“Basketball Reference.” 2019. https://www.basketball-reference.com/players/.
Borghesi, Richard. “An Examination of Prediction Market Efficiency: NBA Contracts and Trade
Sports.” The Journal of Prediction Markets 3, no. 2 (2009).
Coon, Larry. “Larry Coon’s NBA Salary Cap FAQ.” 2018. http://www.cbafaq.com/salaryca
p.htm#copyright.
“ESPN.” 2019. http://www.espn.com/nba/salaries.
“Forbes Releases 20th Annual NBA Team Valuations.” 2018. Accessed November 15, 2018. ht
tps://www.forbes.com/sites/forbespr/2018/02/07/forbes- releases- 20th-
annual-nba-team-valuations/#797f8f8634e6.
Hollinger, John. “Calculating PER,” 2018. https://www.basketball-reference.com/about/
per.html.
. “What is PER?” 2011. http://www.espn.com/nba/columns/story?columnist=
hollinger_john&id=2850240.
Jones, Adam W. “At the Gate and Beyond: Outlook for the Sports Market Through 2019,” 2016,
1, 2.
Lewis, Michael. Moneyball: The Art of Winning an Unfair Game. New York: W.W. Norton, 2011.
Massey, C., and Richard Thaler. “The Loser’s Curse: Decision Making and Market Efficiency in
the National Football League Draft.” Management Science 59, no. 7 (2013): 1479–1495.
“NBA Rookie Scale.” https://basketball.realgm.com/nba/info/rookie_scale.
“NBA Win Shares,” 2017. https://www.basketball-reference.com/about/ws.html.
21Pina, Michael. “LA Lakers Paid Immeasurable Price for Kobe Bryant’s Farewell Tour.” 2017.
https://bleacherreport.com/articles/2632938-la-lakers-paid-immeasurable
-price-for-kobe-bryants-farewell-tour.
Watave, Adhiraj. “Relative Value of Draft Position in the NBA.” Master’s thesis, UC Berkeley,
2016.
Ziller, Tom. “What a 1st-round pick in the NBA Draft is really worth, and why,” 2014. https:
//www.sbnation.com/nba/2014/6/24/5817122/nba-draft-2014-value-picks.
22You can also read