Forecasting power and gas prices on various time frames and resolutions with PLEXOS - Dr Christos Papadopoulos
←
→
Page content transcription
If your browser does not render page correctly, please read the page content below
Forecasting power and gas prices on various
time frames and resolutions with PLEXOS®

Dr Christos Papadopoulos
Regional Director Europe       5th Annual Electricity Price Modelling
                               and Forecasting Forum
Energy Exemplar (Europe) Ltd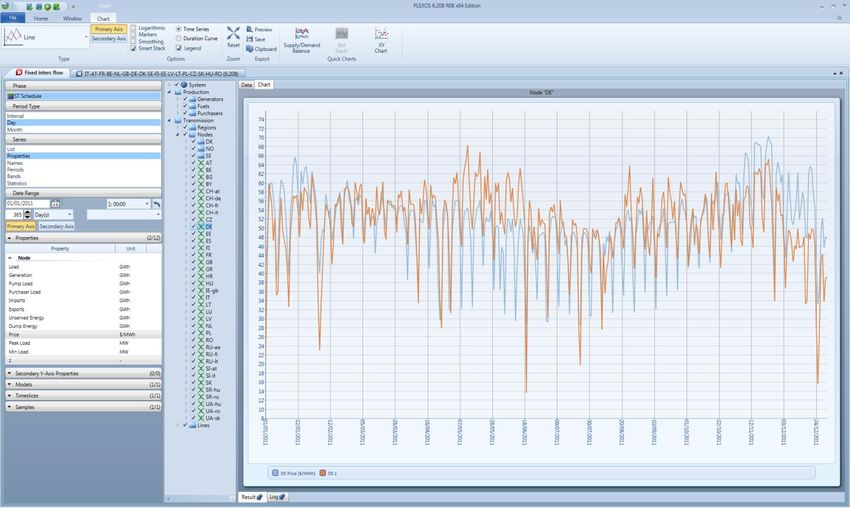
Energy Exemplar &
PLEXOS® Integrated Energy Model

About Energy Exemplar
PLEXOS® Integrated Energy Model - Released in 1999
Continuously Developed to meet Challenges of a Dynamic Environment
A Global Leader in Energy Market Simulation Software.
Offices in Adelaide, AUSTRALIA; London, UK; California, USA-WC; Connecticut, USA-EC,
Johannesburg, SOUTH AFRICA.
High Growth Rate in Customers and Installations
30% staff with Ph.D. level qualifications spanning
Operations Research, Electrical Engineering,
Economics, Mathematics and Statistics
European Office:
Software Sales
Customer Support
Training
Consulting
European Systems/Markets &
Countries Datasets
11-Sept-14 Energy Exemplar - 5th Annual EPM & FF 3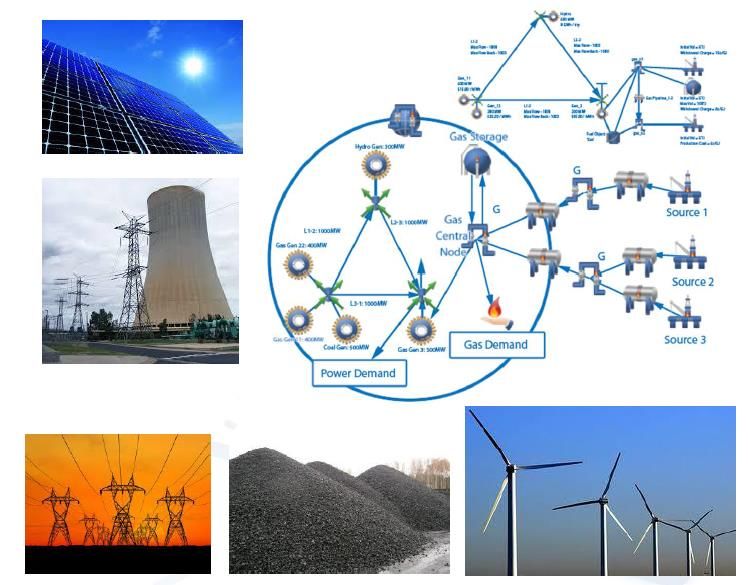
Energy Exemplar
Portfolio of clients in all five continents                                         Energy Exemplar Europe

As of the end of July 2014, worldwide installations of PLEXOS have exceeded 850
at over 145 sites in 35 countries.

      11-Sept-14                            Energy Exemplar - 5th Annual EPM & FF                       4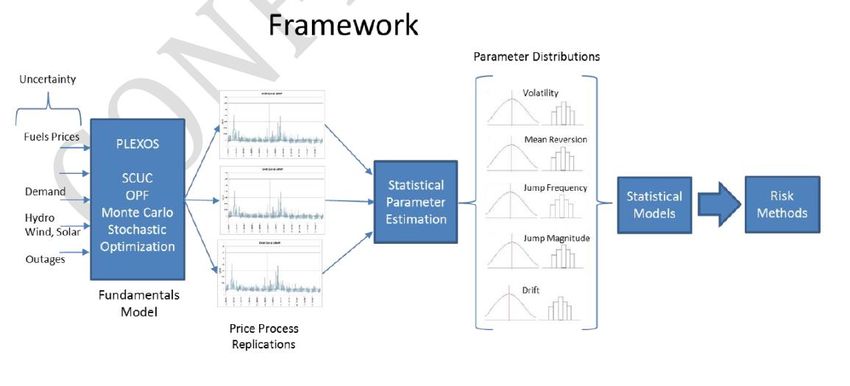
PLEXOS® Integrated Energy Model for Energy (Power & Gas)
Systems & Markets Simulation, Optimisation & Analysis.
Proven power market simulation tool &
Integrated Energy Model
Uses cutting-edge Mathematical Programming
based Constrained Optimisation techniques
(LP/MILP/DP/SP),
Robust analytical framework, used by:
Energy Producers, Traders and Retailers
Transmission System /Market Operators
Energy Regulators/Commissions
Consultants, Analysts and Research Institutions
Power Plant Manufacturers and Construction companies
Power systems’ models scalable to thousands of
generators and transmission lines and nodes
11-Sept-14 Energy Exemplar - 5th Annual EPM & FF 5
PLEXOS® Integrated Energy Model Recently it was released and was integrated within PLEXOS® the NEW Gas (modelling) Module. The new PLEXOS® Gas module provides the capability to model the costs and constraints of gas delivery from its source fields via a network of pipelines, through storages and on to meet demands, including those associated with the Power production model. More importantly though, it is now possible in PLEXOS®, the Integrated Modelling of both Natural Gas and Power Systems & associated Markets. 11-Sept-14 Energy Exemplar - 5th Annual EPM & FF 6
PLEXOS® Integrated Energy Model

GAS ELECTRIC
COOPTIMIZATION &
PRICE FORECASTING

  11-Sept-14        Energy Exemplar - 5th Annual EPM & FF   7
PLEXOS® Integrated Energy Model That practically means that, it can be now also used in: Simulation of electricity and natural gas prices in short term to long term. Natural gas network price formation linked to Gas Powered Generation fuel costs Pipeline congestion pricing from Well Heads to Natural Gas Hubs Gas market integrated with competitive electricity market production cost models Market driven production outputs for both gas and electricity sources Fundamentals of Supply and Demand modelling for gas and electric Hourly and sub hourly price forecasting for Day Ahead, Intraday & Real Time Markets Flexibility for assessments for gas electric systems 11-Sept-14 Energy Exemplar - 5th Annual EPM & FF 8
Natural Gas and Electric System Coordination Coordination of both the Natural Gas and Electric sectors is critical for: Least cost co-optimization of OPEX and CAPEX of gas and electric system expansion Combined economic benefit analysis for gas and electric rate payers Strategic energy development for public policy and renewables integration Valuation of gas and electric storage opportunities and dual fuel optimizations Evaluation of gas and or electric contingencies that can impact reliability Derating of gas powered generators due to gas network constraints Assessing emerging gas constraints with generation retirements Interregional market and asset development planning for gas and electric 11-Sept-14 Energy Exemplar - 5th Annual EPM & FF 9
Integrating quantitative and fundamental
     price forecasting with PLEXOS®
A General Classification of Models
Specific vs Generic
Estimation vs Principal Laws
Numerical vs Analytical
Stochastic vs Deterministic
Microscopic vs Macroscopic
Discrete vs Continuous
Qualitative vs Quantitative
11-Sept-14 Energy Exemplar - 5th Annual EPM & FF 11Power Markets’ Models Classification – Statistical Statistical (or technical analysis) Models, Statistical approaches aim at finding the optimal model for electricity prices in terms of its forecasting capabilities. They are either direct applications of the statistical techniques of load forecasting or power market implementations of econometric models. Most popular methods include multivariate regression, time series models and smoothing techniques. While the efficiency and usefulness of such “technical analysis” tools in financial markets is often questioned, in power markets these methods do stand a better chance. The main reason is the seasonality prevailing in electricity price processes during normal (non-spiky) periods. This makes the electricity prices more predictable than those of “very randomly” fluctuating financial assets. In order to enhance their performance, they often incorporate fundamental factors, like loads or fuel prices. 11-Sept-14 Energy Exemplar - 5th Annual EPM & FF 12
Power Markets’ Models Classification – Artificial Intelligence Artificial intelligence-based (or non-parametric, ANN, Fuzzy Logic, Genetic Algorithms) Models: Artificial intelligence-based (AI-based) models, are employ pattern recognition type of techniques, modelling price processes via non- parametric tools such as artificial neural networks (ANNs), expert systems, fuzzy logic and support vector machines. AI based models tend to be flexible and can handle complexity and non-linearity. This makes them promising for short-term predictions 11-Sept-14 Energy Exemplar - 5th Annual EPM & FF 13
Power Markets’ Models Classification – Quantitative Quantitative (Econometric, Reduced-form) models: Quantitative models characterize the statistical properties and dynamics of electricity prices over time, with the ultimate objective of derivatives evaluation and risk management. They aim to recover the main characteristics of electricity prices, typically at the hourly/daily time scale and monthly time horizons. Although in this context the models’ simplicity and analytical tractability are an advantage, in accurately forecasting e.g. hourly prices is a serious limitation, while the recovery of their main underlying characteristics is an excessive luxury. 11-Sept-14 Energy Exemplar - 5th Annual EPM & FF 14
Power Markets’ Models Classification – Fundamental Fundamental Models: Fundamental methods are based on the most basic economic principles of supply and demand describing price dynamics and modelling the impact of important physical and economic factors on the market equilibrium price of electricity. The fundamental inputs (loads, weather conditions, system parameters) are independently modelled and predicted, often employing statistical, econometric or non-parametric techniques. Because of the nature of fundamental data which is typically collected over relatively long time intervals and the data availability issues, pure fundamental models are mostly used for medium to long-term analysis and predictions. 11-Sept-14 Energy Exemplar - 5th Annual EPM & FF 15
Fundamental Models’ Classification – Production Cost Production Cost (or cost-based) models: Pure production-cost models simulate the operation of generating units aiming to satisfy demand at minimum cost. They may have the capability to also forecast prices on an hour-by-hour, bus-by-bus level, however, when ignore market’s operational principles and strategic bidding practices are not well suited for today’s competitive markets. 11-Sept-14 Energy Exemplar - 5th Annual EPM & FF 16
Fundamental Models’ Classification – Market Equilibrium
Equilibrium (Game Theoretic) approaches may be viewed as generalizations of cost-based
models amended with strategic bidding considerations. They may give good insight into whether
prices will be above marginal costs and how this might influence the players’ outcomes.
Various types of equilibrium approaches have been proposed:
Perfect Equilibrium – Firms are price-takers, biding in their SRMC and possess no market power
Cournot-Nash Game – Quantity is the strategic variable, and firms choose quantities
simultaneously, under the assumption that other firms’ quantities are fixed
Bertrand Game – Price is the strategic variable, and firms choose prices simultaneously, assuming
that other firms’ prices are fixed
Supply Function Equilibrium (SFE) – entire bid functions are the strategic variables, and firms
choose their supply functions simultaneously, under the assumption that other firms’ supply
functions are fixed; a market mechanism, e.g. an ISO, then determines price and sets the
quantity. Cournot-Nash framework tends to provide higher prices than those observed in reality
and the supply function equilibrium framework requires considerable numerical computations
and consequently, has limited applicability in day to-day market operations.

11-Sept-14                       Energy Exemplar - 5th Annual EPM & FF                         17
Fundamentals vs Quantitative modelling
Fundamental Models Quantitative Models
Prices are determined by supply and
demand principles Prices depend mostly on historical prices
Replicates actual market design and and random processes
intended behaviour meeting economic Usually probabilistic, explore the
and operational constraints distribution properties of prices
Can capture technical constraints on
physical assets operating within the Can suffer from in-sample bias of historical
market data
Allows any type of “what if” analysis into Scenarios only with parameters and/or
the future explanatory variables
Can allow co-optimisation of other
requirements such as ancillary services Most models cannot handle negative prices
and/or district heating load etc. Result focuses on prices only
Produce results that reflect future Limited understanding of what particular
structural changes e.g. carbon price
impacts, changes to market rules, input could be causing the resulting price
renewable integration
11-Sept-14 Energy Exemplar - 5th Annual EPM & FF 18Common criticisms of Fundamental Market models
in replicating short term prices (trading)
Emphasis on a deterministic outcome
Failure to capture bidding strategies by players in the market
(pure production cost models)
Assumptions of perfect market theory
Failure to capture the peak price volatility (pure equilibrium
models)
Run times not conducive of using a large market model within
a trading environment when regular updating of inputs is
required.
However the recent advances in computing power have led
to their adoption for short-term predictions.
11-Sept-14 Energy Exemplar - 5th Annual EPM & FF 19Fundamentals vs Quantitative modelling 11-Sept-14 Energy Exemplar - 5th Annual EPM & FF 20
Uncertainties and Risks involved
With the advent of power markets and the evolution of market
mechanisms both financial and physical positions have uncertainty that
requires quantification to better plan for the future.
In today’s power sector transmission competes with generation and load
competes with generation and transmission.
How so?
Active demand response and energy efficiency can reduce the need for
generation capacity as well as transmission requirements.
A load pocket can be served with transmission or local generation.
Physical asset developers must evaluate all the risks of physical competition
to see how competitive their solutions are and then shortlist the most
competitive ones and use limited corporate resources to focus on the more
likely winners.
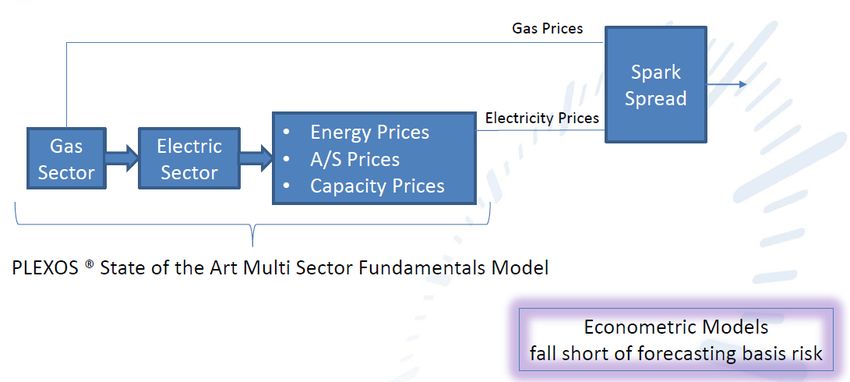
11-Sept-14 Energy Exemplar - 5th Annual EPM & FF 21PLEXOS® Modelling Framework PLEXOS provides a framework for testing various pricing options for assets valuations in markets where competition can emerge in the form of load, transmission or generation solutions. Likewise for natural gas infrastructure development, PLEXOS® provides a comprehensive valuation methodology that considers both electrical and gas sector gas demands. For financial risk evaluation PLEXOS® mixes both statistical risk models with fundamentals models. Statistical risk methods depend on historical data and can suffer from in-sample bias where fundamentals models can generate price paths that can reflect structural change such as carbon price impacts, change in market rules, retirements and new entries of power plants, changes in demand forecasts and fuel forecasts and price paths subject to other uncertainty. 11-Sept-14 Energy Exemplar - 5th Annual EPM & FF 22
PLEXOS® Modelling Framework

The combination of statistical methods and
fundamentals is the preferred approach of today’s risk
managers.
In addition, PLEXOS® also offers the power of stochastic
optimization which enables the risk manager to forecast
robust forecasts for generation assets, market prices,
and other quantities.

11-Sept-14          Energy Exemplar - 5th Annual EPM & FF   23
PLEXOS® Modelling Framework

11-Sept-14          Energy Exemplar - 5th Annual EPM & FF   24
2 Day Forecast ARMA (3,0,3)(1,0,1)

11-Sept-14            Energy Exemplar - 5th Annual EPM & FF   25
PLEXOS® Modelling Framework

11-Sept-14          Energy Exemplar - 5th Annual EPM & FF   26
Two fundamental modelling approaches in PLEXOS®
Input Bid based Stack model: Generation Cost based Stack model:
Each generator is represented with offer Each cost element that makes up a
price/quantity files which must be known in generators offer into the market can be
advance (“backasting - calibration”) or separately inputted
inferred. Each generator offer price/quantity is
Easier to setup, no need to calculate each calculated based on SRMC plus any mark-ups,
element that makes up a generators SRMC. so it is finally transformed to a Bid-stack model.
Can link price/quantity files to an external Allows more flexibility when modelling the
source to update regularly and overall effect of changes of certain generator
automatically values (fuel costs, heat rates, outage rates etc.)
Unit commitment decisions will still be Harder to gain accurate technical and
optimised by PLEXOS such as MUT, MDT, commercial characteristics on competitors
ramp limits, start profiles etc. However min plant.
stable level and max capacity of units need If inputs are realistic, a more useful model for
to be defined. price “forecasting” when compared to a Bid
stack model, at the cost of increased run time
11-Sept-14
BID STACK GENERATION (SRMC) STACK 27Impact of Growing Generation from RES on Supply Stack & the Wholesale
Power Price
Supported RES generation brings volatile and less predictable Demand
supply
The spot prices decline (not the final price for the consumer!)
Gas
Negative impact also - Lower utilization of non-RES generation
Hard coal
75 Lignite
50
Nuclear
25
RES
0
20 40 60 80
Source: CEZ
11-Sept-14 Energy Exemplar - 5th Annual EPM & FF 28Supply (bid) Curves of multiple generators
Daily development of the supply curves submitted to the California Power
Exchange during a 24-hour period
Energy Laboratory Publication # MIT_EL 00-004
11-Sept-14 Energy Exemplar - 5th Annual EPM & FF 29Plants’ Bid Stack vs Generation (SRMC) Stack
Bid Stack Generation Stack
11-Sept-14 Energy Exemplar - 5th Annual EPM & FF 30Fundamental Hybrid modelling for price formation in PLEXOS® - Marginal Pricing Power markets run on “marginal pricing” thus it is the “cost” of the marginal (or last) unit of serviced load that sets the energy price. NOTE: Under Perfect Competition price must be equal to the SRMC of the marginal generating unit. In reality, generators bid above their SRMC. Every linear programming problem, referred to as a primal problem, can be converted into a dual problem, which provides an upper bound to the optimal value of the primal problem. The dual problem deals with economic values (Shadow Prices). Solving a linear program usually provides more information about an optimal solution than merely the values of the decision variables. 11-Sept-14 Energy Exemplar - 5th Annual EPM & FF 31
The different timeframes and resolution
           phases of PLEXOS®
Europe’s electricity providers face an existential threat
(The Economist 12/10/2013)
New Era
The decline of Europe’s utilities has certainly been startling. At their peak in 2008, the top
20 energy utilities were worth roughly €1 trillion ($1.3 trillion).
Now, less than half that.
Under the “old” system, electricity prices spiked during the middle of the day and early
evening, falling at night with lower demand. So, companies made all their money during
peak periods.
Now the middle of the day belongs to solar generation that has competed away the price
spike.
In Germany in 2008, according to the Fraunhofer Institute for Solar Energy Systems, peak-
hour prices were €14 per MWh above baseload prices.
In the first six months of 2013, the premium was €3 per MWh.
So not only have average electricity prices fallen by half since 2008, but the peak
premium has also fallen by almost four-fifths.
11-Sept-14 Energy Exemplar - 5th Annual EPM & FF 33Historical price analysis slowly becoming less relevant
Fundamental changes in the energy markets are already
effecting prices
Changing government policies (EMR)
Change in market design (coupling of markets)
Renewable Integration/Subsidies
Drop in energy demand and growth due to economic crisis
Falling CO2 price
Spark spreads going to negative and falling (expensive Gas)
Dark spreads going positive (cheap imported coal)
What do we have to consider next?
Demand Side Management
Energy Storage technologies
Capacity markets or more importance on reserves and balancing
Increased electrification of rail networks
Government legislation and policies
Understanding renewables profiles and potential variations is
becoming more critical in forecasting daily prices
Strong decrease of the weight in the
peak hours in a typical daily profile
11-Sept-14 Energy Exemplar - 5th Annual EPM & FF 34Price Forecasting: What Price(s)?
When we normally talk about Electricity Price Modelling and
Forecasting we imply Electricity Price and particularly Spot (DA)
Prices.
Are still the only important ones?
There is a whole list of electricity associated market products
that their significance is continuously revealed day by day and their
pricing and associated price forecasting will be become even more
important in the years to come.
Reserves (AS) and Balancing Prices and related Price Forecasting.
11-Sept-14 Energy Exemplar - 5th Annual EPM & FF 35Price Forecasting: What Timeframes and at what
Resolution?
PLEXOS®
Energy prices
• Optimal Expansion Plan
Capacity payments (prices)
LT •LT prices
• LRMC Recovery Method
• RSI Company (player) revenue targets
MT • Nash-Cournot Game Adjust bids: Mark-ups
• Cost-based Efficiency •MT prices
• Bertrand Game
Hourly (period) energy price forecast
• Nash-Cournot Game
ST • Uplift ex-post price (RT) Energy & Ancillary Services prices
•ST prices
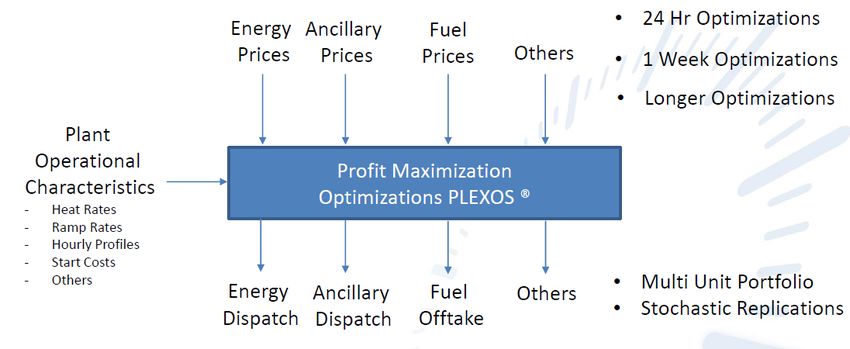
11-Sept-14 Energy Exemplar - 5th Annual EPM & FF 36Generation: Fixed v Variable Costs The variable portion of generation cost is set by fuel prices, generator efficiencies and any opportunity costs implied by other constraints. Generators trading in the market expect to recover their variable costs of operation in every period – referred to as their short-run marginal cost (SRMC). In the medium term, however, they must also cover fixed operating costs, make contributions to debt servicing, and return a profit to shareholders. These fixed cost charges together can be expressed as a per kW capacity charge across some period of time, generally one year. The combined charge (variable plus fixed) is often referred to as long-run marginal cost (LRMC) 11-Sept-14 Energy Exemplar - 5th Annual EPM & FF 37
PLEXOS® Equilibrium Model Mechanism for Calculating Market Price
The market price of energy is the marginal cost, as represented by
generators’ price/quantity offers (usually, somewhere between SRMC &
LRMC) of serving consumption at each node or region.
The marginal cost is found by simulating the least-cost economic dispatch
of the entire market, emulating the steps followed by a Market Operator,
subject to all:
Generation technical characteristics and constraints;
Transmission technical characteristics and constraints; and
Forecast of load/demand and renewable generation
The market price, at Nodal Level (LMP) is made up of the marginal cost of:
Generation;
Transmission losses, to that node; and
Transmission congestion, to that node
PLEXOS therefore can fully replicate the Nodal or Locational Marginal
Pricing (LMP) market rules.
11-Sept-14 Energy Exemplar - 5th Annual EPM & FF 38Locational (Nodal) Marginal Pricing (LMP) in PLEXOS®
λι = λ + αι + βι
Marginal Cost Marginal Cost
LMP = of Generation + of + Marginal Cost
at reference Transmission of Losses
bus Congestion
λ is the system “lambda” αι : is the congestion charge at node i
βi: is the marginal loss charge at
αι is the node’s congestion charge ωj: is the shadow price on the thermal node i
βι is the node’s marginal loss charge limit constraints for path j rj: is the resistance on line j
Xi,k: is the angle reference matrix
fj’: is the flow on the line j at the
element
optimal solution
ωκ: is the shadow price on the node
phase angle constraints for node k
11-Sept-14 Energy Exemplar - 5th Annual EPM & FF 39Market Equilibrium
LMP prices based on marginal costs do not include:
While short term solutions
Start Cost
for start and no-load costs
No-load cost are typically included in
Fixed Costs generator bids, Long-term
cost recovery (fixed costs)
Therefore, units do not collect all of their costs, and electric
is seldom met in an
prices are artificially low energy-only market model.
Baseload and intermediate units can collect some of
these costs because they collect above marginal costs This phenomena has been
while peakers are running dubbed “the Missing
Money Problem”.
Peakers do not collect these costs Absent a solution, the
Market Solutions market generates
External (i.e. Resource Adequacy) insufficient revenue to
sustain operations
Price Uplift
Revenue Adequacy Energy Exemplar - 5th Annual EPM & FF
11-Sept-14 40What about Reserves (AS) & Balancing Prices Forecasting? Utilities and grid operators must be prepared to account for power plants or transmission lines that unexpectedly go out of service, or for unforeseen increases or decreases in electricity supply and/or demand. In addition, as utilities and grid operators increase their reliance on intermittent renewable generation capacity like wind and solar power, additional balancing resources are required to address any inconsistencies in generation (e.g. when sufficient wind and sun are not available). The existing’ products address these short-term imbalances in electricitAncillary Servicesy markets by dispatching resources within seconds or minutes of an unacceptable imbalance, but the question is, will these existing AS products be enough in this challenging new environment? Due to all these and the increased role of AS, a significant diversification between DA and RT (balancing prices) might be expected in the future. 11-Sept-14 Energy Exemplar - 5th Annual EPM & FF 41
What about Ancillary Services & Balancing Prices Forecasting?
System Reserves include among others, coordinated system operation,
frequency regulation, energy balance, voltage support and generation
reserves.
Ancillary Services features of PLEXOS® are used in order to:
Optimise the uptake of renewables given this additional burden
Ensure provision of reserves in dispatch and expansion planning
But more importantly, to calculate the cost to the system and the
effect on energy prices of the additional reserve requirements and to
Calculate and forecast expected ancillary service prices and test any
new ancillary services provisions.
This analysis takes advantage of PLEXOS® ability to set dynamic reserve
requirements based on generators’, load or line contingencies.
11-Sept-14 Energy Exemplar - 5th Annual EPM & FF 42Co-optimization–Towards an Integrated solution Co-optimisation & Pricing in Integrated Markets/Systems Co-optimization is necessary to minimize the total costs of coordinating generation, transmission and reserves to meet demand and ensure reliability. Electricity and Reserves Shadow prices derived from the constrained optimization accurately reflect the system-wide opportunity costs of associated scarce resources, both inter- temporally and spatially. 11-Sept-14 Energy Exemplar - 5th Annual EPM & FF 43
Ancillary Services Pricing & Price Forecasting When requirements for reserves are considered, the optimal trade-off between energy and reserve provision must be determined. The AS marginal price for an AS in a region is the incremental (Marginal) cost for meeting an additional MW of the requirement for the AS in this region. If no additional compensation were required to cover the cost of a plant operating at lower efficiency to provide reserves, the required compensation is given by the opportunity cost of backing off generation to provide reserves. In PLEXOS® this compensation will be automatically embodied in the reserves price, which is equal to the dual variable associated with the constraint defining the required quantity of reserves. 11-Sept-14 Energy Exemplar - 5th Annual EPM & FF 44
Opportunity Costs
Under the Co-optimisation of Energy and multiple AS, the market clearing prices for the multiple
products have the following 3 characteristics:
LMP for energy gives a precise representation of the cause-effect relationship that is
consistent with grid reliability management
Higher Prices for higher quality (more Flexible) Ancillary Services.
Spinning Raise Prices = Shadow Price (Clearing Price) of Spinning Reserve requirement constraint +
Shadow Price (Clearing Price) of Regulation Raise requirement constraint
There is Marginal Equity between Energy and Reserves Prices
Energy LMP - Shadow Price (Clearing Price) of Regulation Raise requirement constraint =
Marginal Cost (Shadow Price) of combined Energy and Regulation Reserves provision at
the node, when SR=0 and RR>0.
Energy LMP - Shadow Price (Clearing Price) of Regulation Raise requirement constraint -
Shadow Price (Clearing Price) of Spinning Reserve requirement constraint = Marginal Cost
(Shadow Price) of combined Energy, Spinning and Regulation Reserves provision at the
node, when SR>0.
11-Sept-14 Energy Exemplar - 5th Annual EPM & FF 45Modelling & Forecasting DA/ID/RT Prices Energy Exemplar performs a few renewable generation integration studies using the 3-stage DA-HA-RT sequential simulation approach. This approach can be illustrated in the following flow-chart. 11-Sept-14 Energy Exemplar - 5th Annual EPM & FF 46
Available Pricing Methods in PLEXOS® Locational Marginal Pricing (Nodal Pricing) (value = 0) Generators receive the locational marginal price (LMP) at the node(s) they are connected to. If a generator is connected to multiple nodes it receives the generation-weighted average price at those nodes according to the defined generation participation factors. Regional (Reference Node Pricing) (value = 1) Generators receive the regional reference price modified by the generators’ marginal loss factor. Regional Weighted Price (value = 2) Generators receive the load-weighted price in the region(s) they belong to. Pay-as-Bid (value = 3) Generators receive the offer price for each megawatt of generation cleared. Uniform Pricing (value = 4) Generators receive the single market price (uniform price). Most Expensive Dispatched (value = 7) The price is set at the SRMC of the most expensive dispatched Generator regardless of whether or not that Generator is truly marginal. None (value = 5) Generators receive no payment for generation. This option is useful where generators sell their output into an external energy market and revenues accrue to the trading portfolio (company) rather than the individual generating units. Custom (value = 6) PLEXOS® makes a call to Open PLEXOS® to calculate pricing. This method allows the user to implement custom pricing. 11-Sept-14 Energy Exemplar - 5th Annual EPM & FF 47
Bertrand Competition Modelling in short-term price
Forecasting?
Bertrand Competition is a game theoretic model in which firms
manipulate the price component of their generation offer and keep
quantities fixed.
It is generally accepted that Bertrand Competition does not yield
high enough average prices to recover generator investment costs,
but that it is a useful method for modelling short-term pricing
especially in the way it can capture gaming behaviour in times of
tight supply-demand balance and/or transmission congestion.
11-Sept-14 Energy Exemplar - 5th Annual EPM & FF 48Bertrand Competition in Modelling short-term
pricing?
PLEXOS® simulator implements a heuristic shadow pricing scheme that mimics
Bertrand Competition. In this game generators choose prices for their output in
order to maximize profit making opportunities in a one-round game.
The Bertrand game is simulated independently for each dispatch interval e.g.
hour, half-hour, etc.
The advantage of this is that the Bertrand Game can be run for any horizon
length from a single interval up.
The disadvantage is that the game makes no reference to the medium term
effect of the pricing results i.e. it ignores the price elasticity of demand.
11-Sept-14 Energy Exemplar - 5th Annual EPM & FF 49Bertrand Game -'Shadow Pricing'
The core mechanism of the Bertrand
Game is 'Shadow Pricing' i.e. pricing
generation up to the next generator's
offer price in the merit order. This is
illustrated in Figure 1. The stack of
generation is shown for three Figure 1: Generation bid-stack
independent generators (G1, G2, G3).
Figure 2 shows the offer prices that
result from a simple shadow pricing
policy:
"G1" bids up to "G2" price less epsilon
"G2" bids up to "G3" price less epsilon
"G3" bids up to shortage price less
epsilon
Figure 2: Generation bid-stack after Shadow Pricing
11-Sept-14 Energy Exemplar - 5th Annual EPM & FF 50Daily Bertrand v Real Energy Prices - Germany 11-Sept-14 Energy Exemplar - 5th Annual EPM & FF 51
Hourly Bertrand v Real Energy Prices - Germany

11-Sept-14          Energy Exemplar - 5th Annual EPM & FF   52
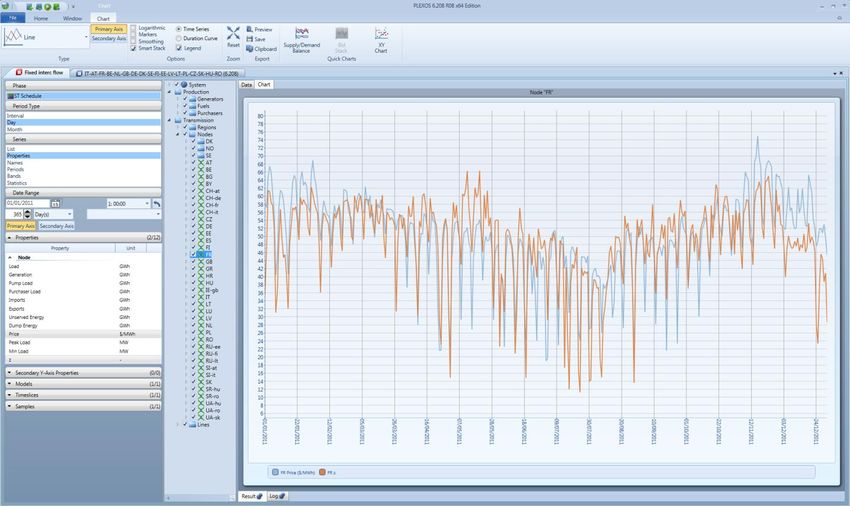
Daily Bertand v Real Energy Prices – France

11-Sept-14          Energy Exemplar - 5th Annual EPM & FF   53
Hourly Bertrand v Real Energy Prices - France

11-Sept-14          Energy Exemplar - 5th Annual EPM & FF   54
Thank you for your time and the
         opportunity
For further Information, please do not hesitate to contact EE Europe:

Dr Christos Papadopoulos
Regional Director Europe
christos.papadopoulos@energyexemplar.com

                       www.energyexemplar.com
You can also read