The True Value of Solar - By Steven Fine, Ankit Saraf, Kiran Kumaraswamy, Alex Anich
←
→
Page content transcription
If your browser does not render page correctly, please read the page content below
WHITE PAPER
The True Value of Solar
By Steven Fine, Ankit Saraf, Kiran Kumaraswamy, Alex Anich
Executive Summary
As solar becomes an increasingly significant factor in the generation mix, ICF believes that utilities,
investors, and markets are missing out on optimal strategies to price assets, lower costs, and mitigate
risks, because they lack a consistent and accurate approach for determining the true value of solar.
Current methodologies are all over the map, yielding different outputs based on different inputs, and
different assumptions to those inputs. That is why we suggest here an updated, comprehensive
methodology that could help all stakeholders expose the benefits and costs and make more informed—
and ultimately more beneficial—investments.
This kind of approach will likely become even more important in the years to come. The amount of
distributed photovoltaic (DPV) installed behind the meter specifically for residential customers grew 60
percent from 2012 to 2013. ICF forecasts DPV installations to continue to increase to over 27 GW on
commercial and residential premises by 2018, representing over 1.8 million locations where DPV will be
interconnected to the distribution grid. Utilities, regulators, and the broader solar industry will need to
understand how to value this growing factor in the market.
In this paper, we look at the current state of value of solar (VOS) analysis and propose a more holistic
methodology that can be consistently applied across various utility service areas. We recommend factors
for inclusion and exclusion in the calculation and consider the most appropriate way to construct each
variable, keeping in mind our base view that distributed resources need to be evaluated in the same light
as other generating resources on the grid, not just a decrement to load.
We recommend the following methodological approaches on potential VOS components:
Energy: avoided generated energy represents the most straight-forward calculation, and while the best
way to quantify energy value would be at the margin, a more simplified interim approach may be
considered.
Avoided/Deferred Generation Capacity: there needs to be a realistic analysis of the correlation
between customer and system peak as well as an analysis of the DPV’s generation profile to accurately
assign a DPV system capacity credit. The same process should be applied to DPV projects as with
central station renewables, with the added complication that penetration rates on distribution system
feeders also need to be included.
Avoided Transmission and Distribution (T&D) Losses and Capacity: for the T&D portion of the grid,
DPV potentially represents both a benefit and a cost, and both of these impacts need to be included
and separately assessed as part of a VOS analysis. This includes careful consideration of where DPV will
be deployed versus the loads being served, as well as understanding the different feeder
characteristics.
Grid Support Services: based on the high amount of uncertainty on this variable, we believe that Grid
Support Services should not be included in a VOS calculation for potential payment but should be
reviewed for the potential to determine the mechanisms that may need to be in place to monetize any
potential value when the appropriate technology exists.
Environmental: as a generation resource on the grid, DPV should be evaluated in the same way as any
other new resource, including central station renewables, in terms of environmental costs and benefits
that it confers upon the system. The emissions (in this case CO2) values assigned on a $/ton basis
should be similar to those used to evaluate other power generation resources.
Financial: “financial” benefits such as a fuel price hedge, reservation of natural gas pipeline capacity,
and/or a market price response are not typically accounted for in utility integrated resource planning
(IRP) evaluations of new resources, including central station renewables, or in cost-benefit evaluations
of EE measures, and should not be included in VOS analyses.
1 icfi.com ©2014 ICF International, Inc.
Social: “social” values are not included in the construction of utility scale conventional or renewable
projects and should not be part of VOS analyses.
Security: when DPV is able to isolate from the grid or “island,” it can provide reliability to the owner of
the facility. This value, however, does not accrue to society or even the local grid. Security benefits
should therefore be explored to value resiliency at specific critical locations, however, they should not
yet be included in the VOS calculation until a set and agreed-upon methodology for resiliency is
developed.
Frequency to Update VOS: the utility should update the VOST on a locational basis for new
installations yearly to address the changing amount of solar or energy use in different areas.
The result of our approach is a general roadmap for achieving a better consensus VOS, though
calculations for individual entities would require an analysis tailored to the individual circumstances of
their geography, energy market, and physical grid infrastructure.
This new VOS calculation could be an input in calculating the retail credit net energy metering (NEM)
subsidy under a Value of Solar Tariff (VOST), and can also help to guide larger investment and market
decisions for utilities, regulators, and the broader solar industry, better aligning costs and benefits and
mitigating the risks that the rise of solar will bring to the market.
The Value of Solar
Value of Solar (VOS) Analysis to Date
Numerous studies have been conducted on VOS, but these have been highly variable in generating
estimated value due to the different approaches used to calculate benefits and costs. Despite these
variations in values, VOS studies do commonly agree upon the broad categories involved, although not
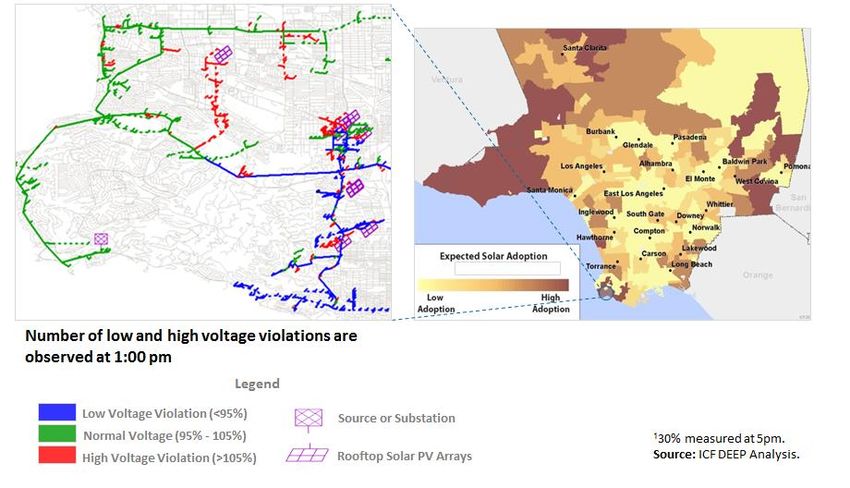
consistently. Figure 1 illustrates the broad categories commonly used in VOS studies extrapolated from the
Rocky Mountain Institute’s (RMI) recent 2013 meta-study “A Review of Solar PV Benefit and Cost Studies.”
These categories cover most of the tangible and intangible benefits associated with distributed solar.
Figure 1. Typical Solar PV Benefit and Cost Categories1
1 Derived from RMI “A Review of Solar PV Benefit and Cost Studies” by ICF. www.rmi.org/Knowledge-Center%2FLibrary%2F2013-
13_eLabDERCostValue
2 icfi.com ©2014 ICF International, Inc.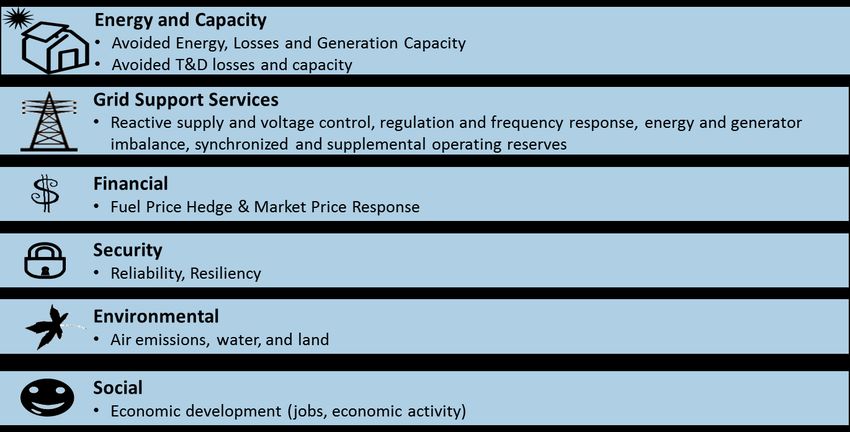
A recent ICF study reviewed five of the VOS studies included in RMI’s analysis and found them lacking in
    consistency, key value and cost components, and transparency. Figure 2 below shows the wide range of
    VOS estimates in these studies—from $50/MWh to over $250/MWh - as well as the benefit and cost
    estimates by category.
    Most of these recent VOS studies also do not capture and consistently value the true cost and benefit of
    integrating solar DG into the system. Specifically, these studies often overlook the need to maintain
    reliable electric service to the end-use customer, as well as the fact that the grid is the enabling
    mechanism for DPV.
    For the majority of the public VOS analysis reviewed here, benefits consistently manifested themselves in
    avoided energy and capacity purchases as well as transmission and distribution (T&D) impacts. Categories
    such as financial risk, grid support services and reduced security risk were valued in some, but not in other
    studies. The difference in estimations and exclusion of value components from multiple VOS studies
    further emphasizes the need for more consistent methods in valuing solar.

    Figure 2. Recent VOS Studies2: Range of VoS Cost and Benefit Price Estimates

                 $300
                                                                                                                                 5
                 $250
                               # of studies valuing each component is noted at end of
                 $200
                                5
                 $150
                                                                2                                           3
                 $100                      5
         $/Mwh

                   $50                                5                               1          3
                                                                           2
                    $-
                  $(50)
                 $(100)
                 $(150)                                                                                                2
                 $(200)
                                                          Cost & Benefit Value Components

     2   List of Studies Considered: CPRTX - The Value of Distributed Solar Electric Generation to San Antonio. Clean Power Research, 2013;
         CPRNP - The Value of Distributed Solar Electric Generation to NJ and PA. Clean Power Research, 2012; SAICAZ - 2013 Updated Solar
         PV Value Report (for Arizona). SAIC, 2013; CBEAZ - Evaluating the Benefits and Costs of Net Energy Metering in CA. Crossborder
         Energy, 2013; CBECA - Evaluating the Benefits and Costs of Net Energy Metering in AZ. Crossborder Energy, 2013.

3    icfi.com                                                                                             ©2014 ICF International, Inc.
Incompatible Peak Loads
The vast majority of customers who install solar DG will still rely on the grid to absorb the excess generation from
solar PV in the middle of the day when the solar system is producing its peak power (and household consumption
is typically low). The grid is also needed to reliably and consistently deliver electricity in the evenings when solar
generation is non-existent (and when household electricity consumption is typically high). Figure 3 from a
residential system in Southern California highlights this challenge.
Figure 3. Illustrative DPV Generation Profile vs. Customer Load
Storage is changing this, but very slowly, and it is impractical to expect millions of solar PV deployments to install
storage and depart from the grid in the near to mid-term. Emphasis therefore must be placed on the cost of
maintaining reliable electric service to all end-use customers. While solar brings incremental value to the system
when locational generation is needed, the maintenance of the grid also brings significant value to the end-use
customer.
Our Proposed Approach to VOS
Fully capturing the value of distributed solar generation requires:
1. An analysis of some of the “traditional” components of VOS analysis;
2. Treatment of DPV as a locational generation resource and not as a decrement to load.
The following framework presents an objective overview and methodology for VOS studies that addresses
these requirements. It places the critical and material categories previously used in VOS studies into clear
definitions and provides a framework to evaluate both the costs and benefits of integrating distributed
generation of all types (Solar PV, CHP, storage) onto the grid.
Energy. Avoided generated energy represents the most straight-forward calculation across existing
VOS studies. The premise is that energy generated from solar DG installation displaces generation from
the grid. Current VOS studies generally assume that solar DG displaces gas-fired combined cycle
resources over the daily generation profile of the solar resource. While a more accurate estimate could
be obtained using hourly dispatch modeling to determine the marginal resource in each hour, this is a
reasonable assumption given the relatively low levels of DPV penetration on the grid. As DPV
penetration rates increase, however, a more rigorous analysis involving dispatch modeling may be
required in areas where other resources might be displaced.
4 icfi.com ©2014 ICF International, Inc.Overall, while some of the studies we examined identified high avoided energy costs due largely to
inflated natural gas price assumptions, there is generally little disagreement about avoided energy
costs for VOS.
– Methodology: The best way to quantify energy value would be at the margin, to account for the
true value of the displaced resource. Therefore, these values are dependent on the time of day
and month, the generation fleet and energy costs, assumed load growth, and planned generation.
In the interim, a more simplified approach may be considered.
Utilities should ideally develop appropriate time of delivery values for the energy component of
supply and consider publishing time of use prices that convert the marginal resources into a time
differentiated tariff.
Avoided/Deferred Generation Capacity. Unlike calculating displaced energy from DPV, valuing avoided
capacity is both more complicated and often overstated in many existing VOS analyses. Avoided
generation capacity is the amount of capacity (MW) that can be deferred due to the DPV installation,
and its value hinges on two central factors.
First is the correlation between the host facility’s (and potentially the broader system’s) load profile
and that of the DPV resource. This correlation is fundamental to understanding the role of DPV in
avoiding the need for new capacity. For example, a DPV generation profile that is fully correlated with
the customer’s or system’s load would indicate that 100% of the capacity could be avoided. Anything
less than a full correlation would indicate that the capacity value assigned to DPV should be discounted
in proportion to the mismatch between the loads.
The second central factor is the relative value of the capacity being avoided. Many markets have
traditionally used the Net Cost of New Entry (CONE) values, which is the leveled cost of a new gas unit
(typically a simple cycle gas turbine, but potentially a gas combined cycle unit) minus the energy
revenues that the unit is expected to see in the market. The higher the energy revenues, the lower the
required capacity payment needed to support the capacity value of the unit.
Capacity credit measurements for DPV have ranged widely across previous VOS studies. This capacity
credit assigned to DPV is highly dependent upon the correlation between the DPV output and the load
of the host facility and the broader wholesale generation system. The majority of previous studies
discount the capacity credit assigned to solar DG to account for this correlation, but do not fully reflect
the correlation between solar PV generation and load as illustrated in Figure 3 shown earlier.
Some of the recent studies we reviewed applied a capacity credit of over 90 percent, while others
provided a capacity credit as low as 21 percent. While this is clearly a location-dependent factor –
influenced by solar insolation, typical panel direction, host facility and system load and distribution
feeder load profile - such a wide range of capacity credit, particularly with capacity credits of over 90
percent, seems highly improbable. In general, one would expect the capacity correlation to be lower
for residential systems, where peak demand typically occurs in the evening hours, when solar
insolation has dwindled, and higher for commercial systems, where load is generally more correlated
with solar PV generation.
In addition, almost all of the recent studies we examined valued the avoided capacity at full Net Cost of
New Entrant (CONE) values – typically at levels of around $100/kW-yr. This is problematic in two ways.
First, most power markets in the US today are generally oversupplied (“long”), due to the remnants of
the recession and aggressive and successful EE and DR penetration of the markets. Because of this,
assigning the avoided capacity cost at $100/kW-yr. does not reflect the current market dynamics of
similar generating assets. As shown in Figure 4, with the exception of ERCOT, the reserve margin for
other regional transmission organizations (RTOs) is easily covered even with announced retirements.
5 icfi.com ©2014 ICF International, Inc.Figure 4. Reserve Margins for Select US ISOs/RTOs
This is further reinforced by the results of the last PJM auction, which saw a significant increase in the
RTO price to $44/kW-yr. – a result that many considered relatively robust in today’s low load growth
market, but still significantly lower than the traditional CONE value of $100/kW-yr. Second, power
markets may have entered a new era in which lower CONE prices are the new reality as brownfield
sites are redeveloped. When combined with low financing costs and low gas prices (both Henry Hub
and delivered), it results in lower capital and energy costs for new gas units, leading to lower CONE
values over time.
– Methodology: In order to correctly value the avoided capacity benefit of DPV projects, there
needs to be a realistic analysis of the correlation between customer and system peak as well as an
analysis of the DPV’s generation profile to accurately assign a DPV system capacity credit. RTO’s
and ISO’s have been doing this for some time with central station renewable projects. The same
process should be applied to DPV projects, with the added complication that penetration rates on
distribution system feeders also need to be included.
Actual current and forecast market conditions should also be used to calculate the capacity
payment - similar to those used in utility IRP and other market valuation efforts. Over time,
markets will start to tighten due mostly to relatively low natural gas prices and environmental
capex requirements on units, forcing coal retirements. The subsequent market constriction will
eventually make new capacity more attractive, with a premium going to dispatchable and fast-
ramp resources to account for the increase in solar resources as the afternoon sun sets. 3 Similar
to the energy component of the VOS, utilities should develop annual capacity values to be
included in VOS calculations.
Avoided Transmission and Distribution (T&D) Losses and Capacity. The avoided T&D losses and
capacity component of the VOS refers to two distinct issues. One is the T&D infrastructure that can be
avoided or deferred due to the reduced need to supply a customer that consumes power generated on
his or her rooftop. The second is the T&D losses that can be avoided by consuming power adjacent to
the point of consumption, as opposed to needing to transmit it long distances from a central
generating facility.
3
See the much publicized “duck curve” at www.caiso.com/documents/flexibleresourceshelprenewables_fastfacts.pdf
6 icfi.com ©2014 ICF International, Inc.Many VOS studies assign a material value to the avoided T&D losses associated with generating power
at the point of load – much in the way that one would value the avoided T&D value of energy
efficiency. Recent studies assign a wide range of values, though there is some debate on a number of
them, including:
– If the T&D deferral should be valued on an average versus a marginal basis
– If energy losses should be evaluated, and if so, whether it should be done on a peak versus all-
hours basis
– Should transmission and distribution be treated as two distinct systems, or as effectively one
When averaging – either across hours, the T&D system, or both – the benefits of avoided T&D losses may
not be accurately depicted, depending on how simple average values are applied. The complexity of the
T&D system dictates that any approach must take into account the locational and temporal value of the
deferred investment as well as the line losses. This complexity however, needs to be balanced with the
feasibility of implementation to provide a practical result. If the solar DG system is generating power in
full correlation with host facility load and therefore offsetting all grid purchases, then it may be
appropriate to account for avoided T&D losses. If, however, solar generation and host load are only
partially correlated, then the avoided T&D losses, like the capacity value, should be prorated accordingly.
The same is true for potential deferred T&D expenditures. If distribution system feeders are indeed
unloaded as a result of a high correlation between solar generation and host facility load, and
depending on the needs of the area, the VOS should capture that deferred T&D equipment value on a
feeder by feeder basis. If profiles do not match or if T&D capacity additions cannot be deferred, then
this also needs to be accurately depicted, with little or no value assigned to T&D deferral.
There is also a cost to T&D from DPV. The cost to the grid is the infrastructure and operations that will
be necessary to manage the increasing penetration of DPV while maintaining a reliable level of
electrical services to the utility customer. These costs may include changes to existing capacitors and
load tap changers, additional breakers or reconductoring existing lines. Other costs, while not explicitly
T&D, would be any frequency support or load following services to manage the amount of intermittent
resources to continue to maintain services.
As solar penetration increases, electricity generated by solar DG may flow back up through the substation
onto the bulk power system substation, potentially leading to unintentional islanding of the feeder or
segments of the feeder. In essence, the feeder would be energized by the solar facility and not in-control
by the utility.4 Many believe that even if the solar generation and the load at the host facility are not fully
correlated (See Figure 4), there will be load in the neighborhood that will absorb the excess generation
from that one site. In this context, it is important to evaluate the capacity, load profile of the feeders, the
location of load centers, and solar PV along the distribution circuits and not assume generalized
concentration levels. PG&E, for example, has found that in areas of their service territory with the highest
DG penetration, residential DPV on average exports 50 percent of the power generated to the grid.
– Methodology: For the T&D portion of the grid, DPV potentially represents both a benefit and a
cost. Both of these impacts need to be included and separately assessed as part of a VOS analysis.
As a benefit, the most straightforward parts of this calculation are the avoided losses of T&D due
to the reduction in generation and the need to transport that energy to specific premises or
feeders. This benefit is on a marginal basis, not on an average basis. The challenge in accurately
quantifying this factor is that losses depend on the location of the DPV generation on the feeder
and the impact on off-setting load.
4 Seehttp://energy.sandia.gov/wp/wp-content/gallery/uploads/SAND2012-1365-v2.pdf for a detailed explanation on the causes of
feeder unintentional islanding due to solar PV penetrations
7 icfi.com ©2014 ICF International, Inc.DPV may defer construction costs and other capacity upgrades by reducing the overall feeder
load. But like avoided losses, this analysis needs to take place on a feeder by feeder basis or,
potentially more practically, feeders should be grouped by their load profiles and capacities into
prototypical groupings. Once this step has taken place and the feeders have been identified that
would benefit from DPV installations, the avoided losses and avoided T&D capital can be
calculated and optimized.
As part of the value analysis, the VOS should also adequately address and explicitly state any T&D
costs that will be incurred as a result of DG deployment. Addressing T&D costs involves the same
careful analysis of where DPV will be deployed versus the load centers being served, as well as
understanding the different feeder characteristics. This means understanding not just the overall
penetration levels, but the potential concentration of DPV resources, and assessing and
forecasting when they export to the distribution grid. As previously discussed, DPV and other
distributed generating assets, while reducing load and creating a T&D benefit, also export to the
distribution system. At high enough concentration and penetration levels, DPV energy exports
may become problematic in terms of voltage stability if there are not enough loads on the feeder.
To accomplish this valuation, we suggest a systematic review of site-specific DPV analysis to
highlight where DPV deployments are most likely to cluster, an analysis of the capacity of those
feeders where the solar is located, and a review of the impact on distribution equipment or
additional utility monitoring and control equipment to manage the additional distribution assets
during low load periods of the day. The practicality of the number of feeders evaluated needs to
be accounted for, and it may be most practical to develop prototypical feeder analyses for
representative feeder types, customer loads, and DPV penetration levels.
Example from Los Angeles County
ICF performed an analysis of varying degrees of DPV concentration and penetration levels on a network
of distribution feeders in Los Angeles County which demonstrated the importance of understanding the
correlation between DPV generation, feeder load and the resulting impact on voltage violations (See
Figure 5).
Figure 5. Time Series Analysis (Typical Summer Day) with Solar PV at High Load Locations1
8 icfi.com ©2014 ICF International, Inc.Grid Support Services.
DPV and other forms of distributed generation can provide distribution support services if they have the
hardware, software, the excess capacity to provide these services, as well as an ability to react to signals
from a distribution management or supervisory control and data acquisition (SCADA) system. For the vast
majority of DPV systems this is not the case, and in many instances the international standards (e.g. IEEE
1547) may not allow it. Only a few of the VOS studies ICF examined provided a value to the potential grid
support services that DPV can provide either through reduced load (i.e. a reduction in the need for
ancillary services) or through smart inverters providing grid support. 5 A recent study from the DOE
indicated that based on the intermittency of the solar PV resource and the difficulty in forecasting its
availability, additional generating capacity would actually be needed to firm up solar resources 6.
Considering the intermittency of DPV, it is highly unlikely that electric utilities would need to reduce their
purchases of ancillary services.
The ability of DPV resources to contribute is still evolving. The vast majority of DPV and their inverters are
unable to react autonomously to a grid event (e.g. low voltage ride through) or report when a DPV’s
inverter reacts to a grid event (e.g. exporting volt-amperes reactive—“vars”), and the ability to monetize
the value of these services is still developing. Even the fairly straightforward ability for an inverter to
perform a low voltage ride-through and not trip off under low-voltage scenarios is still evolving within the
IEEE (e.g. IEEE 1547) standard bodies and regulatory interconnection rules (e.g. Rule 21 in California).
Finally, location and distribution feeder characteristics are also drivers of value for any grid support
services. As penetration levels increase and managing distributed energy resources like solar PV and
storage becomes more integrated, advancements in systems like distributed energy resource management
systems (DERMS) will become increasingly important in valuing the costs and benefits of these systems.
– Methodology: Setting up a framework for DPV providing grid support is critical. In the long term,
DPV and other DG assets will replace other utility hardware and grid support services provided by
traditional utility owned and controlled distribution assets (e.g. capacitor banks). Open questions
still exist across different regions as to who would be responsible for monitoring and controlling
the DPV: the local distribution utility, the RTO, an aggregator of grid support services, or a
combination of these entities. As previously mentioned, there are also currently no markets or
tariffs for these services. Based on the high amount of uncertainty on this variable, we believe
that Grid Support Services should not be included in a VOS calculation for potential payment but
should be reviewed for the potential to determine the mechanisms that may need to be in place
to monetize any potential value when the appropriate technology exists.
Environmental: The deployment of DPV has environmental value as an emissions-free source of
generation for the amount of fossil fuel-fired generation it displaces from the grid. Since many VOS
analyses assume that the displaced generation is coming from combined cycle gas generation, the
avoided emissions are assigned a similar value – generally around 800 to 1000 lb. CO2/MWh,
depending on the efficiency of the combined cycle unit. Going forward, as central station renewables
and DPV penetration on the grid increases, more detailed analysis should be performed to determine
the emissions characteristics of the marginal unit being displaced. This unit could be natural gas, coal,
wind, hydro or even other renewables.
5 Smart inverters are AC to DC inverters with enhanced functionality like dynamic reactive power control and low voltage ride
through to enhance grid stability, not decrease it. See also http://www.greentechmedia.com/articles/read/western-utilities-call-
for-smart-solar-inverters
6
DOE, Sandia Study http://emp.lbl.gov/sites/all/files/lbnl-6525e.pdf
9 icfi.com ©2014 ICF International, Inc.The VOS studies evaluated to date use a range of carbon values ($/ton) to multiply by the avoided
emissions rate to generate a $/MWh value of the CO2 emissions displaced by the DPV. These range
from single digit numbers to well over $40/ton. In some instances, the suggested values used in
previous VOS studies are similar to those used by utilities and Public Utility Commissions to evaluate
new resources in utilities’ IRPs or to represent other values, including the social cost of carbon. The
studies assigning the highest environmental values assumed that existing coal-fired generation will be
displaced by solar PV just as much as gas-fired generation. In most cases, however, generation from
marginal gas-fired units will be disproportionately displaced. Additionally, VOS studies with the highest
value of carbon did not fully account for current market dynamics, regulations, or emission reduction
technologies that might occur in the future.
– Methodology: As a generation resource on the grid, DPV should be evaluated in the same way as
any other new resource, including central station renewables, in terms of environmental costs
and benefits that it confers upon the system. The emissions (in this case CO2) values assigned on
a $/ton basis should be similar to those used to evaluate other power generation resources. With
EPA’s proposed Clean Power Plan under Section 111(d) – New Source Performance Standards, all
states will need to develop a compliance regime to attain the emission rate targets for existing
units as defined by EPA.7 As the ultimate compliance mechanism will be developed at the state
level, and may or may not result in a market-based (i.e., flexible) approach that would result in an
explicit value for CO2, how these rules are developed and implemented at the state level is clearly
going to be a consideration that will need to be taken into account going forward when evaluating
any renewable resource, including DPV.
RMI Categories Not Included in ICF VOS Methodology
We believe that the below categories listed in the RMI metadata analysis should not be part of a VOS estimate.
Below is a description of these categories and our reasoning for exclusion.
Financial. Some VOS analyses assign value to what is termed the “Financial” category of benefits: a fuel price
hedge, reservation of natural gas pipeline capacity, and/or a market price response. None of these factors is
typically accounted for in utility integrated resource planning (IRP) evaluations of new resources, including central
station renewables, or in cost-benefit evaluations of EE measures. While fairly small in the three studies reviewed,
as with other energy-based values, these DPV need to be forecasted to increase their predictability, repeatability
and value in an IRP.
Social. For social benefits, some studies highlight the positive impact that DPV will bring to the local economy.
These values are not included in the construction of utility scale conventional or renewable projects. Job growth
and diversifying the work force is important, but placing a value on these factors and compensating an owner of a
DPV facility, unless part of a public policy goal to encourage local employment or the installation of solar, should
not be part of a VOS. With over 1.8 million behind-the-meter installations forecasted to be installed cumulatively
by 2018, distributed Solar PV is no longer an emerging technology. Providing benefits to DPV that are not
provided to other central station renewables is inconsistent.
Security. Increased reliability is often touted as a major benefit for DPV adoption in the popular press, but only
one of the five studies we reviewed included this measure in its valuation. Like many other distributed resources,
when DPV is able to isolate from the grid or “island,” it can provide reliability to the owner of the facility. This
value, however, does not accrue to society or even the local grid. In the past, large C&I facilities with DPV and
other forms of distributed generation have provided support to the local community in the wake of natural
disasters. But to date, there is no accurate or consistent way to account for these typically private resources.
7 The proposed plan was published in the Federal Register on June 18 th, 2014, and EPA is working to develop a final rule by June
2015. While aspects of the proposed rule will undoubtedly change as it is finalized, it will be the first time that CO2emissions from
the power sector are regulated under the Clean Air Act.
10 icfi.com ©2014 ICF International, Inc.Central station and large generating assets should coordinate with one another through an RTO and distribution utility
in order to provide optimal grid resiliency. In contrast, it has been suggested that DPV should provide a degree of
resiliency to the grid by diversifying the generating assets in terms of supply and location; however, DPVs have neither
the scale nor the communication infrastructure to coordinate and provide resiliency value. DPV’s impact on reliability
and resiliency is evolving as utility communication to these assets improves, and as strategies to recover costs or
monetize the value of DPV to distribution feeders, community and utilities are developed. These values will be
realized and likely maximized by the utility in determining appropriate locations and services.
Individually-owned systems that can be islanded have a value, but the value accrues to the owner of the system, and
therefore it should not be part of a VOS calculation. If DPVs are able to be controlled and managed by the electric
utility—along with other grid stabilizing equipment on a feeder basis similar to a micro grid—then there is locational
value. This should be estimated and included in a VOS analysis as a resource that is rarely used but, when it is, brings
significant value.
Frequency to Update VOS:
One very clear item missing from reviewed VOS studies is the suggested frequency to update a VOS for
existing and new systems. Minnesota reviewed this concept and determined that the value of solar tariff
for existing systems is the life of the solar PV system, or approximately 20 years. The VOS tariff for new
systems however, would be updated annually. 8 Conversely, Austin Electric has established an effective
annual updating process for their VOST for both existing and new DPV systems.
The VOS will evolve over time as the penetration of DPV systems increases and managed load and
eventually storage becomes more widely dispersed and integrated with DPV. If the electricity generated by
a rooftop DPV system is fully consumed on-site and that household or business never exports energy, then
the avoided cost of electricity from the grid is a straightforward means to recoup the customer’s
investment. However, as DPV-generated power is exported to the grid, the avoided cost of electricity
becomes less relevant and there is a need to more comprehensively understand the benefits as well as the
cost of the electricity generated by the DPV system. We believe that the methodology outlined above goes
a long way to providing a comprehensive and objective framework. However, based on adoption patterns,
the utility should update the VOST on a locational basis for new installations yearly to address the
changing amount of solar or energy use in different areas.
Updating the VOS will require that the utilities understand in advance different DPV adoption scenarios for
specific feeders and communicate these scenarios effectively to the installation community. California is
attempting to do this through language in AB327, a bill that was signed into law in the fall of 2013. In the
law, language specified that the utilities are required by July 1, 2015 to develop a distribution resource
plan to identify “…optimal locations for the deployment of distributed resources…this evaluation shall be
based on reductions or increases in local generation capacity needs, avoided or increased investments in
distribution infrastructure…or costs to the ratepayers of the electrical corporation.”
Many of the same variables we believe should be included in a VOS, but in the case of California AB327,
these values become part of a distribution resource plan that is made available and updated on a periodic
basis to reflect the changing landscape of distributed generation installation.
8
http://mn.gov/commerce/energy/images/MN-VOS-Methodology-FINAL.pdf, page 6.
11 icfi.com ©2014 ICF International, Inc.Conclusion
In order to get the Value of Solar “right,” a consistent and comprehensive methodology is needed for
calculating avoided generated energy, avoided generation capacity, T&D losses and capacity deferrals, grid
support services, and environmental values. VOSTs should be updated periodically to reflect existing and
new systems. Furthermore, DPV must be treated not simply as a decrement to the system, but as a system
resource. Customers who have installed DPV should be viewed as contributing generation to the grid at
time of export and also as retail customers when they are not exporting during the majority of the year.
Traditional evaluation parameters such as those applied to central station resources, including renewables,
should be applied. Avoided generation, capacity, and T&D should be correctly accounted for within the
system at the location of the asset, and not just from aggregated and isolated distribution perspectives.
This is increasingly important as distributed generation of all types continues to deliver costs and value to
the grid based on the locational nature of the distribution feeder and its segments. Environmental benefits
also need to be included in VOS calculation using the marginal resource avoided, which may be a gas fired
simple cycle or combined cycle combustion turbine, but could also be any type of generating unit .
Therefore, an analysis of the utility’s energy supply should be prepared and reviewed.
Values that should not be part of a VOS calculation are those that would not be considered part of the
valuation of a generation asset or those that are not yet available in the market – specifically financial
hedging and societal benefits. Security benefits should be explored to value resiliency at specific critical
societal locations. However, they should not yet be included in the VOS calculation until a set and agreed -
upon methodology for resiliency is developed. Grid support services should be included once technologies
and a means to actively coordinate with distributed generators like DPV has been established consistently.
A VOS approach moves beyond NEM and makes much more sense, but studies to date have often been
less rigorous and thorough, ignoring the infrastructure that needs to be in place to manage the DPV and
capture the value. A strong VOS approach, in which the real costs and benefits to the system are
accurately portrayed and valued, is not only a useful tool for integrating increasing amounts of DPV onto
the grid, but will be critical for utilities, regulators, and other stakeholders to make rational planning and
risk management decisions.
For questions, please contact:
Steve Fine +1.703.934.3302 steve.fine@icfi.com
Kiran Kumaraswamy +1.703.934.3623 kiran.kumaraswamy@icfi.com
©2014 ICF International, Inc.
Any views or opinions expressed in this paper are solely those of the author(s) and do not necessarily represent those of ICF International.
This White Paper is provided for informational purposes only and the contents are subject to change without notice. No contractual
obligations are formed directly or indirectly by this document. ICF MAKES NO WARRANTIES, EXPRESS, IMPLIED, OR STATUTORY, AS TO THE
INFORMATION IN THIS DOCUMENT.
No part of this document may be reproduced or transmitted in any form, or by any means (electronic, mechanical, or otherwise), for any
purpose without prior written permission.
ICF and ICF INTERNATIONAL are registered trademarks of ICF International and/or its affiliates. Other names may be trademarks of their
respective owners.
12 icfi.com ©2014 ICF International, Inc.About the Authors
Steve Fine is an expert on environmental markets and has led numerous multi-stakeholder
engagements, including the Edison Electric Institute, U.S. Climate Action Partnership, Regional
Greenhouse Gas Initiative (RGGI), and American Wind Energy Association (AWEA).
Ankit Saraf has four years of experience in electrical power, renewable energy, and carbon markets. He
has designed numerous economic models and has provided policy reviews to aid decision making for
multinational corporations, local organizations, and U.S. government agencies.
Kiran Kumaraswamy has expertise in transmission planning studies, transmission asset valuation, due
diligence, locational marginal price (LMP) forecasting, merchant transmission investment assessment,
and power systems modeling.
Alex Anich is Senior Associate at ICF International and has over a decade of finance experience in the
energy industry. Mr. Anich joined ICF to work on expanding the Distributed Energy Resources business.
About ICF International
ICF International (NASDAQ:ICFI) provides professional services and technology solutions that deliver
beneficial impact in areas critical to the world's future. ICF is fluent in the language of change,
whether driven by markets, technology, or policy. Since 1969, we have combined a passion for our
work with deep industry expertise to tackle our clients' most important challenges. We partner with
clients around the globe—advising, executing, innovating—to help them define and achieve success.
Our more than 4,500 employees serve government and commercial clients from more than 70 offices
worldwide. ICF's website is www.icfi.com.
EAS WPR 1014 0313
13 icfi.com ©2014 ICF International, Inc.You can also read