Corporate Presentation - November 13, 2020 - Zenabis
←
→
Page content transcription
If your browser does not render page correctly, please read the page content below
Corporate Presentation
                        November 13, 2020

TSX: ZENA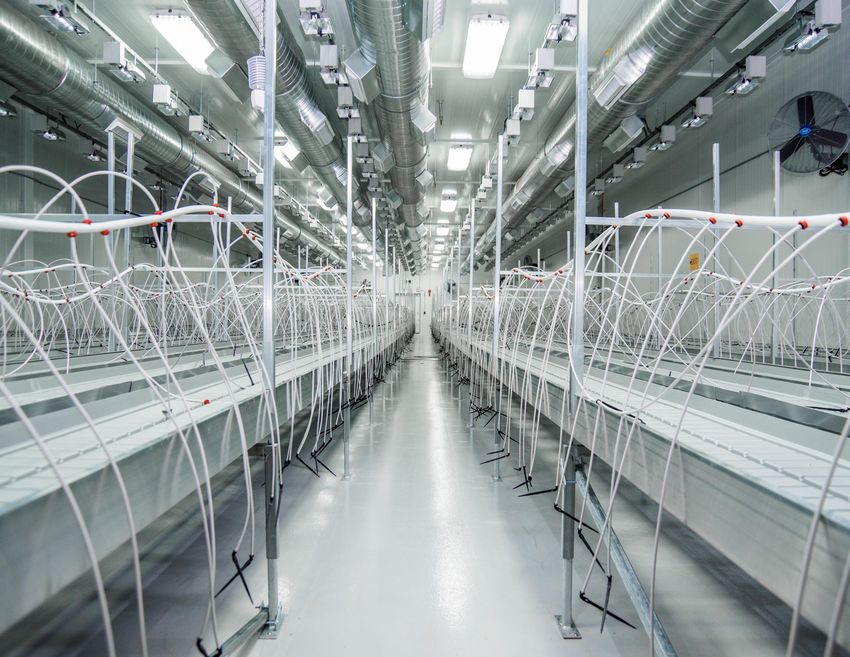
Disclaimers

IMPORTANT: YOU MUST READ THE FOLLOWING BEFORE CONTINUING. The information contained in this document has been prepared by Zenabis Global Inc. (“Zenabis” or the “Company”). The information
contained in this document (a) is provided as at the date hereof and is accurate only as of the date of this presentation or the date indicated and is subject to change without notice, (b) does not purport to contain all the
information that may be necessary or desirable to fully and accurately evaluate an investment in the Company, including important disclosures relating to the terms of an investment and risk factors associated with an
investment in the Company and (c) is not to be considered as a recommendation by the Company that any person make an investment in the Company.

This presentation, and the information contained herein, is not for release, distribution or publication into or in the United States or any other jurisdiction where applicable laws prohibit its release, distribution or publication.
This presentation (“Presentation”) is being issued by the Company for information purposes only. It is information in a summary form and does not purport to be complete. It is not intended to be relied upon as advice to
investors or potential investors and does not take into account the investment objectives, financial situation or needs of any particular investor. Reliance on this Presentation for the purpose of engaging in any investment
activity may expose an individual to significant risk of losing all of the property or other assets invested.

This Presentation is not a prospectus, offering memorandum or an advertisement and is being provided for information purposes only and does not constitute or form part of, and should not be construed as, an offer or
invitation to sell or any solicitation of any offer to purchase or subscribe for any securities in Canada, the United States or any other jurisdiction. Neither this Presentation, nor any part of it, nor anything contained or referred
to in it, nor the fact of its distribution, should form the basis of or be relied on in connection with or act as an inducement in relation to a decision to purchase or subscribe for or enter into any contract or make any other
commitment whatsoever in relation to any securities of the Company. Recipients of this Presentation who are considering acquiring securities of the Company are reminded that any such purchase or subscription must not
be made on the basis of the information contained in this Presentation but are referred to the entire body of publicly disclosed information regarding the Company. This Presentation is qualified in its entirety by reference to,
and must be read in conjunction with, the preliminary prospectus supplement dated September 18, 2020 (the “Prospectus Supplement”) to the Company’s final short form base shelf prospectus dated April 9, 2019 (the
“Shelf Prospectus”) and the Company’s annual information form dated March 30, 2020.

Certain information contained herein includes market and industry data that has been obtained from or is based upon estimates derived from third party sources, including industry publications, reports and websites. Third
party sources generally state that the information contained therein has been obtained from sources believed to be reliable, but there is no assurance or guarantee as to the accuracy or completeness of included data.
Although the data is believed to be reliable, neither the Company nor its agents have independently verified the accuracy, currency or completeness of any of the information from third party sources referred to in this
presentation or ascertained from the underlying economic assumptions relied upon by such sources. The Company and its agents hereby disclaim any responsibility or liability whatsoever in respect of any third party
sources of market and industry data or information. This Presentation has not been independently verified and the information contained within may be subject to updating, revision, verification and further amendment. While
the information contained herein has been prepared in good faith, except as otherwise provided for herein, neither the Company, its directors, officers, shareholders, agents, employees or advisors give, has given or has
authority to give, any representations or warranties (express or implied) as to, or in relation to, the accuracy, reliability or completeness of the information in this Presentation, or any revision thereof, or of any other written or
oral information made or to be made available to any interested party or its advisers and liability therefore is expressly disclaimed for any loss howsoever arising, directly or indirectly, from any use of such information or
opinions or otherwise arising in connection therewith. Except as may be required by applicable law, in furnishing this Presentation, the Company does not undertake or agree to any obligation to provide the recipient with
access to any additional information or to update this Presentation or to correct any inaccuracies or omissions. Information contained in this Presentation is the property of the Company and it is made available strictly for the
purposes referred to above.

CAUTIONARY NOTE REGARDING FORWARD-LOOKING INFORMATION: This document includes information, statements, beliefs and opinions which are forward-looking, and which reflect current estimates,
expectations and projections about future events, including, but not limited to the intended conversion, expansion and optimization of the Company’s facilities, the anticipated production capacity of the Company, the receipt
of required licenses to operate, our harvest forecast, and other statements that contain words such as "believe," "expect," "project," "should," "seek," "anticipate," "will," "intend," "positioned," "risk," "plan," "may," "estimate"
or, in each case, their negative and words of similar meaning. By their nature, forward-looking statements involve a number of risks, uncertainties and assumptions that could cause actual results or events to differ materially
from those expressed or implied by the forward-looking statements. These risks, uncertainties and assumptions could adversely affect the outcome and financial effects of the plans and events described herein. These
factors and risks include, but are not limited to, those described in the Shelf Prospectus and the Prospectus Supplement, copies of which are available on SEDAR at www.sedar.com, and could cause actual events or
results to differ materially from those projected in any forward-looking statements. Forward-looking information contained in this Presentation is based on our current estimates, expectations and projections, which we
believe are reasonable as of the current date. Such forward-looking information is provided for the purpose of providing information about management's current expectations and plans relating to the future. Investors are
cautioned that reliance on such information may not be appropriate for other purposes, such as making investment decisions and/or management's good-faith belief with respect to future events and are subject to known or
unknown risks, uncertainties, assumptions and other unpredictable factors, many of which are beyond the Company’s control. You should not place undue reliance on forward-looking statements, which are based on the
information available as of the date of this document and the Company disclaims any intention or obligation to update or revise any forward-looking information contained in this document, whether as a result of new
information, future events or otherwise, unless required by applicable law. The forward-looking information included in this Presentation is expressly qualified in its entirety by this cautionary statement.

Historical statements contained in this document regarding past trends or activities should not be taken as a representation that such trends or activities will continue in the future. In this regard, certain financial information
contained herein has been extracted from, or based upon, information available in the public domain and/or provided by the Company. In particular historical results of the Company should not be taken as a representation
that such trends will be replicated in the future. No statement in this document is intended to be nor may be construed as a profit forecast.

ELECTRONIC DISTRIBUTION: This document may have been sent to you in an electronic form. You are reminded that documents transmitted via this medium may be altered or changed during the process of electronic
transmission. You are responsible for protecting against viruses and other destructive items. Your receipt of this document by electronic transmission is at your own risk and it is your responsibility to take precautions to
ensure that it is free from viruses and other items of a destructive nature. As a consequence of the above, neither the Company nor any director, officer, employee or agent of any of them or any affiliate of any such person
accepts any liability or responsibility whatsoever in respect of any difference between the document distributed to you in electronic format and the hard copy version that is available to you.

                                                                                                                    1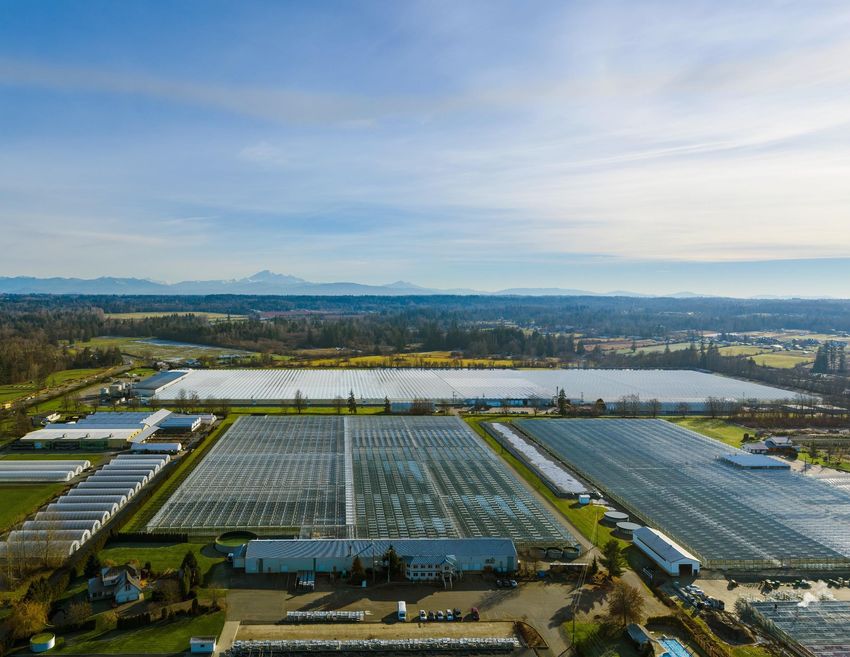
CORPORATE HIGHLIGHTS

                        Three Sequential Quarters of Positive Adjusted EBITDA

                                        Low Cash Costs of Cultivation Given Scale ($0.76/g)1

                                                      111,200 kg of Licensed Cultivation Capacity
                                                      Across Three Facilities

                                                                    Highly Recognizable Brands

                                                      Ongoing Shipments to Nine Provinces,
                                                      Three Territories, and Three International Destinations

                                       Propagation Business with ~$35m of Annual Revenue as of Q3 2020

                       61% Quarter-over-Quarter Cannabis Net Revenue Growth in Q3 2020

                                                                                2
Note: 1) Page 13 of Zenabis Q3 2020 MD&A dated November 13, 2020.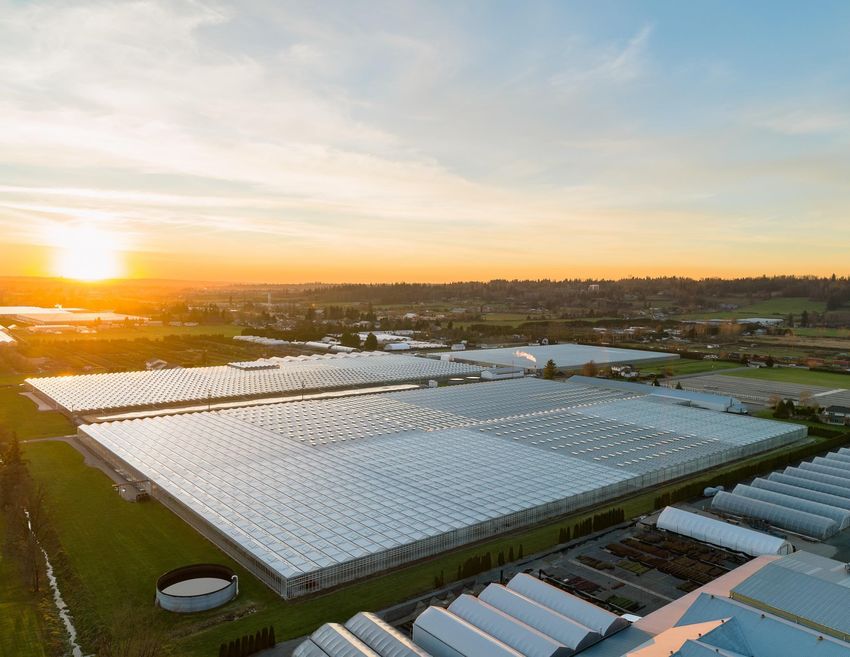
COMPANY SNAPSHOT

                                                                 Zenabis Global Inc. is a significant Canadian cultivator
                                                                 of medical and adult-use recreational cannabis, and a
                                                                    propagator and cultivator of floral and vegetable
                                TSX: ZENA                                               products.

▪ Significant Canadian Licensed Producer with a licensed annual            ▪ Founded in 1985
  production capacity of 111,200 kg                                        ▪ Wholly-owned subsidiary of Zenabis Global Inc.
▪ Operates three state-of-the-art facilities dedicated to cannabis         ▪ Successful 30+ year growing history in British Columbia,
  cultivation and processing                                                 Canada, specialized in the propagation of hundreds of unique
   ̶   Zenabis Atholville: One of the largest indoor facilities in           non-cannabis crops at an industrial scale
       Canada with a licensed capacity of 46,300 kg                        ▪ ~$35m of annual revenue as of Q3 2020
   ̶   Zenabis Langley: Large scale closed greenhouse facility             ▪ Over 2,000,000 sq ft. of operating space at three facilities:
       with a licensed capacity of 64,100 kg
                                                                              ̶   Zenabis Pitt Meadows
   ̶   Zenabis Stellarton: Fulfillment, processing and cannabis
       derivative products manufacturing centre                               ̶   Zenabis Aldergrove
                                                                              ̶   Zenabis Langley

                     Combined Adjusted EBITDA of ~$9.2m across both segments for the first three quarters of 2020

                                                                       3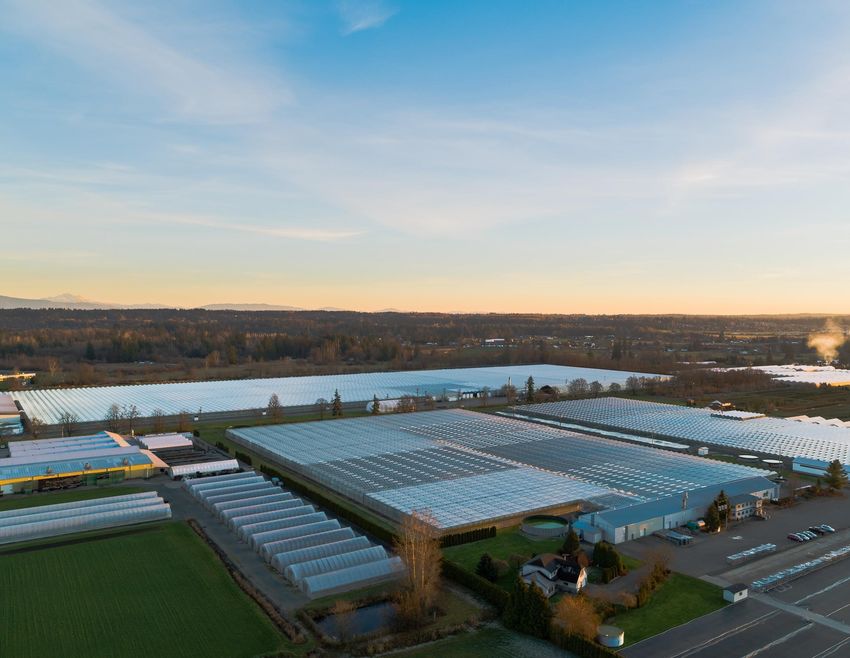
OUR FACILITIES
Zenabis' unique mix of facilities combines indoor and closed-greenhouse cultivation at scale with dedicated processing,
fulfilment, and value-add manufacturing centres

                                                              2. Zenabis Langley1                        3. Zenabis Stellarton
                                                                  Langley, British Columbia                   Stellarton, Nova Scotia

1. Zenabis Atholville                                                                                                                             4. Zenabis Delta
   Atholville, New Brunswick                                                                                                                       Delta, British Columbia

                                                             ▪ 2,100,000 sq. ft. greenhouse              ▪ 255,000 sq. ft. indoor facility
                                                             ▪ Licensed capacity: 64,100 kg              ▪ Licensed capacity: 800 kg
                                                             ▪ Licensed for cultivation and              ▪ Licensed for cultivation and
                                                               processing                                  processing.
                                                             ▪ Also used for propagation and             ▪ Received sales license in May
                                                               floral business                             2020, which allows for the sale
▪ 380,000 sq. ft. indoor facility                                                                          of dried/fresh cannabis and        ▪ 25,000 sq. ft. indoor facility
▪ Licensed capacity: 46,300 kg                                                                             other 2.0 products to authorized   ▪ Licensed for cultivation,
▪ Licensed for cultivation,                                                                                retailers                            processing, and sales
  processing, and sales                                                                                                                       ▪ Currently for sale
▪ EU GMP approval as of May 2020

   Zenabis Aldergrove                                                                                                                          Zenabis Pitt Meadows
 Aldergrove, British Columbia                                                                                                                  Pitt Meadows, British Columbia

▪ 453,000 sq. ft. greenhouse                                                                                                                  ▪ 218,000 sq. ft. greenhouse
▪ Used for non-cannabis                                                                                                                       ▪ Used for non-cannabis
  propagation business                                                                                                                          propagation business
▪ Licensed for industrial hemp                                             4                                                 1 3              ▪ Licensed for industrial hemp
  cultivation                                                                  2                                                                cultivation

                                                                                                     4
Notes: 1) The greenhouse to the right of the Zenabis Langley photo is not part of Zenabis Langley.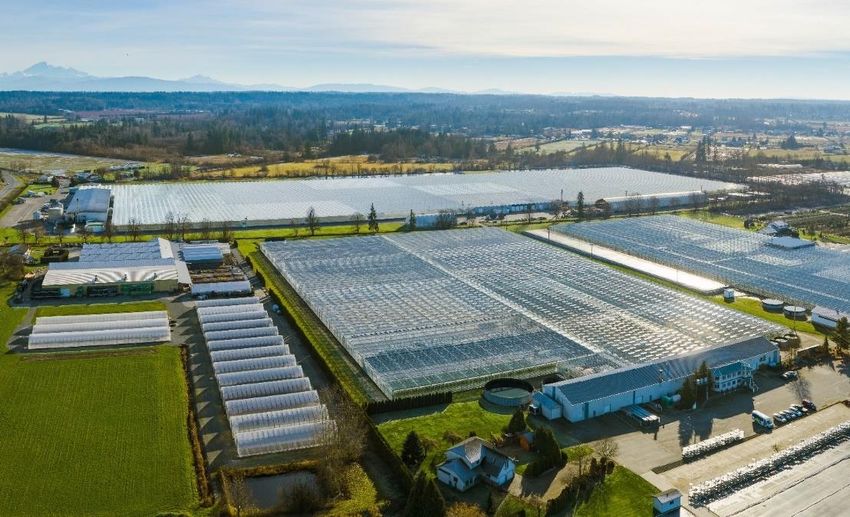
PRODUCTION FOOTPRINT
                                                                        Zenabis                               Zenabis                              Zenabis                              Zenabis                         Zenabis Pitt                          Zenabis
                                                                        Atholville                            Langley                             Stellarton                             Delta                           Meadows                             Aldergrove
                                                                          Atholville, NB                       Langley, BC                          Stellarton, NS                         Delta, BC                      Pitt Meadows, BC                      Aldergrove, BC

Parcel Size                                                            871,000 sq. ft.                   4,279,000 sq. ft.                       547,000 sq. ft.                      51,000 sq. ft.                     871,000 sq. ft.                    2,180,000 sq. ft.

Total Facility Space                                                   380,000 sq. ft.                  2,100,000 sq. ft.1                       255,000 sq. ft.                      25,000 sq. ft.                     218,000 sq. ft.                     453,000 sq. ft.

Current Licensed Capacity                                                 46,300 kg                            64,100 kg                               800 kg                                 N/A                                 N/A                                 N/A

Expected Capacity under
                                                                          46,300 kg                            64,100 kg                               800 kg                                 N/A                                 N/A                                 N/A
Existing Capital Program
Design Capacity
(if facilities fully built out and                                        46,300 kg                           96,100 kg2                               800 kg                                 N/A                                 N/A                                 N/A
converted as planned)

Extraction Design Capacity3
(if facilities fully built out and                                        15,000 kg                                 N/A                                   N/A                                 N/A                                 N/A                                 N/A
converted as planned)

Cultivation Cost                                                        $0.76/gram4                               TBD5                             Not relevant                               N/A                                 N/A                                 N/A

                                                                        EU GMP                               Cannabis
                                                                                                                                                  Cannabis
                                                                        Cannabis                            Cultivation6 +                                                                                               Propagation +                       Propagation +
Utilization                                                                                                                                      Cultivation6 +                      Listed for Sale
                                                                       Cultivation6 +                         Hemp +                                                                                                     Floral + Hemp                       Floral + Hemp
                                                                                                                                                Manufacturing7
                                                                        Extraction                          Propagation

Cultivation Format
                                                                               Indoor                               G      H                          Indoor                              Indoor                          G      H Outdoor                   G      H Outdoor

                                           Total Available Land                                               Total Max Development                                                                        Capacity
                                              8.8m sq. ft.                                                      Indoor / GH / Total                                                     Current Licensed Capacity:
                                     (2.4m sq. ft. available for hemp                                                                                                                           111,200 kg
                                                                                                                  0.7m / 2.8m / 3.5m sq. ft.                                            Total Potential: 143,200 kg
                                               cultivation)

                                                                                                                                           5
Notes: 1) Includes facility space under glass only; excludes additional warehouse space. 450,000 sq. ft. of Bevo’s existing greenhouses is expected to be initially converted to cannabis production space. The remainder is expected to continu e to be used for Bevo’s
propagation business, and may be converted into cannabis cultivation space on an as needed basis. 2) If all facilities are bu ilt out and converted as planned. Additional details on facility conversion, including additional assumptions are outlined in the Zenabis Global Inc. Final
Base Shelf Prospectus dated April 10, 2019 and filed on SEDAR. 3) Extraction estimates are annual, based on 20 days a month a nd based on kilograms of input material. 4) Average cost per gram as of Q3 2020. 5) Zenabis Langley is currently in ramp-up phase of
production and further license amendments from Health Canada are pending. 6) Includes the packaging of cannabis product. 7) M anufacturing of value-add products.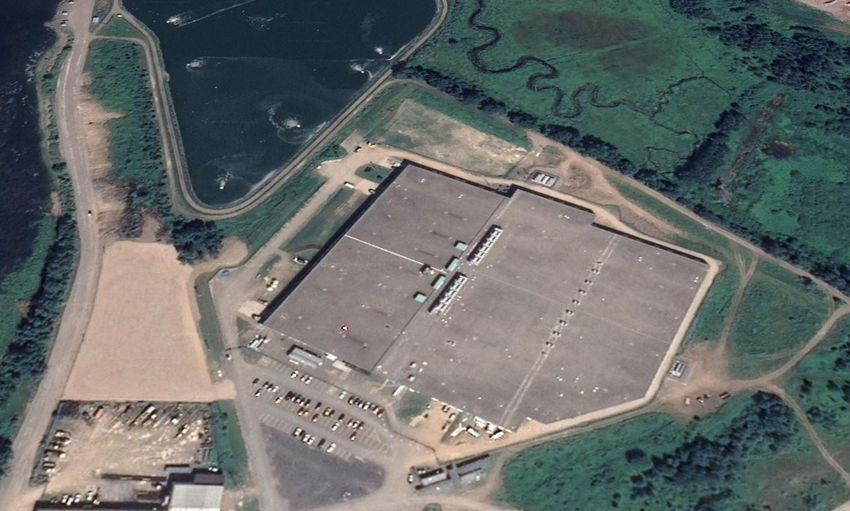
RECREATIONAL BRANDS

                      6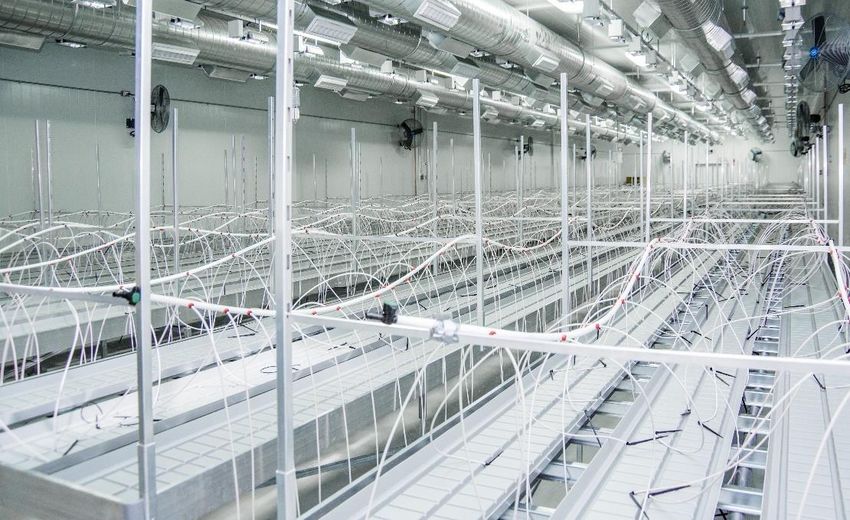
CANNABIS 2.0 PORTFOLIO
                                                        2.0 Products

PAX Vaporizing Cartridges   ▪   Zenabis has five types of PAX Era Pods
                            ▪   Zenabis is one of five Licensed Producers to launch PAX Era Pods (vaporizing cartridges) for PAX Labs Inc.’s high-
                                tech oil vaporizers
                                 ̶   PAX Era Pods are dependable, leak-resistant and clog-free, and are designed for use in PAX Era vaporizer
                                     devices
                                 ̶   PAX Era Pods are currently listed in eight Provinces

510 Vaporizing Cartridges   ▪   In July 2020, Zenabis launched its new line of Re-Up 510-thread vaporizing cartridges
                            ▪   Re-Up 510-thread cartridges are currently listed in seven provinces

        Gummies             ▪   Zenabis is currently in advanced stages of development for a new gummies product line
                            ▪   Initial products will included three types of gummies; these products have been listed in various provinces
                            ▪   Sale of gummies is expected to commence in late Q4 2020 or during Q1 2021

                                                                 7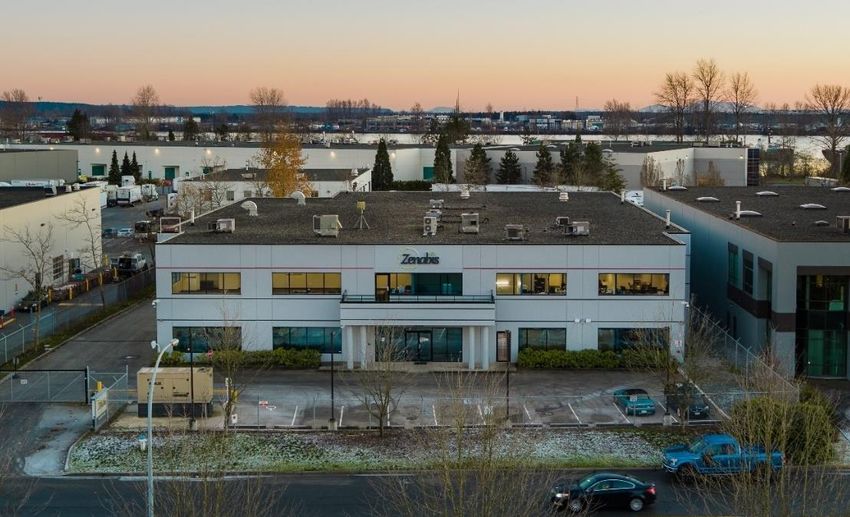
PRODUCT PORTFOLIO
                                              Current Products

  Dried Flower                   Pre-Rolls              PAX Vaporizing Cartridges    510 Vaporizing Cartridges

                  Oils                         Tinctures and Sprays                 Softgel Capsules

                           Future Products Under Consideration for Near-Term Launch

                 Edibles                           Gummies                               Hash

                                                       8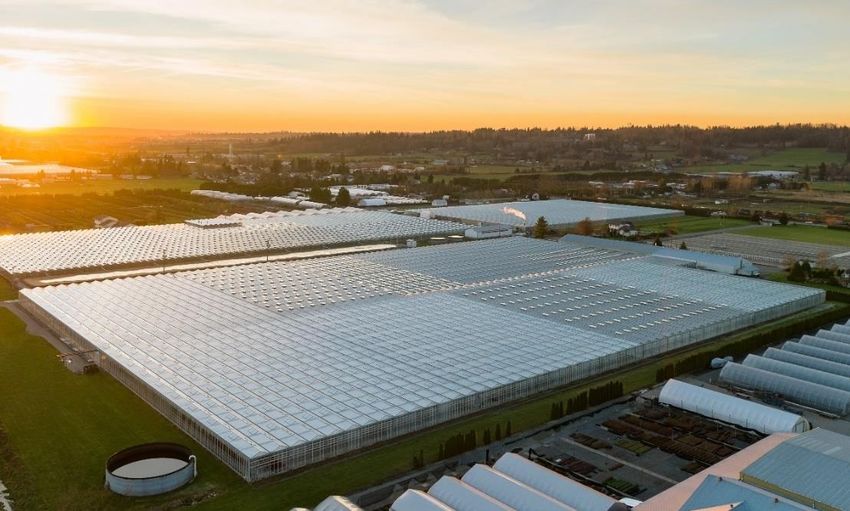
DOMESTIC PARTNERSHIPS AND DISTRIBUTION CHANNELS
Zenabis has developed a diverse set of partnerships and relationships with provinces1, distributors, pharmacies and First Nations.

                                                                           Supply agreement                                      Supply agreement
                                                                            primarily for oil                                  for medical cannabis
                                                                                                                                     products

             Yukon Liquor
              Corporation
                (“YLC”)                          Northwest                         Nunavut Liquor &
                                             Territories Liquor                        Cannabis
          Supply Arrangement
                                               and Cannabis                          Commission
                                                Commission                            (“NULC”)2
                                                 (“NTLCC”)                               Supply
                                           Supply Arrangement                         Arrangement
                                                                                                                                                                                   Expect first
                                                                                                                                                                                   shipments
                     Songhees First
                         Nation
                                                                                                                                                         Société                    Dec 2020
                                           Alberta Gaming,                                                                                           québécoise du
                        Investor               Liquor &                                                                                                 cannabis
                                              Cannabis                                                                                                 (“SQDC”)                                      PEI Cannabis
                     BC Liquor                (“AGLC”)                                                                                                                                               Management
                                                                                                                                                   Supply Arrangement
                    Distribution          Supply Agreement                            Manitoba Liquor                                                                                                 Corporation
                       Branch                                                          and Lotteries                                                                                              Supply Arrangement
                     (“BCLDB”)                                    Saskatchewan           (“MBLL”)
                 Supply Arrangement                                 Wholesale             Supply                    Ontario Cannabis
                                                                    Distributor        Arrangement                  Retail Corporation                   Listuguj Mi’gmaq
                                               Investment             Supply                                             (“OCS”)                            Government
                                                                   Arrangement                                            Supply                              Investor
                                                                                                                        Agreement                                                                         Nova Scotia Liquor
                                                                                                                                                                                                             Corporation
                                                                                                                                                                                    Alcohol New                (“NSLC”)
                                                                                                                                                                                 Brunswick Liquor         Supply Arrangement
                                                                                                                                                                                     (“ANBL”)
                                                                                                                                                                                 Supply Agreement             Millbrook First
                                                                                                                                                                                                                  Nation
                                                                                                                                                                                  Opportunities NB               Investor
                                                                                                                                                                                     Investor

                                                                                                               9
Note: 1) Supply arrangements do not contain purchase commitments or otherwise obligate the purchaser to buy a minimum volume of products from Zenabis. 2) Zenabis is an approved wholesaler to Nunavut; however, Nunavut is
currently finalizing its retail licensing process and Zenabis expects to start selling to the province in Q1 2021.
GROWING INTERNATIONAL DISTRIBUTION
Germany Malta Israel Australia
Zenabis, through ZenPharm (see
Zenabis has received conditional Zenabis has two ongoing Zenabis has entered into a binding
Malta) has entered into a binding
approval to develop a production and arrangements with counterparties in three-year supply agreement with an
supply agreement to commence
processing facility in Malta through Israel, with anticipated combined Australian pharmaceutical company
shipments to Germany through Malta
its joint venture ZenPharm. Revenue volume of greater than 1,000kg per to provide medical cannabis for sale
in Q4 2020
is expected in Q1 2021 subject to month on an ongoing basis, subject in Australia
ZenPharm’s receipt of its final to export permit receipt in any given
license month
10ZENPHARM
Zenabis has obtained EU GMP approval from its Malta-based European partner, ZenPharm Limited. Through this joint venture, Zenabis can
now supply the European medical market. Zenabis anticipates that the ZenPharm will commence sales in Q1 2021 subject to receipt of its
final license.
Europe
Zenabis receiving its EU GMP approval
is a significant milestone as it will
enable the company to supply bulk
dried medicinal cannabis flower to the
European market through ZenPharm
Atholville, New Brunswick, Canada Birzebbuga, Malta
Indoor Cultivation Facility Manufacturing Facility
11RECENT DEVELOPMENTS
Zenabis has significantly increased shipments domestically and internationally, diversified its product offerings, and delivered positive
Adjusted EBITDA throughout 2020.
Corporate Updates
EU GMP Approval and Term Sheet for
• Anticipated international non-GMP shipments expected to be 600kg in
Medicinal Cannabis to German Market
September and 1,000kg per month for the remainder of the year, subject to
• Received EU GMP approval for the
export permit receipt
Atholville facility
• Completed first shipment to Australia on August 28, 2020 and entered into long-
• Executed a binding term sheet with
term supply agreement with Australian distributor
Farmako GmbH to its subsidiary company,
Corporate Restructuring • Entered a one-year supply agreement with Canveda to provide 300-1,000kg of
ZenPharm
cannabis flower per quarter
Initiatives • Expected to supply a minimum of 500 kg of
• Reduction of overall • Completed first shipment of new Re-Up 510-thread vaporizer product line
EU GMP compliant bulk cannabis per year
workforce by 22% and for a term of three years
expected quarterly cash cost Appointment of Permanent Chief Executive Officer
savings of ~$2.0m • Announced appointment of Shai Altman as permanent Chief Executive
• Delta facility put up for sale Officer, effective September 1, 2020
• Mr. Altman has over 20 years of CPG leadership experience and was
previously President of McCain Foods, Canada
Mar-20 Apr-20 May-20 Jun-20 Jul-20 Aug-20 Sept-20 Oct-20 Nov-20
Conversion of Remainder of Secured
Amendments to Senior Secured June Public Offering of Units
Convertible Notes
Debenture • Closed public offering of units for total
• Announced conversion of remaining
• Principal amount increased from gross proceeds of $23.6m at a price of
convertible notes (excluding one
$50.0m to $60.75m $0.13/unit
tranche) at a price of $0.04794 per
• Maturity extended from June 30th, 2020 • Proceeds were used for repayment of
common share
to March 31st, 2025 debt, a senior debt extension fee, and
• The conversion agreement provides for
general working capital
the issuance of 16,104,,403 warrants
at a price of $0.06768
Extension and Partial Conversion of Secured September Public Offering of Units
Convertible Notes • Announced closing of previously
• Maturity extended from June 30th, 2020 to announced overnight marketed offering of
March 31st, 2021 units for aggregate gross proceeds
• Immediate conversion of 22.88% of the of~$7.6m at a price of $0.085/unit
outstanding notes at a price of $0.10232 • Each unit contained one common share
• ~$2.6m reduction to the remaining principal and one common share purchase warrant
amount of the notes
12MANAGEMENT
Shai Altman Eric Rasmussen Kevin Coft
Chief Executive Officer Chief Financial Officer Executive
▪ Over 20 years of leadership in the consumer ▪ Extensive senior management experience in ▪ Formerly Chief Executive Officer of Zenabis, and
packaged goods industry, with 11 years of focused publicly-listed companies, both in North America one of the founding members of the Zenabis team
experience in the Canadian market and Europe ▪ An operational and supply chain professional with
▪ Formerly the President of McCain Foods, Canada, ▪ Strong corporate and operations finance, internal over 30 years of procurement, facility operations,
where he led the business through a significant audit, M&A, and strategic investment experience and managerial experience
turnaround that reversed a decade of topline sales over a 20-year leadership career within Shawcor ▪ Has covered a wide range of functions, including
declines ▪ Strategic consultant for Canadian large- and mid- navigating Health Canada’s regulatory licensing,
▪ Prior to McCain Foods, was the President of size clients, advising on corporate strategic and facility construction, and customer relationship
Wrigley Canada, where he led the business financial planning, post-merger integration management
through a growth phase that resulted in market
leadership
Leo Benne Alan Mayo Olen Vanderleeden
Chief Growing Officer Chief Quality & Compliance Officer Senior Vice President, Commercial
▪ Formerly Vice President and Director of Bevo ▪ Over 19 years of extensive experience in ▪ Leads all commercial activities at Zenabis
▪ Gained advanced knowledge of modern regulatory compliance, with a focus on the ▪ 20 years of experience leading sales, marketing,
horticultural methods at Rijks Middelbare application of quality assurance in operations and and operational functions
Tuinbouwschool in Holland logistics management in the manufacturing and ▪ Management, business development, and sales
▪ Provided oversight and management at Bevo in drug development sectors background in multiple industries, including
the propagation and floral business for nearly 30 ▪ Previously, he has worked across global business technology, software and CPG
years units to lead the comprehensive implementation of
▪ Experience in the application of computer GMP processes and policies, including his most
technology to the production of plants recent role at GlaxoSmithKline
13BOARD OF DIRECTORS
Daniel Burns Monty Sikka Shai Altman
Chair Co-Founder and Director Chief Executive Officer and Director
▪ A lawyer, accountant and ▪ Co-founder of Zenabis ▪ Over 20 years of leadership in the
entrepreneur ▪ As President of the Monark Group, consumer packaged goods
▪ Experienced corporate director in the has grown the business into a multi- industry, with 11 years of focused
financial services, insurance and million-dollar, multi-faceted experience in the Canadian
mining sectors corporation market
▪ Has served as chair of a number of ▪ Has extensive experience in e- ▪ Formerly the President of McCain
significant organizations in Canada commerce, marketing and finance Foods, Canada, where he led the
and the United States as well as sectors business through a significant
chaired the audit committees of turnaround that reversed a
significant public and private decade of topline sales declines
institutions
Natascha Kiernan Vincent Quan Jim Shone
Independent Director Independent Director Independent Director
▪ Experienced international finance ▪ Currently the Vice President of ▪ Currently the Founder and
and M&A attorney who has held Finance for the Richberry Group of Managing Director at Shone
senior positions at several prominent Companies, part of the executive Capital Partners, a corporate
international law firms management team that oversees financial advisory firm that
▪ As counsel at Skadden, represented over 1,100 acres of Ocean Spray provides advisory services to small
Fortune 500 companies, financial cranberry bogs and medium-sized enterprises
institutions, and governments in ▪ Previously, he oversaw a team of ▪ Previously, he was the CFO at The
complex corporate finance and M&A lending professionals in Farm Green Organic Dutchman Holdings
transactions totaling >$100bn in Credit Canada and managed a Ltd., a TSX-listed organic cannabis
value portfolio >$1bn company
14FINANCIAL PROGRESS
Zenabis has made significant financial progress over the past seven quarters. The operational rationalization in early 2020 has resulted in
three consecutive quarters of positive adjusted EBITDA and notable improvements in operating cash flow.
Financial Progress – Past Seven Quarters1
($m)
25.0
20.0 19.0
15.0 12.6
11.8
10.6
10.0
7.3 7.1
5.0 4.1 3.4 3.5
2.3 2.3
0.2
-
(2.1)
(5.0)
(6.4) (6.3) (7.0)
(10.0) (9.2)
(10.4)
(12.7) (12.4)
(15.0)
(15.9)
(20.0)
Q1 2019 Q2 2019 Q3 2019 Q4 2019 Q1 2020 Q2 2020 Q3 2020
Cannabis Net Revenue Adjusted EBITDA Cash from Operations (before changes in NWC)
15
Note: 1) NWC refers to net working capital.SELECTED FINANCIAL INFORMATION
Selected Financial Metrics Q3 2020
Cash $4.8m1
Debt $116.6m 1
Market Capitalization $66.5m 2
Enterprise Value $178.3m 2
Financial Results Q3 2020
Gross Revenue3 $28.5m
Net Revenue3 $23.7m
Net Loss3,4 ($17.0m)
Adjusted EBITDA5 $3.5m
Balance Sheet
Total Assets6 $296.2m
Total Non-Current Liabilities $110.6m
Property, Plant and Equipment $191.7m
Shares and Ownership Summary Q3 2020
Common Shares Outstanding 729,839,2737
Fully-Diluted Shares Outstanding 1,178,637,8367
16
Notes: 1) Debt is based on the amounts listed on slide 28. Cash balance of $4.8m as outlined in the Zenabis Global Inc. Financial Statements as at September 30, 2020. 2) Market capitalization and enterprise value are calculated on a fully-diluted, in-the-
money basis as of September 30, 2020 as calculated on slide 29. 3) For the three months ended September 30, 2020. 4) Includes a $2.1m loss on embedded derivative asset and a $3.4m loss on the revaluation of a royalty liability. Both are non-cash. 5)
Calculation of adjusted EBITDA is shown on slide 31. 6) Tangible assets of $294.9m as of September 30, 2020. 7) As at September 30, 2020.RECENT CAPITAL STRUCTURE CHANGES
Zenabis used a large portion of the proceeds from its September equity offering to pay down its unsecured convertible
debentures. This paydown – combined with additional conversions and scheduled principal payments – has resulted in a $7.2m
reduction in debt outstanding since the end of June.
Principal Principal
Principal Debt Paid Down Principal
Other Principal Outstanding at Outstanding at
Debt Outstanding at In September Payments / Interest Rate
Payments September 30, November 13,
June 30, 2020 Offering Conversions
2020 2020
Bevo Term Debt
BMO Financing $43.3m - ($0.8m) $42.5m - $42.5m Floating
Long-term Cannabis Debt (>2 years)
Secured Debentures $51.4m1 - - $51.4m1 - $51.4m 14.0%
RDC Mortgage $2.0m - - $2.0m - $2.0m 6.0%
Near-term Debt (ONGOING CASH INTEREST PAYMENTS
The below table outlines Zenabis’ ongoing cash interest payments as of November 13, 2020.
Principal Outstanding at
Debt Interest Rate Quarterly Interest Payment
November 13, 2020
Bevo Term Debt – Self Sustaining
BMO Financing $42.5m Floating $340k1
Cannabis Debt
Secured Debentures $51.4m 14.0% $1,800k
RDC Mortgage $2.0m 6.0% $30k
New Secured Debentures $7.5m 14.0% $261k
Unsecured Convertible Debentures $3.8m 6.0% $58k
Secured Convertible Note $0.3m 11.0% $10k
Unsecured Convertible Note $9.1m 6.0% $137k
Total (Cannabis Only) $74.1m $2.29m
Total $116.6m $2.63m
18
Notes: 1) The debt related to the propagation business is floating at a rate of prime + 0.75%. The calculated quarterly interest payment assumes the prime rate is equal to 2.45%COMPARABLE PRODUCTION MULTIPLES – CANNABIS AND PROPAGATION1
Current Licensed Annual Production Capacity
Metrics CRON ACB VFF APHA OGI TGOD FIRE VIVO SNDL ZENA AH
Enterprise Value2 ($m) 2,083 2,297 547 2,087 461 153 191 49 156 178 171
Current Capacity (kg) 40,150 150,000 37,500 255,000 89,000 32,000 50,000 14,500 60,000 111,200 128,500
EV/Current Capacity ($m/tonne) 51.9 15.3 14.6 8.2 5.2 4.8 3.8 3.4 2.6 1.6 1.3
60.0
40.0
20.0 1.6
-
Last Three Months Production3
Metrics WEED TLRY EMH OGI ACB FLWR SNDL HEXO ZENA
Enterprise Value2 ($m) 10,862 2,079 74 461 2,297 84 156 422 178
Last Three Months Production (kg) 22,990 6,781 422 6,830 36,207 1,346 6,012 16,540 12,083
EV/Last Three Months Production
($m/tonne) 472.5 306.6 174.5 67.5 63.4 62.1 26.0 25.5 14.8
500.0
400.0
300.0
200.0
100.0 14.8
-
Quarter End Net Revenue
Metrics CRON WEED TGOD TLRY ACB OGI FIRE HEXO APHA SNDL ZENA
Enterprise Value2 ($m) 2,083 10,862 153 2,079 2,297 461 191 422 2,087 156 178
Net Revenue ($m) 14.8 110.4 4.422 63.1 75.5 18.0 9.7 27.1 145.7 20.2 23.7
EV/Net Revenue ($m/$m) 140.7 98.4 34.5 33.0 30.4 25.6 19.7 15.6 14.3 7.7 7.5
200.0
100.0
7.5
-
19
Notes: 1) All financial metrics obtained as of November 6, 2020. Zenabis’ enterprise value is per the calculation on slide 29. 2) Enterprise value as of November 6, 2020. 3) Amount of cannabis prod uced on a dried flower equivalent basis as disclosed in the most recent
financial reports.COMPARABLE PRODUCTION MULTIPLES – CANNABIS ONLY1
Current Licensed Annual Production Capacity
Metrics CRON ACB VFF APHA OGI TGOD FIRE VIVO SNDL AH ZENA
Enterprise Value2 ($m) 2,083 2,297 547 2,087 461 153 191 49 156 171 103
Current Capacity (kg) 40,150 150,000 37,500 255,000 89,000 32,000 50,000 14,500 60,000 128,500 111,200
EV/Current Capacity ($m/tonne) 51.9 15.3 14.6 8.2 5.2 4.8 3.8 3.4 2.6 1.3 0.9
60.0
40.0
20.0
0.9
-
Last Three Months Production3
Metrics WEED TLRY EMH OGI ACB FLWR SNDL HEXO ZENA
Enterprise Value2 ($m) 10,862 2,079 74 461 2,297 84 156 422 103
Last Three Months Production (kg) 22,990 6,781 422 6,830 36,207 1,346 6,012 16,540 12,083
EV/Last Three Months Production
($m/tonne) 472.5 306.6 174.5 67.5 63.4 62.1 26.0 25.5 8.6
500.0
400.0
300.0
200.0
100.0 8.6
-
Quarter End Net Revenue
Metrics CRON WEED TGOD TLRY ACB OGI FIRE HEXO APHA SNDL ZENA
Enterprise Value2 ($m) 2,083 10,862 153 2,079 2,297 461 191 422 2,087 156 103
Net Revenue ($m) 14.8 110.4 4.422 63.1 75.5 18.0 9.7 27.1 145.7 20.2 19.0
EV/Net Revenue ($m/$m) 140.7 98.4 34.5 33.0 30.4 25.6 19.7 15.6 14.3 7.7 5.4
200.0
100.0
5.4
-
20
Notes: 1) All financial metrics obtained as of November 6, 2020. Zenabis’ enterprise value is per the calculation on slide 29 and excludes the enterprise value of the propagation segment, which man agement assumes to be $75m. 2) Enterprise value as of November 6, 2020,
2020. 3) Amount of cannabis produced on a dried flower equivalent basis as disclosed in the most recent financial reports.4) For Zenabis, this is the net revenue of solely the cannabis segment.TSX: ZENA Contact Us invest@zenabis.com www.zenabis.com
Appendix A – Facilities
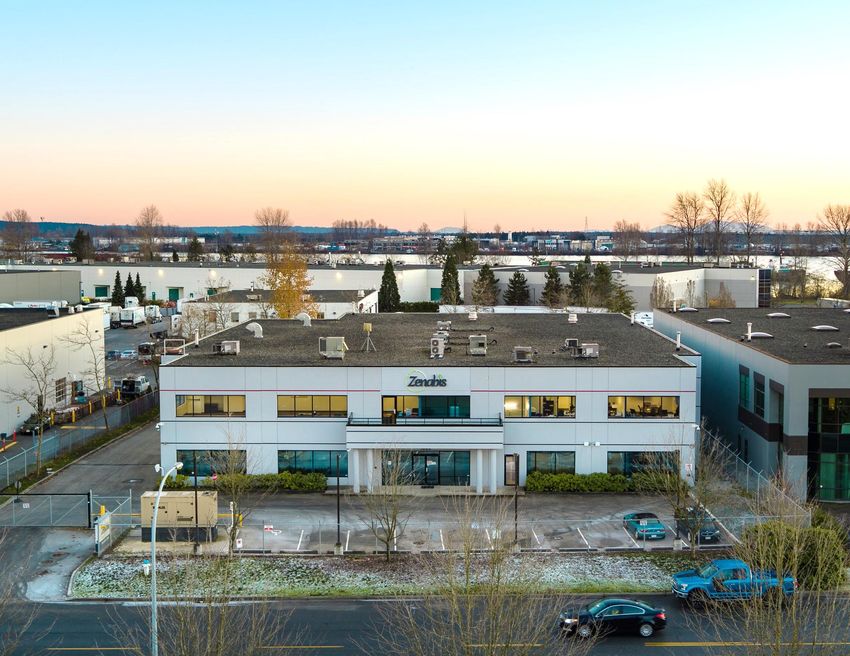
ZENABIS ATHOLVILLE
Zenabis Atholville is Zenabis’ largest indoor facility. This facility is expected to produce 46,300kg of dried cannabis equivalent per year
operating at a steady state.
Facility Details                                          Description
Location                                                  Atholville, New Brunswick
Type and Size                                             380k sq. ft. indoor cannabis

Status                                                    Fully operational

Remaining Conversion Cost                                 Nil
Design Capacity                                           46,300kg1
Extraction Design Capacity                                15,000kg2
                                                          Cultivation, processing, medical sales,
Current Licenses                                          recreational sales, oil sales, domestic
                                                          and international bulk sales
Pending Licenses                                          N/A

Capacity Milestones1                                      ▪ Current (full buildout) – 46,300kg

Summary
▪    One of the largest indoor growing facilities in Canada, Zenabis Atholville is
     Zenabis’ flagship indoor facility
▪    Zenabis Atholville is currently operating at design capacity (46,300kg
     capacity)
▪    Zenabis has worked closely with the Government of New Brunswick, which
     invested $4.0m in Zenabis, to construct Zenabis Atholville
▪    Zenabis Atholville is a major employer in New Brunswick
     ‒ It currently employs approximately 362 workers
▪       In May 2020, Zenabis Atholville received its EU GMP approval
▪    Atholville’s current extraction machine has now reached steady-state
production and is processing approximately 1,000 kg of biomass per month.
Two additional extraction machines have been added to the facility

                                                                                                                           23
Notes: 1) As outlined in Zenabis’ Annual Information Form dated March 30, 2020. 3) Extraction estimates are annual, based on 20 days a month and based on kilograms of input material.
ZENABIS LANGLEY
Zenabis Langley is one of the largest greenhouses in Canada with advanced propagation technology. The facility is expected to produce
96,100kg1 of dried cannabis equivalent per year upon full buildout and operates at a steady state.
Facility Details Description
Location Langley, British Columbia
Type and Size 2.1m sq. ft.2 greenhouse cannabis
Partially operational/conversion ongoing
Status
(for the first 10 acres)
Remaining Conversion Cost $Nil (for current market demand)
Design Capacity 96,100kg1
Extraction Design Capacity N/A
Cultivation, processing, domestic bulk
Current Licenses
sales
Pending Licenses N/A
▪ Currently Licensed – 64,100kg3
Capacity Milestones
▪ Full buildout – 96,100kg1
Summary
▪ Initial cannabis conversion activities have commenced for the first 10 acres
of greenhouse and is expected to be complete in 2020
‒ Construction and licensing of Part 1 and Part 2A and the first portion of
2B have been completed (64,100kg capacity), and construction of
rooms in Part 2B is substantially complete
▪ Zenabis Langley’s cannabis conversion is based on a closed greenhouse
design, where standard greenhouse venting does not occur
‒ Zenabis believes this will produce a higher quality, more consistent
crop; mitigate the impact on the surrounding community; and better
control pests and contaminants from entering the greenhouse
▪ The remaining 38 acres at Zenabis Langley may be converted to cannabis
cultivation on an as needed basis
‒ This portion of greenhouse will continue to be used for Zenabis’
propagation business until conversion commences
24
Notes: 1) The design capacity of the 450,000 sq. ft. to be initially converted is 96,100kg per annum. Additional details on facility conversion are outlined in Zenabis’ Annual Information Form dated March 30, 2020 and filed on SEDAR. 2) 450,000 sq. ft. of
Bevo’s existing greenhouses is expected to be initially converted to cannabis production space. The remainder is expected to continue to be used for Bevo’s propagation business, and may be converted into cannabis cultivation space on an as needed
basis. 3) Actual Capacity versus design capacity or licensed capacity will be assessed following upcoming harvests. Due to seasonality, actual capacity versus design capacity may differ. November harvest indicated significantly lower actual capacity.ZENABIS STELLARTON
Zenabis Stellarton is a licensed indoor facility located in Stellarton, Nova Scotia. The facility is intended to be utilized primarily as a
processing, packaging and fulfillment centre as well as a manufacturing facility for value-add products.
Facility Details Description
Location Stellarton, Nova Scotia
Type and Size 255k sq. ft. indoor cannabis
Status Partially operational
Remaining Conversion Cost N/A
Design Capacity1 800kg
Extraction Design Capacity N/A
Cultivation, processing, medical sales,
Current Licenses recreational sales, oil sales, domestic
bulk sales
Pending Licenses N/A
Capacity Milestones1 ▪ Current – 800kg
Summary
▪ Zenabis Stellarton is Zenabis’ second largest indoor facility situated on a
547,000 sq. ft. parcel of land
▪ The first phase of construction at Zenabis Stellarton is complete and the
initial operational area was licensed in early March 2019
▪ The addition of sales activities to Stellarton’s license, which already
included cultivation and processing activities, will enable the Company to
now execute its strategy to optimize operations and improve service to our
provincial and territorial retail customers by making Zenabis Stellarton our
center of excellence for 2.0 products, Namaste and Re-Up pre-rolls and
retail and medical order fulfilment.
25
Note: 1) Additional details on the facility are outlined in the Zenabis’ Annual Information Form dated March 30, 2020 and filed on SEDAR.ZENABIS DELTA
Zenabis Delta is an indoor facility located in the Greater Vancouver Area. This facility is currently in the process of being sold.
Facility Details Description
Location Delta, British Columbia
Type and Size 25k sq. ft. Indoor cannabis
Status Listed for sale
Remaining Conversion Cost N/A
Design Capacity N/A
Extraction Design Capacity N/A
Cultivation, processing, medical sales,
Current Licenses
recreational sales
Pending Licenses Analytical testing
Summary
▪ Zenabis is currently in the process of selling its Delta facility
▪ The facility has a limited licensed capacity of 100 kilograms that was
deemed non-core
▪ Zenabis recently relocated two additional extraction machines from Zenabis
Delta to Zenabis Atholville
26Appendix B – Financial Information
DEBT OUTSTANDING
                                                            Debt Summary
                             Principal Amount
Facility                                          Description
                           at November 13, 2020
                                                  ▪   Unsecured convertible debentures with interest rate of 6.0%
Unsecured Convertible                             ▪   Convertible into Zenabis shares at $2.6087 per share
                                  $3.8m
Debentures                                        ▪   825,000 warrants with exercise price of $2.68
                                                  ▪   Matures on September 27, 2021
                                                  ▪ $46.7m term credit facility, with interest payable quarterly at a rate of prime + applicable margin
BMO Financing                    $42.5m             based on grid pricing;
                                                  ▪ Matures on January 21, 2022
                                                  ▪ $2.0m mortgage on Zenabis Atholville with interest rate of 6.0%
RDC Mortgage                      $2.0m
                                                  ▪ Matures on August 31, 2027
                                                  ▪ Senior secured financing with interest at a rate 14.0%
                                                  ▪ 2,593,283 warrants have been issued at an exercise price of $4.02 upon $20.8m being drawn
                                                    (50% warrant coverage)
                                                  ▪ 6,009,615 warrants have been issued at an exercise price of $2.08 upon the amendment and
                                                    extension of the facility (50% warrant coverage)
Secured Debentures               $51.4m
                                                  ▪ 902,514 warrants were issued at an exercise price of $1.39 upon the amendment and advance of
                                                    the second $25.0m tranche (5% warrant coverage)
                                                  ▪ 71,255,522 warrants were issued at an exercise price of $0.07017 upon the extension (10%
                                                    warrant coverage)
                                                  ▪ Matures on March 31, 2025
                                                  ▪ Senior secured financing with interest at a rate 14.0%
New Secured Debentures            $7.5m
                                                  ▪ Matures on December 31, 2020
                                                  ▪ Subordinated financing with interest rate of 11.0%
                                                  ▪ The remaining outstanding principal amount may be converted into Zenabis common shares at
                                                    $1.17 per share (7,490,798 additional Zenabis shares)
                                                  ▪ 20,129,338 warrants were issued at an exercise price of $0.20 upon the conversion on January 16
Secured Convertible Note          $0.3m
                                                  ▪ 1,373,712 warrants have been issued at an exercise price of $1.82 upon the extension and
                                                    subordination of the notes
                                                  ▪ 16,104,403 warrants were issued at an exercise price of ~$0.068 upon conversion in October 2020
                                                  ▪ Matures on March 31, 2021
                                                  ▪ Subordinated financing with interest rate of 6.0%
Unsecured Convertible
                                  $9.1m           ▪ May be converted into Zenabis common shares at ~$1.9067 per share
Note
                                                  ▪ Matures on June 30, 2021
Total                            $116.6m
                                                                    28
CAPITALIZATION
The following outlines the capitalization of Zenabis.
Capitalization Enterprise Value
Fully Diluted Shares Outstanding1 Value Enterprise Value Calculation Value
Basic Shares Outstanding 773,203,149 Basic Shares Outstanding 773,203,149
Plus: Deferred Stock Units 1,125,000 Plus: ITM Options/Warrants1 57,645,522
Plus: Restricted Stock Units 19,803,018 Plus: ITM Conversion Shares1 Nil
Plus: Options 27,182,883 Equals: Fully-Diluted, ITM Shares Outstanding 830,848,671
Plus: Warrants 400,887,,574 Times: Zenabis Share Price2 $0.08
Plus: Conversion Options at $1.17 3,287,179 Equals: Fully-Diluted Market Capitalization $66.5m
Plus: Conversion Options at $1.91 4,783,823 Add: Debt3 $116.6m
Equals: Fully-Diluted Shares Outstanding 1,230,272,626 Less: Cash4 ($4.8m)
Equals: Enterprise Value $178.3m
29
Notes: 1) As of November 6, 2020. Does not include options that are in the money but have not yet vested. 2) As of market close November 6, 2020. 3) Debt includes all non-convertible financing and out-of-the-money convertible financing based on the
amounts listed on slide 28. 4) Cash balance of $4.8m as outlined in the Zenabis Global Inc. Financial Statements as at September 30, 2020. The negative value indicates a subtracted value, rather than a negative cash balance.Appendix C – Other Information
ADJUSTED EBITDA CALCULATION
The following outlines the calculation to arrive at adjusted EBITDA.
          Adjusted EBITDA Calculation                                                                                                   Q3 20201                     Q2 20202                  Q1 20203                Q4 20194

          Net Loss                                                                                                                    (16,975,019)                 (15,781,932)               (7,702,835)             (98,714,311)

          Plus: Realized Fair Value Amounts Included in Inventory Sold                                                                 19,114,863                   19,252,057                12,923,860              18,014,038

          Less: Unrealized Gain on Changes in Fair Value of Biological Assets                                                         (13,947,009)                 (24,222,690)              (19,219,636)             (21,432,091)

          Plus: Depreciation and Amortization                                                                                            911,015                     1,490,680                 2,050,093               2,090,304

          Plus: Impairment of Assets Held for Sale                                                                                      1,571,026                        Nil                       Nil                     Nil

          Plus: Restructuring Cost                                                                                                          Nil                       483,890                  1,058,452                   Nil

          Plus: ZenPharm Pre-Commercialization Costs                                                                                     306,118                      362,188                      Nil                     Nil

          Plus: Impairment of Inventory                                                                                                  250,314                      508,759                      Nil                  874,734

          Plus: Write-off of Materials and Supplies Inventory                                                                           1,851,536                        Nil                       Nil                     Nil

          Plus: Impairment of Property, Plant and Equipment                                                                                 Nil                          Nil                       Nil                27,841,265

          Plus: Impairment of Intangible Assets and Goodwill                                                                                Nil                          Nil                       Nil                61,480,249

          Plus: Share-Based Compensation                                                                                                1,226,986                    1,012,898                  341,858                5,995,345

          Plus: Loss on Revaluation of Embedded Derivative Asset                                                                        2,070,193                     94,256                       Nil                     Nil

          Plus (Less): Loss (Gain) on Revaluation of Embedded Derivative Liability                                                          Nil                          Nil                       Nil                  (22,993)

          Plus: Interest Expense                                                                                                        5,850,396                    8,009,676                 6,306,284               (335,248)

          Plus: Other Expense                                                                                                           (799,303)                     167,745                   298,907                 122,880

          Plus (Less): Loss (Gain) on Sale of Assets                                                                                     504,658                     (482,067)                  (9,185)                 (55,417)

          Plus (Less): Finance and Investment Expense (Income)                                                                           (9,695)                      (7,095)                   (6,544)                 316,621

          Plus : Loss due to Event                                                                                                        2,330                       20,167                    25,567                  982,560

          Less: Insurance Proceeds                                                                                                      (445,268)                     (25,000)                     Nil                 (520,526)

          Plus: Loss on Deconsolidation of Subsidiary                                                                                       Nil                          Nil                    668,562                    Nil

          Less: Government Subsidies                                                                                                   (1,963,465)                  (3,319,621)                (713,373)                   Nil

          Plus: Loss on Early Conversion of Debt                                                                                            Nil                      4,331,680                 5,624,803                   Nil

          Plus (Less): Income Tax Expense (Recovery)                                                                                     359,642                     1,102,590                  654,987                (126,856)

          Plus: Loss on Modification and Extinguishment of Debt                                                                             Nil                     10,653,156                     Nil                     Nil

          Plus: Loss on Remeasurement of Royalty Liability                                                                              3,440,868                        Nil                       Nil                     Nil

          Plus (Less): Deferred Income Tax Expense (Recovery)                                                                            103,391                     (214,083)                  42,155                (6,944,120)

          Equals: Adjusted EBITDA                                                                                                       3,463,577                    3,437,254                 2,343,955              (10,433,566)

  ▪    Management believes adjusted EBITDA is a useful metric to assess the company’s operating performance before the impact of non-cash items and acquisition related activities.
                                                                                       31
Notes: 1) For the three months ended September 30, 2020. 2) For the three months ended June 30, 2020 3) For the three months ended March 31, 2020 3) For the three months ended March 31, 2020. 4) For the three months ended December 31, 2019.
You can also read