3DIV update for 2021: a comprehensive resource of 3D genome and 3D cancer genome - Oxford Academic Journals
←
→
Page content transcription
If your browser does not render page correctly, please read the page content below
D38–D46 Nucleic Acids Research, 2021, Vol. 49, Database issue                                                             Published online 27 November 2020
doi: 10.1093/nar/gkaa1078

3DIV update for 2021: a comprehensive resource of 3D
genome and 3D cancer genome
Kyukwang Kim1,† , Insu Jang2,† , Mooyoung Kim1,† , Jinhyuk Choi2 , Min-Seo Kim2 ,
Byungwook Lee2,* and Inkyung Jung 1,*
1
 Department of Biological Sciences, Korea Advanced Institute of Science and Technology (KAIST), Daejeon 34141,
Korea and 2 Korean Bioinformation Center, Korea Research Institute of Bioscience and Biotechnology (KRIBB),
Daejeon 34141, Korea

                                                                                                                                                              Downloaded from https://academic.oup.com/nar/article/49/D1/D38/6007655 by guest on 03 January 2021
Received August 15, 2020; Revised October 20, 2020; Editorial Decision October 21, 2020; Accepted October 26, 2020

ABSTRACT                                                                                 tact maps has successfully unveiled various properties of 3D
                                                                                         chromatin structure, such as multilayered genome organiza-
Three-dimensional (3D) genome organization is                                            tion (1–3), dynamic reorganization during various biologi-
tightly coupled with gene regulation in various bio-                                     cal processes (4–6), regulation of gene expression (7,8), and
logical processes and diseases. In cancer, various                                       disruption in diseases (9–11).
types of large-scale genomic rearrangements can                                             Recent studies have revealed that genomic rearrange-
disrupt the 3D genome, leading to oncogenic gene                                         ments in the cancer genome often disorganize higher-order
expression. However, unraveling the pathogenicity                                        chromatin structures, which can be pathogenic (12). For ex-
of the 3D cancer genome remains a challenge since                                        ample, structural variations (deletions, inversions, duplica-
closer examinations have been greatly limited due to                                     tions, and translocations) disrupting topologically associat-
the lack of appropriate tools specialized for disorga-                                   ing domains (TADs) cause a failure of proper interactions
nized higher-order chromatin structure. Here, we up-                                     between the promoter and cis-regulatory elements, leading
                                                                                         to oncogenic gene expression (13–15). Thus, interpretation
dated a 3D-genome Interaction Viewer and database
                                                                                         of the 3D cancer genome can provide additional insights
named 3DIV by uniformly processing ∼230 billion                                          in understanding aberrant gene regulatory mechanisms in
raw Hi-C reads to expand our contents to the 3D                                          cancer.
cancer genome. The updates of 3DIV are listed as                                            Despite the merits of utilizing Hi-C, integrative analy-
follows: (i) the collection of 401 samples including                                     sis has been greatly limited by the difficulties in processing
220 cancer cell line/tumor Hi-C data, 153 normal cell                                    large-scale Hi-C contact maps and visualizing the 3D can-
line/tissue Hi-C data, and 28 promoter capture Hi-C                                      cer genome through mapping one-dimensional genomic re-
data, (ii) the live interactive manipulation of the 3D                                   arrangements to 3D space. The frequently observed com-
cancer genome to simulate the impact of structural                                       plex genomic rearrangements such as chromoplexy (16,17)
variations and (iii) the reconstruction of Hi-C contact                                  further exacerbate these limitations, requiring novel visual-
maps by user-defined chromosome order to investi-                                        ization tools for extensively rewired chromatin contacts.
                                                                                            To resolve these issues, we updated 3DIV (18) and de-
gate the 3D genome of the complex genomic rear-
                                                                                         veloped new browsing tools specializing in the 3D can-
rangement. In summary, the updated 3DIV will be the                                      cer genome. One hundred and sixty-eight cancer cell
most comprehensive resource to explore the gene                                          line/tumor and 52 unpublished colorectal cancer Hi-C
regulatory effects of both the normal and cancer 3D                                      datasets were added together with the lists of sample-
genome. ‘3DIV’ is freely available at http://3div.kr.                                    specific or pan-cancer defined WGS structural variations
                                                                                         (SVs). We also developed unique live manipulation and vi-
                                                                                         sualization tools for the disorganized 3D cancer genome.
INTRODUCTION
                                                                                         These unique features enable users to perform multiple
Hi-C (high-throughput chromatin conformation capture),                                   tasks, such as examining the impact of SVs on the 3D
which captures genome-wide all-to-all chromatin contacts                                 genome, configuring rearranged 3D chromatin structure,
in an unbiased manner, enables visualization of the genome                               or simulating chromatin contacts of highly rearranged
organization in three-dimensional (3D) nuclear space in the                              genomes under user-specified order. In summary, compared
form of a Hi-C contact map (1). Analysis of Hi-C con-                                    to the other existing databases, the updated 3DIV provides

* To
   whom correspondence should be addressed. Tel: +82 42 350 7315; Fax: +82 42 350 2610; Email: ijung@kaist.ac.kr
Correspondence may also be addressed to Byungwook Lee. Tel: +82 42 879 8531; Fax: +82 42 879 8519; Email: bulee@kribb.re.kr
†
    The authors wish it to be known that, in their opinion, the first three authors should be regarded as Joint First Authors.


C The Author(s) 2020. Published by Oxford University Press on behalf of Nucleic Acids Research.
This is an Open Access article distributed under the terms of the Creative Commons Attribution License (http://creativecommons.org/licenses/by/4.0/), which
permits unrestricted reuse, distribution, and reproduction in any medium, provided the original work is properly cited.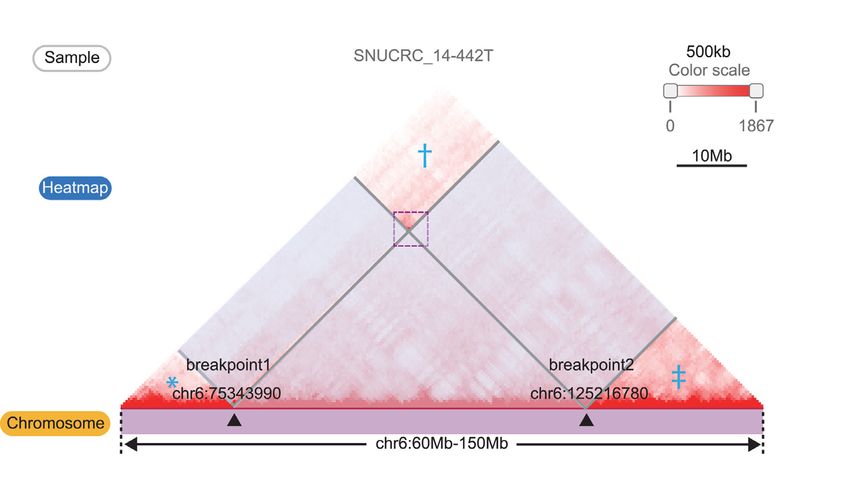
Nucleic Acids Research, 2021, Vol. 49, Database issue D39

the largest number of Hi-C samples and covers most of the       Implementation of the updated 3DIV
required functionality in navigating the 3D cancer genome
                                                                Similar to the previous version of 3DIV, a three-layered ar-
(Table 1).
                                                                chitecture consisting of data (backend), logic (middleware),
                                                                and presentation tiers (frontend) was used. Unlike the previ-
MATERIALS AND METHODS                                           ous version, HTML5 functions were used instead of D3.js
                                                                functions to rapidly display and rearrange large trans Hi-
Collection of Hi-C, epigenetic feature, and structural varia-   C contact maps of cancer samples. The frontend was op-
tion data                                                       timized in the Google Chrome and Safari environments.
We collected all Hi-C results published after July 2017 from    The Java Spring Framework and MyBatis Framework were
the GEO (Gene Expression Omnibus) database. Preexist-           used to implement middleware that connects the fron-
ing Hi-C samples published before July 2017 in the 3DIV         tend and MySQL-based backend (Supplementary Figure
database were also reprocessed for updates. As a result, we     S1).
processed ∼230 billion raw reads covering 220 cancer Hi-C

                                                                                                                                 Downloaded from https://academic.oup.com/nar/article/49/D1/D38/6007655 by guest on 03 January 2021
samples for 18 cancer-types, 153 normal Hi-C samples, and       RESULTS
28 promoter capture Hi-C samples. Details of the processed
samples are listed in Supplementary Table S1.                   Contents update for 3DIV 2021
   For each normal Hi-C sample, 3DIV provides GWAS-             As part of a major update in 3DIV 2021, 3DIV contents
SNPs, histone ChIP-seq signals, and super-enhancers for         have been expanded to the 3D cancer genome. To this end,
the functional characterization of the interacting genomic      we processed 220 cancer Hi-C samples for 18 cancer-types,
regions. In total, we collected 310 histone ChIP-seq results,   including 159 cell line and 61 blood/tumor samples (Figure
including H3K27ac, H3K27me3, H3K4me1, H3K4me3,                  1A). The Hi-C experiments conducted with various treat-
H3K9ac, and CTCF from the matched or most rele-                 ments such as drugs, CRISPR/Cas9, or gene knockout with
vant cell/tissue-types. We uniformly processed these large      cancer cell lines were also included, which allows investigat-
epigenome datasets to provide ChIP-seq enrichment sig-          ing 3D chromatin structure dynamics under multiple condi-
nals for each 5 kb genomic bin (Supplementary Table S2          tions. The ‘Control’ class contains normal samples for the
and see Supplementary Methods). Super-enhancer annota-          corresponding cancer type, such as primary blood cells or
tions were also obtained from dbSUPER (19). In addition,        normal colon tissues.
disease-associated single nucleotide polymorphism (SNP)            Though the main content of the update is 3D cancer
information was obtained from the GWAS catalog (20) (see        genome, renewal and expansion of the preexisting 3DIV
Supplementary Methods).                                         Hi-C database were also performed. A total of 153 nor-
   In the case of ‘cancer Hi-C’ data, 3DIV provides a list      mal Hi-C samples is now available in the database by pro-
of large-scale genomic rearrangements within a selected ge-     cessing approximately 116 billion raw read counts, which
nomic region. Coordinates, SV type, and read direction of       identified 31 billion valid chromatin interactions (Figure
the whole-genome sequencing (WGS)-identified structural         1B). Normal Hi-C samples were classified into 6 types,
variations were provided. If available, SV data obtained        comprising Hi-C data originated from the stem cell and
from the matched WGS data were provided. If not, public         derived, immune and blood cell, primary tissue, fibrob-
pan-cancer SV data corresponding to each sample’s cancer-       last and derived, endothelial and epithelial cell, etc. cell
type were provided. The pan-cancer SV data were ob-             lines. Similar to the cancer Hi-C database, Hi-C results
tained from the International Cancer Genome Consortium          obtained under various experimental conditions were also
(ICGC), which includes data from The Cancer Genome At-          added.
las (TCGA) (21) and the Pan-Cancer Analysis of Whole               Various derivative forms of Hi-C protocols such as cap-
Genomes (PCAWG) consortium (22). Additional informa-            ture Hi-C (25) or HiChIP (26) were developed to further
tion is available in the Supplementary Methods.                 examine the role of 3D chromatin structures in gene regula-
                                                                tion. As a follow-up, promoter capture Hi-C data generated
                                                                from 28 different human cell/tissue-types (23) were added
Processing of collected Hi-C data
                                                                with own visualization functions (Supplementary Figure
FASTQ files of each Hi-C sample were aligned to the hg38        S2). Long-range significant promoter-centered interactions
reference genome, filtered, and normalized by covNorm           can be visualized and compared across multiple human
(23) (see Supplementary Methods). The processing proce-         cell/tissue-types.
dures depend on the sample type. In the case of cancer cell        Due to the collection of hundreds of Hi-C samples, we
line/tumor tissue samples and their control samples marked      implemented a sequential sample categorization scheme,
as ‘cancer Hi-C’, both cis- and trans- interactions were pre-   enabling users to easily navigate Hi-C samples of in-
pared at a 40kb resolution. For normal Hi-C samples, cis-       terest. Samples to be visualized can be quickly selected
only interactions within a 2Mb distance were processed at       by querying samples’ keywords in the search window or
a 5kb resolution. For normal Hi-C data, topologically as-       by sequentially selecting sample characteristics such as
sociating domain (TAD) annotation was also provided by          types (e.g., cancer-, cell- or tissue-type), sample property
using TopDom (24) and DomainCaller (2) with two differ-         (e.g., cell line name), experimental conditions (e.g., drug-
ent window size options (w = 5 and 20 for TopDom and            treated), and sample name. Statistics of updated samples
DI calculation = 500kb and 2Mb for DomainCaller) (see           and download-ready data are also available at the 3DIV
Supplementary Methods).                                         website.
Table 1. Comparison of the updated 3DIV and other 3D genome databases as of October 2020
Live
Interactive manipulation Structural
Number of Hi-C contact TAD One-to-all Interaction Distance Hi-C contact of genomic variation
Software samplesa map annotation interaction table normalization map browsing rearrangement annotation Data type
3DIV 2021 Update 401 Hi-C and capture Hi-C
3DIV 80 Hi-C
4D Nucleome 337b Hi-C, capture Hi-C, ChIA-PET,
and Hi-C variants
Nucleome Browser 138c Hi-C and Hi-C variants
WashU Epigenome 36c,d Hi-C, capture Hi-C, and
Browser ChIA-PET
D40 Nucleic Acids Research, 2021, Vol. 49, Database issue
HiView 2 Hi-C
HUGIn2 83 Hi-C, capture Hi-C, and HiChIP
3D Genome Browser 113 Hi-C, ChIA-PET, capture Hi-C
GITAR 20c Hi-C
Hi-C Data Browser 69 Hi-C, capture Hi-C, and
ChIA-PET
3Disease Browser 6 Hi-C
ChromContact 6 Hi-C
ENCODE 95e Hi-C and ChiA-PET
a
Only Hi-C and its variant experiments in ‘Data type’ column conducted on the human samples were considered. Multiple replicates were counted as one.
b
4D Nucleome uses HiGlass display.
c
Nucleome Browser, GITAR, and WashU Epigenome Browser can visualize user-uploaded data.
d
Samples uploaded as hg38 were counted.
e
In the case of ENCODE, the data provided is different according to the uploaded processing results. Part of the ENCODE data has been processed to be used as an input file for Juicebox.
Downloaded from https://academic.oup.com/nar/article/49/D1/D38/6007655 by guest on 03 January 2021Nucleic Acids Research, 2021, Vol. 49, Database issue D41
A C
Downloaded from https://academic.oup.com/nar/article/49/D1/D38/6007655 by guest on 03 January 2021
B
Figure 1. Overview of the 3DIV update. (A) Pie chart presenting the number of samples per cancer-type covered by newly added cancer Hi-C samples.
Control indicates Hi-C data used as controls for cancer samples including normal cell and tissue. (B) Pie chart showing the number of samples per cell/tissue-
type in the updated normal Hi-C database. (C) Three user-accessible main modules and their functions in the updated 3DIV.
Development of cancer Hi-C analysis and visualization mod- nates and types of SVs based on the read direction are also
ules provided. The SV list of the queried sample is presented if
available; otherwise, the cancer type-matching SV list ob-
Unlike normal samples, large-scale SVs such as deletions,
tained from the pan-cancer data is provided.
duplications, inversions, and translocations are frequently
Clicking the SV on the list first displays the range of the
observed in the cancer genome, which are part of the main
SVs on the Hi-C contact map of the target sample (Figure
factors that lead to changes in the 3D chromatin structure.
2B), and the chromatin contacts changed by the SVs are dis-
Distal genomic regions can form new spatial chromatin
played on the next panel (Figure 2C). The recombination
contacts by large-scale SVs, which generates highly visible
of the Hi-C contact map from Figure 2B to C illustrates
SV break-end-enriched contact reads on Hi-C contact maps
a smooth linkage of contact signals crossing breakpoints,
(27). Using this feature, a Hi-C contact map can be uti-
indicating the establishment of de novo chromatin contacts
lized to intuitively interpret the effects of large-scale SVs
between the regions proximal to the SV breakpoints. This
on genome organization and compensate for the limitations
allows the user to examine the impact of SVs on 3D chro-
of WGS in detecting large-scale SVs (28). In this regard,
matin contacts and predict their potential regulatory effects
three modules were developed for the 3DIV update: visu-
by investigating rewired interactions between regulatory el-
alization with WGS-identified SVs, manipulation of Hi-C
ements (Figure 2D).
contact maps by clicking, and recombination of Hi-C con-
In addition, the module I is equipped with a function that
tact maps based on user-defined chromosome order (Figure
provides a list of sample/caner-type matched SVs after se-
1C). Explanation figures and working examples are avail-
lecting a sample, which can be used as an input parameter
able for each module page with detailed tutorials. Descrip-
instead of arbitrary genomic coordinates, thereby allowing
tions of the modules will be covered in detail below.
users to quickly select and examine the region of interest.
Module I. Visualization of the effect of WGS-identified struc-
tural variations on the 3D genome. The first module re- Module II. Live interactive manipulation of disorganized 3D
ceives a genomic region as an input and presents a Hi-C chromatin structure. WGS-identified SVs can explain a
contact map with a list of WGS-identified structural varia- certain portion of changes in Hi-C contact maps, but two
tions of the queried region (Figure 2A). Breakpoint coordi- methods often show a discrepancy in the detection of SVsD42 Nucleic Acids Research, 2021, Vol. 49, Database issue
A
B
Downloaded from https://academic.oup.com/nar/article/49/D1/D38/6007655 by guest on 03 January 2021
C
D
Figure 2. Visualizing effect of the structural variations on the Hi-C contact map. (A) The table of WGS-identified structural variations from sample
‘SNUCRC 14–442T’ within the chr16:60–150 Mb region. (B) Affected regions (translucent boxes) on the Hi-C contact map by the SV ‘chr6 75343990
chr6 125216780 DEL 3to5’ can be visualized by clicking the SV in the table. The regions marked with an asterisk (*), dagger (†), and double dagger (‡)
are reorganized by an exemplified deletion event. (C) Reorganized Hi-C contact maps (*, †, and ‡ in Figure 2B) showing breakpoint-crossing Hi-C signals
(purple line box). Gene density and super-enhancers at recombined regions are also displayed. (D) Illustration showing the interpretation of SV-mediated
newly established chromatin contacts in terms of rewired cis-regulatory elements and promoters.Nucleic Acids Research, 2021, Vol. 49, Database issue D43
Downloaded from https://academic.oup.com/nar/article/49/D1/D38/6007655 by guest on 03 January 2021
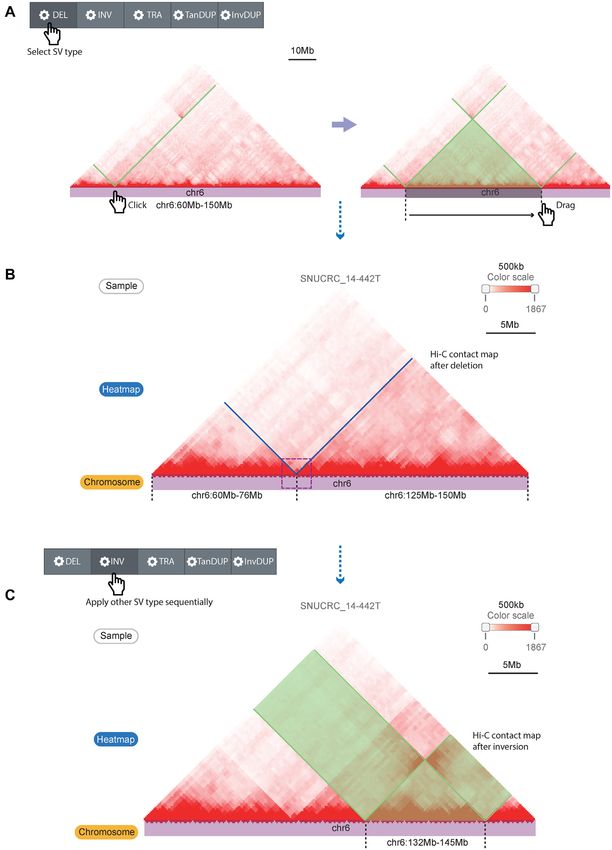
Figure 3. Live Hi-C contact map manipulation function for simulating the effect of SVs. (A) Hi-C contact map manipulation by selecting the SV type,
clicking one breakpoint, and dragging the cursor on the chromosome track to the next breakpoint. The black dashed lines indicate breakpoint coordinates,
and the green line/translucent triangle indicates the affected Hi-C contact map region by the simulated SV type. (B) A recombined Hi-C contact map by the
simulated SV (deletion) that reproduces the deletion example in Figure 2. (C) Applying another SV simulation (inversion, marked with the black dashed
lines and translucent green) at the already recombined Hi-C contact map. Translucent green boxes indicate inverted Hi-C signals by the simulation.D44 Nucleic Acids Research, 2021, Vol. 49, Database issue
A B
chr4
chr4:91117565-91134331;chr4:170264724-170246754
chr4:190214555-170246754;chr6:51247984-170805979
chr6 chr6:1-51247984;chr4:91117565-170246754
Fragmentation and amplification
Example Run Run
Recombination
chr4:91134331-chr4:170264724 (INV, 3to3)
*
chr4:170246754-chr6:51247984 (TRA, 5to5) †
Downloaded from https://academic.oup.com/nar/article/49/D1/D38/6007655 by guest on 03 January 2021
Der4
Der6 chr4:91117565-chr6:51306171 (TRA, 5to3) ‡
C Sample SNUCRC_16-178T 500kb
Color scale
0 1144
Heatmap
‡
* †
Chromosome chr4 chr6
D Apply
Sample SNUCRC_16-178T 500kb
Color scale
0 1144
Weight score
0 15 30
Heatmap
† ‡
Chromosome chr4 chr6 chr6 chr4
85Mb 118Mb 152Mb 34Mb 125Mb 159Mb
Ruler
chr4:190214555-170246754 chr6:51247984-170805979 chr6:1-51247984 chr4:91117565-170246754
Der4 Der6
Figure 4. Reorganization of chromatin contacts under user-defined chromosome order. (A) Estimated recombination process between chromosomes 4
and 6 of the ‘SNUCRC 16–178T’ tumor sample. The blue triangles indicate the 5 to 3 direction of the fragments. Breakpoint coordinates and types of
three WGS-identified structural variations are also shown, marked with an asterisk (*), dagger (†), and double dagger (‡). (B) A semicolon (;) separates the
coordinates to command rearranged genomic fragments. The color of the boxes indicates the formatted text corresponding to each derivative chromosome
(Der) shown in (A). (C) Original Hi-C contact map (reference genome) of a complex rearrangement sample. Bars below the Hi-C contact map indicate
different chromosomes by each color. Purple boxes indicate enriched interactions at the SV breakpoints, which correspond to the coordinates in (A) (*, †
and ‡). Dashed line boxes (green and blue) indicate translocation signals between two chromosomes. (D) Reorganized Hi-C contacts between chromosomes
based on the user-given chromosome order (3 to 3 INV fragment in (A) is not visible due to its small fragment size). Translocation signals (dashed line
boxes in C) and interactions enriched at the breakpoints (purple line boxes with † and ‡) were fitted to derivative chromosomes after the rearrangement of
the Hi-C contact map. Translocation signals can be enhanced by a user-defined parameter (Weight score) for better visualization.Nucleic Acids Research, 2021, Vol. 49, Database issue D45
(28,29). For example, complex rearrangements and SVs smooth triangular shapes that resemble normal Hi-C con-
spanning unmappable regions can hinder the formation or tact maps, thus indicating the formation of putative TAD
detection of the direct breakpoints in WGS. However, spa- fusion or neo-TADs between the rearranged chromosome
tial contacts between surrounding regions of the break- regions.
points make these events visible on the Hi-C contact maps.
In addition, the function for simulating multiple SVs to-
DISCUSSION
gether is also required to estimate the impact of various ge-
nomic rearrangements in the cancer genome. The usefulness of Hi-C data in the interpretation of non-
To this end, the second module of the updated 3DIV pro- coding structural variations has recently been highlighted,
vides live interactive manipulation of a Hi-C contact map. revealing the regulatory effects of complex genomic rear-
Users can select the region of interest simply by clicking rangements in cancer. We updated the 3DIV to provide
and dragging on a chromosome track (Figure 3A), and the vast amounts of 3D cancer genome data that cover multiple
Hi-C contact map will be rearranged based on the SV type cancer-types with visualization tools that are expected to be
Downloaded from https://academic.oup.com/nar/article/49/D1/D38/6007655 by guest on 03 January 2021
that the user selected (Figure 3B). The ruler below the chro- widely used in this field.
mosome track provides a detailed scale and a crop func- As the Hi-C protocol and ‘C’-technologies continue to
tion, which shows the sizes of the rearranged fragments and evolve with the production of various datasets (26,30,31),
aids users in preparing publication-ready figures from the the 3DIV database will continue to expand in the future
database. Unlike module I, multiple changes can be sequen- to support more experimental results with unique visual-
tially applied to the Hi-C contact map. For example, Fig- ization tools.
ure 3C shows a simulation of an additional inversion after Despite the advantages of the 3DIV in exploring the
the deletion applied in the Hi-C contact map. The control higher-order chromatin structure of various samples, there
panel also provides additional manipulations such as ad- are several limitations to be resolved. The current version
justing the scale (zooming in or out) or reverting applied of the 3DIV has focused on large-scale structural variations
changes on the Hi-C contact map. The control panel ini- as they greatly impact on the 3D cancer genome; thus, we
tially located at the top of the web page follows the user in could not fully address the effect of all types of genetic vari-
the form of a sidebar when the web page is scrolled, making ations such as copy number alterations. In addition, the
it easy to adjust the contact map without scrolling back to incompatibility between 3DIV and the most popular and
the top of the web page. The original contact map marked user-friendly visualization tools such as Juicebox (32) and
with changed regions is also provided in parallel with the HiGlass (33) limits the scalability of 3DIV. The functions
manipulated contact map, allowing users to compare the for the Hi-C contact map manipulation according to the
altered 3D genome through the simulated SVs, intuitively. structural variations were not supported by Juicebox and
HiGlass, thus independent matrix format data structures
Module III. Visualization of the complex SV effect on the were developed and applied to the current version of 3DIV
3D genome. Recent studies have identified massively rear- despite the compatibility issues. The discussed limitations
ranged chromosomes such as chromothripsis and chromo- will be resolved in future updates.
plexy (16,17,27). These complex rearrangements often in- In summary, the 3DIV database was updated with 3D
volve more than dozens of SVs on single or multiple chro- cancer genome data based on most of the publicly avail-
mosomes, which cannot be intuitively presented on Hi-C able Hi-C data with powerful visualization and manipula-
contact maps. Additionally, as complex rearrangements of- tion functions, which are expected to be highly useful in un-
ten occur as a single catastrophic event, it may be challeng- derstanding the complexity of cancer biology.
ing to implement simultaneous rearrangements only by se-
quential inputs.
SUPPLEMENTARY DATA
For example, a complex rearrangement event between
chromosomes 4 and 6 in the ‘SNUCRC 16–178T’ tumor Supplementary Data are available at NAR Online.
sample (stage III colorectal cancer) is shown in Figure 4.
The estimated recombination processes, including ampli-
ACKNOWLEDGEMENTS
fication of small fragments (brown and dark brown frag-
ments) and translocations between two chromosomes, are The authors thank the members of the Jung laboratory,
shown in Figure 4A. WGS-based representation of these the Korean Bioinformatics Center, and Dongchan Yang for
SVs simply shows the list of breakpoints, limiting the in- their advice and aid. We also thank the Genome-InfraNet at
tuitive interpretation of rearranged chromosomes in the Korean Bioinformation Center for sharing their data (ID:
3D nuclear space. To resolve this issue, the third module 1711064775).
takes user-defined genomic coordinates and generates a re-
arranged Hi-C contact map. As an input of the module,
FUNDING
the order of the rearranged chromosomes is uploaded with
a semicolon (‘;’) delimiter, in which areas that are not en- Ministry of Science and ICT through the National Re-
tered are treated as genomic deletions (Figure 4B). Running search Foundation in the Republic of Korea [NRF-
the module generates a Hi-C contact map of involved chro- 2020M3C9A5085887 and NRF-2020R1A2C4001464 to
mosomes based on the reference genome (Figure 4C) and a I.J., NRF-2018M3C9A5064704 to B.L.]. SUHF Fellowship
reorganized Hi-C contact map based on the given chromo- to I.J. Funding for open access charge: SUHF Fellowship.
some order (Figure 4D). The recombination result forms Conflict of interest statement. None declared.D46 Nucleic Acids Research, 2021, Vol. 49, Database issue
REFERENCES et al. (2011) Massive genomic rearrangement acquired in a single
catastrophic event during cancer development. Cell, 144, 27–40.
1. Lieberman-Aiden,E., van Berkum,N.L., Williams,L., Imakaev,M.,
17. Baca,S.C., Prandi,D., Lawrence,M.S., Mosquera,J.M., Romanel,A.,
Ragoczy,T., Telling,A., Amit,I., Lajoie,B.R., Sabo,P.J.,
Drier,Y., Park,K., Kitabayashi,N., MacDonald,T.Y., Ghandi,M.
Dorschner,M.O. et al. (2009) Comprehensive mapping of long-range
et al. (2013) Punctuated evolution of prostate cancer genomes. Cell,
interactions reveals folding principles of the human genome. Science,
153, 666–677.
326, 289–293. 18. Yang,D., Jang,I., Choi,J., Kim,M.S., Lee,A.J., Kim,H., Eom,J.,
2. Dixon,J.R., Selvaraj,S., Yue,F., Kim,A., Li,Y., Shen,Y., Hu,M., Kim,D., Jung,I. and Lee,B. (2018) 3DIV: A 3D-genome Interaction
Liu,J.S. and Ren,B. (2012) Topological domains in mammalian Viewer and database. Nucleic. Acids. Res., 46, D52–D57.
genomes identified by analysis of chromatin interactions. Nature, 485, 19. Khan,A. and Zhang,X. (2016) dbSUPER: a database of
376–380. super-enhancers in mouse and human genome. Nucleic Acids Res.,
3. Rao,S.S., Huntley,M.H., Durand,N.C., Stamenova,E.K., 44, D164–D171.
Bochkov,I.D., Robinson,J.T., Sanborn,A.L., Machol,I., Omer,A.D., 20. Buniello,A., MacArthur,J.A.L., Cerezo,M., Harris,L.W., Hayhurst,J.,
Lander,E.S. et al. (2014) A 3D map of the human genome at kilobase Malangone,C., McMahon,A., Morales,J., Mountjoy,E., Sollis,E.
resolution reveals principles of chromatin looping. Cell, 159, et al. (2019) The NHGRI-EBI GWAS Catalog of published
1665–1680. genome-wide association studies, targeted arrays and summary
Downloaded from https://academic.oup.com/nar/article/49/D1/D38/6007655 by guest on 03 January 2021
4. Crane,E., Bian,Q., McCord,R.P., Lajoie,B.R., Wheeler,B.S., statistics 2019. Nucleic Acids Res., 47, D1005–D1012.
Ralston,E.J., Uzawa,S., Dekker,J. and Meyer,B.J. (2015) 21. Cancer Genome Atlas Research, N., Weinstein,J.N., Collisson,E.A.,
Condensin-driven remodelling of X chromosome topology during Mills,G.B., Shaw,K.R., Ozenberger,B.A., Ellrott,K., Shmulevich,I.,
dosage compensation. Nature, 523, 240–244. Sander,C. and Stuart,J.M. (2013) The Cancer Genome Atlas
5. Dixon,J.R., Jung,I., Selvaraj,S., Shen,Y., Antosiewicz-Bourget,J.E., Pan-Cancer analysis project. Nat. Genet., 45, 1113–1120.
Lee,A.Y., Ye,Z., Kim,A., Rajagopal,N., Xie,W. et al. (2015) 22. Consortium, I.T.P.-C.A.o.W.G. (2020) Pan-cancer analysis of whole
Chromatin architecture reorganization during stem cell genomes. Nature, 578, 82–93.
differentiation. Nature, 518, 331–336. 23. Jung,I., Schmitt,A., Diao,Y., Lee,A.J., Liu,T., Yang,D., Tan,C.,
6. Pope,B.D., Ryba,T., Dileep,V., Yue,F., Wu,W., Denas,O., Vera,D.L., Eom,J., Chan,M., Chee,S. et al. (2019) A compendium of
Wang,Y., Hansen,R.S., Canfield,T.K. et al. (2014) Topologically promoter-centered long-range chromatin interactions in the human
associating domains are stable units of replication-timing regulation. genome. Nat. Genet., 51, 1442–1449.
Nature, 515, 402–405. 24. Shin,H., Shi,Y., Dai,C., Tjong,H., Gong,K., Alber,F. and Zhou,X.J.
7. Chong,S., Dugast-Darzacq,C., Liu,Z., Dong,P., Dailey,G.M., (2016) TopDom: an efficient and deterministic method for identifying
Cattoglio,C., Heckert,A., Banala,S., Lavis,L., Darzacq,X. et al. topological domains in genomes. Nucleic. Acids. Res., 44, e70.
(2018) Imaging dynamic and selective low-complexity domain 25. Mifsud,B., Tavares-Cadete,F., Young,A.N., Sugar,R.,
interactions that control gene transcription. Science, 361, eaar2555. Schoenfelder,S., Ferreira,L., Wingett,S.W., Andrews,S., Grey,W.,
8. Stadhouders,R., Vidal,E., Serra,F., Di Stefano,B., Le Dily,F., Ewels,P.A. et al. (2015) Mapping long-range promoter contacts in
Quilez,J., Gomez,A., Collombet,S., Berenguer,C., Cuartero,Y. et al. human cells with high-resolution capture Hi-C. Nat. Genet., 47,
(2018) Transcription factors orchestrate dynamic interplay between 598–606.
genome topology and gene regulation during cell reprogramming. 26. Mumbach,M.R., Rubin,A.J., Flynn,R.A., Dai,C., Khavari,P.A.,
Nat. Genet., 50, 238–249. Greenleaf,W.J. and Chang,H.Y. (2016) HiChIP: efficient and sensitive
9. Lupianez,D.G., Kraft,K., Heinrich,V., Krawitz,P., Brancati,F., analysis of protein-directed genome architecture. Nat. Methods, 13,
Klopocki,E., Horn,D., Kayserili,H., Opitz,J.M., Laxova,R. et al. 919–922.
(2015) Disruptions of topological chromatin domains cause 27. Akdemir,K.C., Le,V.T., Chandran,S., Li,Y., Verhaak,R.G.,
pathogenic rewiring of gene-enhancer interactions. Cell, 161, Beroukhim,R., Campbell,P.J., Chin,L., Dixon,J.R., Futreal,P.A. et al.
1012–1025. (2020) Disruption of chromatin folding domains by somatic genomic
10. Franke,M., Ibrahim,D.M., Andrey,G., Schwarzer,W., Heinrich,V., rearrangements in human cancer. Nat. Genet., 52, 294–305.
Schopflin,R., Kraft,K., Kempfer,R., Jerkovic,I., Chan,W.L. et al. 28. Dixon,J.R., Xu,J., Dileep,V., Zhan,Y., Song,F., Le,V.T.,
(2016) Formation of new chromatin domains determines Yardimci,G.G., Chakraborty,A., Bann,D.V., Wang,Y. et al. (2018)
pathogenicity of genomic duplications. Nature, 538, 265–269. Integrative detection and analysis of structural variation in cancer
11. Laugsch,M., Bartusel,M., Rehimi,R., Alirzayeva,H., Karaolidou,A., genomes. Nat. Genet., 50, 1388–1398.
Crispatzu,G., Zentis,P., Nikolic,M., Bleckwehl,T., Kolovos,P. et al. 29. Kim,K., Eom,J. and Jung,I. (2019) Characterization of structural
(2019) Modeling the pathological long-range regulatory effects of variations in the context of 3D chromatin structure. Mol. Cells, 42,
human structural variation with patient-specific hiPSCs. Cell Stem 512–522.
Cell, 24, 736–752. 30. Fang,R., Yu,M., Li,G., Chee,S., Liu,T., Schmitt,A.D. and Ren,B.
12. Valton,A.L. and Dekker,J. (2016) TAD disruption as oncogenic (2016) Mapping of long-range chromatin interactions by proximity
driver. Curr. Opin. Genet. Dev., 36, 34–40. ligation-assisted ChIP-seq. Cell Res., 26, 1345–1348.
13. Northcott,P.A., Lee,C., Zichner,T., Stutz,A.M., Erkek,S., 31. Link,V.M., Duttke,S.H., Chun,H.B., Holtman,I.R., Westin,E.,
Kawauchi,D., Shih,D.J., Hovestadt,V., Zapatka,M., Sturm,D. et al. Hoeksema,M.A., Abe,Y., Skola,D., Romanoski,C.E., Tao,J. et al.
(2014) Enhancer hijacking activates GFI1 family oncogenes in (2018) Analysis of genetically diverse macrophages reveals local and
medulloblastoma. Nature, 511, 428–434. domain-wide mechanisms that control transcription factor binding
14. Hnisz,D., Weintraub,A.S., Day,D.S., Valton,A.L., Bak,R.O., Li,C.H., and function. Cell, 173, 1796–1809.
Goldmann,J., Lajoie,B.R., Fan,Z.P., Sigova,A.A. et al. (2016) 32. Durand,N.C., Robinson,J.T., Shamim,M.S., Machol,I., Mesirov,J.P.,
Activation of proto-oncogenes by disruption of chromosome Lander,E.S. and Aiden,E.L. (2016) Juicebox provides a visualization
neighborhoods. Science, 351, 1454–1458. system for Hi-C contact maps with unlimited zoom. Cell Syst., 3,
15. Weischenfeldt,J., Dubash,T., Drainas,A.P., Mardin,B.R., Chen,Y., 99–101.
Stutz,A.M., Waszak,S.M., Bosco,G., Halvorsen,A.R., Raeder,B. 33. Kerpedjiev,P., Abdennur,N., Lekschas,F., McCallum,C., Dinkla,K.,
et al. (2017) Pan-cancer analysis of somatic copy-number alterations Strobelt,H., Luber,J.M., Ouellette,S.B., Azhir,A., Kumar,N. et al.
implicates IRS4 and IGF2 in enhancer hijacking. Nat. Genet., 49, (2018) HiGlass: web-based visual exploration and analysis of genome
65–74. interaction maps. Genome Biol., 19, 125.
16. Stephens,P.J., Greenman,C.D., Fu,B., Yang,F., Bignell,G.R.,
Mudie,L.J., Pleasance,E.D., Lau,K.W., Beare,D., Stebbings,L.A.You can also read