Influence of body composition and muscle strength on outcomes after multimodal oesophageal cancer treatment
←
→
Page content transcription
If your browser does not render page correctly, please read the page content below
ORIGINAL ARTICLE
Journal of Cachexia, Sarcopenia and Muscle (2020)
Published online in Wiley Online Library (wileyonlinelibrary.com) DOI: 10.1002/jcsm.12540

Influence of body composition and muscle strength on
outcomes after multimodal oesophageal cancer
treatment

Eliza R.C. Hagens1 , Minke L. Feenstra1, Maarten A. van Egmond2, Hanneke W.M. van Laarhoven3 , Maarten C.C.M.
Hulshof4 , Piers R. Boshier5,6, Donald E. Low5 , Mark I. van Berge Henegouwen1    & Suzanne S. Gisbertz1*
1
 Department of Surgery, Amsterdam University Medical Centers, University of Amsterdam, Cancer Center Amsterdam, Amsterdam, The Netherlands, 2Department of
Rehabilitation, Amsterdam University Medical Centers, University of Amsterdam, Cancer Center Amsterdam, Amsterdam, The Netherlands, 3Department of Medical
Oncology, Amsterdam University Medical Centers, University of Amsterdam, Cancer Center Amsterdam, Amsterdam, The Netherlands, 4Department of Radiotherapy,
Amsterdam University Medical Centers, University of Amsterdam, Cancer Center Amsterdam, Amsterdam, The Netherlands, 5Department of Thoracic Surgery and Thoracic
Oncology, Virginia Mason Medical Center, Seattle, WA, USA, 6Department of Surgery and Cancer, Imperial College London, London, UK

Abstract
Background Influence of sarcopenia in combination with other body composition parameters and muscle strength on out-
comes after oesophageal surgery for oesophageal cancer remains unclear. The objectives were (i) to describe the incidence of
sarcopenia in relation to adipose tissue quantity and distribution and muscle strength; (ii) to evaluate if neoadjuvant chemo-
radiation (nCRTx) influences body composition and muscle strength; and (iii) to evaluate the influence of body composition
and muscle strength on post-operative morbidity and long-term survival.
Methods This retrospective study included patients with oesophageal cancer who received nCRTx followed by surgery be-
tween January 2011 and 2016. Skeletal muscle, visceral, and subcutaneous adipose tissue cross-sectional areas were calcu-
lated based on computed tomography scans, and muscle strength was measured using hand grip tests, 30 seconds chair
stand tests, and maximal inspiratory and expiratory pressure tests prior to nCRTx and after nCRTx.
Results A total of 322 patients were included in this study. Sarcopenia was present in 55.6% of the patients prior to nCRTx
and in 58.2% after nCRTx (P = 0.082). Patients with sarcopenia had a significantly lower muscle strength and higher fat per-
centage. The muscle strength and incidence of sarcopenia increased while the mean body mass index and fat percentage de-
creased during nCRTx. A body mass index above 25 kg/m2 was associated with anastomotic leakage (P = 0.032). Other body
composition parameters were not associated with post-operative morbidity. A lower handgrip strength prior to nCRTx was as-
sociated with pulmonary and cardiac complications (P = 0.023 and P = 0.009, respectively). In multivariable analysis, a lower
number of stands during the 30 seconds chair stand test prior to nCRTx (hazard ratio 0.93, 95% confidence interval 0.87–
0.99, P = 0.017) and visceral adipose tissue of >128 cm2 after nCRTx (hazard ratio 1.81, 95% confidence interval 1.30–2.53,
P = 0.001) were associated with worse overall survival.
Conclusions Sarcopenia occurs frequently in patients with oesophageal cancer and is associated with less muscle strength
and a higher fat percentage. Body composition changes during nCRTx did not influence survival. Impaired muscle strength
and a high amount of visceral adipose tissue are associated with worse survival. Therefore, patients with poor fitness might
benefit from preoperative nutritional and muscle strengthening guidance, aiming to increase muscle strength and decrease
visceral adipose tissue. However, this should be confirmed in a large prospective study.
Keywords       Oesophageal cancer; Body composition; Sarcopenia; Muscle strength; Complications; Survival

Received: 18 August 2019; Revised: 30 November 2019; Accepted: 7 January 2020
*Correspondence to: Suzanne S. Gisbertz, Department of Surgery, Amsterdam University Medical Centers, University of Amsterdam, Cancer Center Amsterdam,
Meibergdreef 9, 1105 AZ Amsterdam, The Netherlands. Phone: +31(0)20 5664577; Fax: +31(0)20 5669243. Email: s.s.gisbertz@amsterdamumc.nl

© 2020 The Authors. Journal of Cachexia, Sarcopenia and Muscle published by John Wiley & Sons Ltd on behalf of Society on Sarcopenia, Cachexia and Wasting Disorders
This is an open access article under the terms of the Creative Commons Attribution-NonCommercial-NoDerivs License, which permits use and distribution in any medium,
provided the original work is properly cited, the use is non-commercial and no modifications or adaptations are made.
2                                                                                                                E.R.C. Hagens et al.

Introduction                                                    STROBE guidelines were used to ensure correct reporting
                                                                of this study.21 Study variables on baseline characteristics
The prognosis of oesophageal cancer remains poor, and the       and post-operative complications were obtained from an
post-operative complication rate remains high.1,2 Five years    existing prospectively maintained surgical database and
of survival rates following neoadjuvant chemoradiation          medical records. Patients were included in this study if they
(nCRTx) and oesophagectomy are reported to be 30–57%.3–         had a resectable oesophageal carcinoma and were treated
5
  Up to 80% of patients with advanced oesophageal cancer        with nCRTx followed by surgery. Patients were excluded if
are affected by cancer-induced cachexia, a clinical condition   diagnostic computed tomography (CT) images before and
that results in skeletal muscle wasting with or without loss    after nCRTx were missing or in case of insufficient quality
of body fat.6–8 In patients with oesophageal cancer, cachexia   for the assessment of body composition. CT images were
is worsened by dysphagia, leading to malnutrition and a         considered of insufficient quality if tissue was cut off from
change in body composition.9,10                                 the frame, and/or the CT scan was not in portal phase,
   Current literature on the influence of body composition       and/or it was not a high-resolution scan.
parameters [including body mass index (BMI), body fat per-
centage, skeletal muscle index, and sarcopenia] on post-
operative morbidity and long-term survival in patients with     Treatment of patients
oesophageal cancer after curative intent treatment is scarce,
and literature on sarcopenia is often contradictory. Some       In case of dysphagia and/or weight loss, patients were re-
studies show that sarcopenia is an independent predictor        ferred to a dietician. If indicated, patients were subscribed
for development of post-operative complications and overall     liquid oral nutritional supplements or tube feeding. All pa-
and disease-free survival while other studies did not find       tients were screened for physical fitness by a physiotherapist,
any correlation.11–14 Few studies take other factors such as    and if indicated, a training programme was advised.
muscle strength and fat percentage or fat distribution into        Patients were treated according to the national oesopha-
consideration. Sarcopenia reduces physical activity, which      geal cancer guidelines.22 Resectable (cT2-4aN0-3M0 and
leads to decreased energy and an increased risk of obesity.15   cT0-1N+M0) patients were treated with nCRTx consisting
When sarcopenia is accompanied by a high fat mass, it is        of 23 fractions of 1.8 Gy (41.4 Gy) external beam radiother-
called sarcopenic obesity.16 Both sarcopenia and obesity are    apy combined with weekly administered carboplatin (AUC
associated with post-operative morbidity, mortality, and        2) and paclitaxel (50 mg/m2). Six to 10 weeks after nCRTx
lower overall survival in patients with oesophageal cancer,     (depending on patients’ condition), patients had an open
and it is hypothesized that sarcopenic obesity may have a       or minimally invasive transthoracic or transhiatal oesopha-
greater impact than either sarcopenia or obesity alone.17–20    gectomy with gastric tube reconstruction with either an in-
It is therefore of importance to evaluate influence of           trathoracic or cervical anastomosis.4 The choice for the
sarcopenia in combination with other body composition pa-       surgical approach depended on patients (e.g. pulmonary
rameters and muscle strength on long-term and short-term        function) and tumour (e.g. tumour location and invasion
outcomes in oesophageal cancer patients.                        depth, location of lymph node metastases, and radiation
   The objectives of the present study were to describe the     field) characteristics.
incidence of sarcopenia and the relationship of sarcopenia         Patients were screened for physical fitness, and if indi-
with adipose tissue quantity and distribution and muscle        cated, a training programme was advised.
strength, to evaluate the change in body composition,
sarcopenia, and muscle strength during nCRTx, and to evalu-     Definition of post-operative morbidity
ate the influence of body composition and muscle strength
on post-operative morbidity and long-term survival.             Post-operative complications were graded using the Clavien–
                                                                Dindo classification system.23 To classify the severity of post-
                                                                operative complications, patients were divided into three
                                                                groups: no complications, minor complications, and major
Methods                                                         complications (Clavien–Dindo IIIb–V). Definition of complica-
                                                                tions was scored according to the Esophagectomy Complica-
Study design and study population                               tions Consensus Group classification.24

A retrospective study was conducted using a prospectively
maintained database containing consecutive patients with        Assessment of muscle strength
oesophageal cancer who have been treated with surgery
between 1 January 2011 and 1 January 2016 in the                Muscle strength was measured by functional muscle tests by
Amsterdam UMC (location AMC), the Netherlands. The              a physiotherapist, prior and after nCRTx as part of another

                                                                                         Journal of Cachexia, Sarcopenia and Muscle 2020
                                                                                                                 DOI: 10.1002/jcsm.12540
Body composition and outcomes following oesophagectomy 3
study.25 Hand grip strength was measured with the Jamar® considered to have sarcopenic obesity if they met the criteria
grip strength dynamometer (Lafayette Instrument Company, for sarcopenia and obesity.
USA), which is considered a reliable instrument to predict
the total skeletal muscle mass.26 Muscle strength of the
lower extremities was assessed with the 30 seconds chair Statistical analysis
stand test. During this test, patients were asked to stand up
from a chair without support of the arms and sit again, re- Patient, tumour, and treatment characteristics were pre-
peating this during 30 s.27 Maximal inspiratory and expiratory sented using descriptive statistics. The mean (± standard
pressure were measured as indicators of respiratory muscle deviation) was used in case of a normal distribution of var-
strength with a micro-medical spirometer.28 iables, and the median (interquartile range) was used for
variables with a skewed distribution. Categorical data were
compared using a χ 2 or Fisher’s exact test where appropri-
ate or Wilcoxon signed rank test for paired data. Continu-
Assessment of body composition ous data were compared using independent t-test. In case
of paired data, the dependent t-test was used. Median
Variables describing body composition included skeletal and overall survival were calculated using Kaplan–Meier
muscle, visceral, subcutaneous, and total adipose tissue curves with subgroups being compared using the log-rank
cross-sectional areas and indexes, presence of sarcopenia, test. Cox proportional hazard model was used for multivar-
body fat percentage, and BMI. In all patients, CT scans iable analysis. Traditional clinical variables potentially
were acquired less than 6 weeks prior to nCRTx and 2 to influencing long-term survival (selected a priori: age, histol-
3 weeks after nCRTx as part of routine preo- ogy, ypT stage, ypN stage, resection margin, and Mandard
perative workup. Skeletal muscle, visceral, subcutaneous, score) were entered in a multivariable analysis of tradi-
and total adipose tissue cross-sectional areas were evalu- tional clinical variables alone if they were significant in
ated on CT images at a standard vertebral landmark (the univariable analysis. Stepwise backwards elimination proce-
midpoint of the third lumbar vertebrae; L3), because tissue dure (P < 0.05 to stay in the model) was used to reduce
areas in this region are significantly related to whole-body the number of predictors. Then body composition and mus-
composition.29,30 cle strength variables that were significant in univariate
Three independent researchers (E.H., M.F., and P.B.) mea- analysis were added to the models. Missing data were han-
sured the muscle surface area using Slice-O-Matic® software, dled with complete case analysis. All analyses were exe-
and the mean of the three measurements was the final value. cuted in SPSS version 25.0 (SPSS Corp. Chicago, IL, USA).
One researcher (P.B.) measured subcutaneous, visceral, and All tests were two-sided, and P values less than 0.05 were
total adipose tissue areas because software add-on for these considered significant.
measurements was only available at his institute. Hounsfield
unit thresholds of 29 to 150 for skeletal muscles (the psoas,
paraspinal, transverse abdominal, internal and external Results
oblique, and rectus abdominis muscles), 50 to 150 for
visceral adipose tissue, and 190 to 30 for subcutaneous Patient characteristics
adipose tissue were used to differentiate muscle and adipose
tissue from other tissues.31 From January 2011 until January 2016, 362 patients
Skeletal muscle index was calculated using the formula underwent an oesophageal resection after nCRTx, of whom
skeletal muscle surface index = skeletal muscle surface 322 patients were eligible for inclusion. In 175 patients, both
area / height2, expressed in square centimetre per square the CT scans prior to nCRTx and after nCRTx were available
metre. For women, sarcopenia was present if the skeletal and eligible for analysis. A flowchart of patient selection is
muscle surface index was less than 41 cm2/m2. For men, shown in Figure 1. Baseline characteristics of all included pa-
sarcopenia was present when the skeletal muscle surface in- tients are shown in Table 1. All patients in this cohort finished
dex was less than 53 cm2/m2 in case of a BMI of ≥25 kg/m2 or the planned nCRTx regimen.
the skeletal muscle surface index was less than 43 cm2/m2 in
case of a BMI of 44.4% and >35.7% for men.30,34 Patients were mean age and proportion of women were higher in patients
Journal of Cachexia, Sarcopenia and Muscle 2020
DOI: 10.1002/jcsm.125404 E.R.C. Hagens et al.
Figure 1 Flowchart patient selection. Insufficient quality for measurements includes the following: Tissue was cut off from the frame, and/or the CT
scan was not in portal phase, and/or it was not a high-resolution scan. CT, computed tomography; nCRTx, neoadjuvant chemoradiation.
with sarcopenia (P = 0.005 and P < 0.001, respectively). Base- P = 0.001) and grip strength of the non-dominant hand (mean
line characteristics of patients with and without sarcopenia increase of 1.4 kg, 95% CI 0.5–2.4, P = 0.004).
prior to nCRTx and after nCRTx are shown in Table 1.
Influence of body composition and muscle strength
on post-operative complications
Relation between sarcopenia, body composition,
and muscle strength Sarcopenia, sarcopenic obesity, and BMI, skeletal muscle in-
dex, body fat percentage, and muscle strength were mea-
Table 2 shows the association between sarcopenia, body fat sured as continuous variables, and all were not prior and
percentage, and muscle strength. Patients with sarcopenia after nCRTx significantly related to the incidence and severity
both prior to nCRTx and after nCRTx had a significantly lower of post-operative complications (Table 3).
muscle strength and higher fat percentage compared with A BMI of ≥26 kg/m2 prior to nCRTx was associated with a
patients without sarcopenia. No association was seen be- higher incidence of anastomotic leakage (15.9% of the pa-
tween visceral and subcutaneous adipose tissue indexes and tients with a BMI between 18 and 25 kg/m2 and 26.0% of
sarcopenia. Sarcopenic obesity was present in 11 (6.4%) the patients with a BMI of ≥26 kg/m2 developed anastomotic
sarcopenic patients prior to nCRTx and in 8 (3.0%) sarcopenic leakage, P = 0.032). Obesity did not significantly influence the
patients after nCRTx. incidence of other complications (data not shown).
Figure 2 shows the correlation between BMI (as continu-
ous variable), skeletal muscle index, body fat percentage,
and hand grip strength and the incidence of anastomotic
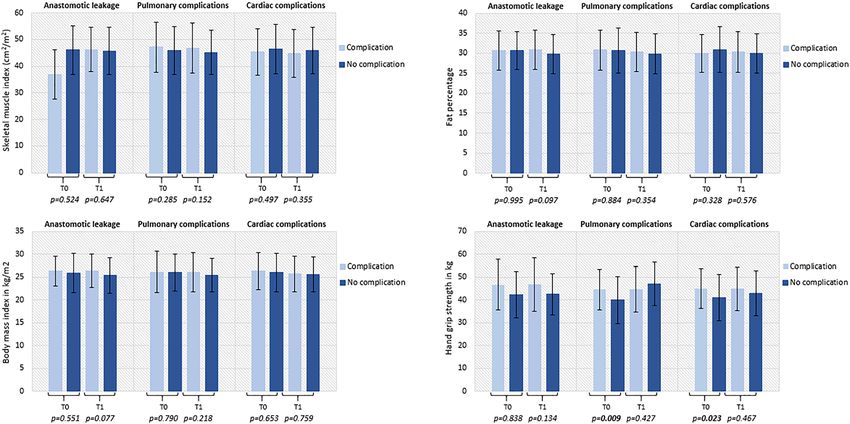
Influence of neoadjuvant chemoradiation on body leakage, pulmonary complications, and cardiac complica-
composition and muscle strength tions. Pulmonary and cardiac complications were signifi-
cantly associated with a lower handgrip strength when
Most body composition parameters showed a significant measured prior to nCRTx (P = 0.023 and P = 0.009,
change during nCRTx; the incidence of sarcopenia increased respectively).
(55.6–58.2%, P = 0.082) while the mean BMI and fat percent-
age decreased [ 0.4 kg/m2, 95% confidence interval (CI)
0.3 to 0.5, P < 0.001, and 0.6%, 95% CI 0.04 to 1.2,
P = 0.036, respectively]. Influence of body composition and muscle strength
All muscle strength tests showed an increase in muscle on long-term survival
strength during nCRTx (data not shown). The strongest in-
crease of muscle strength was seen in the maximal expiratory The median follow-up time was 37.6 months (95% CI 28.1–
pressure (mean increase of 9.4 cmH2O, 95% CI 3.7–15.1, 47.2). Patients with sarcopenia prior to nCRTx had a median
Journal of Cachexia, Sarcopenia and Muscle 2020
DOI: 10.1002/jcsm.12540Body composition and outcomes following oesophagectomy 5
Table 1 Baseline characteristics of all included patients
Prior to nCRTx After nCRTx
All patients Sarcopenia No sarcopenia Sarcopenia No sarcopenia
P
n = 322 n = 125 n = 100 value n = 155 n = 112 P value
Age, mean ± SD 63.7 ± 8.7 64.9 ± 8.4 61.6 ± 8.9 0.005 65.6 ± 7.7 61.1 ± 9.0 128 cm2 after nCRTx
strength variables showed a significant association with lower remained significantly associated with worse overall survival.
Journal of Cachexia, Sarcopenia and Muscle 2020
DOI: 10.1002/jcsm.125406 E.R.C. Hagens et al.
Table 2 Association between sarcopenia and fat mass and muscle strength
Prior to nCRTx After nCRTx
Sarcopenia No sarcopenia P value Sarcopenia No sarcopenia P value
n = 125 n = 100 n = 155 n = 112
Adipose tissue
2 2
Visceral adipose tissue index (cm /m ) 51.8 ± 34.8 50.6 ± 32.0 0.798 44.2 ± 29.0 46.2 ± 29.3 0.587
2 2
Subcutaneous adipose tissue index (cm /m ) 54.4 ± 26.9 52.8 ± 31.6 0.687 53.7 ± 23.8 51.2 ± 31.8 0.492
a 2 2
Total adipose tissue index (cm /m ) 106.2 ± 48.3 203.4 ± 54.7 0.692 97.9 ± 43.7 97.4 ± 53.1 0.924
Fat percentage 31.6 ± 5.5 29.6 ± 5.3 0.006 30.6 ± 4.5 29.1 ± 5.4 0.017
n = 36 n = 35 n = 44 n = 35
Muscle strength
Hand grip strength, dom (kg) 40.1 ± 11.7 44.1 ± 8.2 0.108 40.2 ± 9.8 47.3 ± 8.1 0.001
Hand grip strength, ndom (kg) 37.9 ± 10.6 42.7 ± 8.3 0.037 37.5 ± 9.7 44.6 ± 7.8 0.001
30 s chair stand test (number of stands) 17.5 ± 4.2 20.11 ± 4.8 0.016 16.6 ± 5.6 22.1 ± 8.2 0.001
Maximal inspiratory pressure (cmH2O) 84.4 ± 28.5 108.6 ± 31.8 0.001 86.7 ± 24.2 113.7 ± 26.5Table 3 Influence of body composition and muscle strength on no, minor, and major complications
Prior to nCRTx After nCRTx
No complication Minor complication Major complication P value No complication Minor complication Major complication P value
n = 86 n = 95 n = 44 n = 94 n = 107 n = 66
Body composition
Body composition and outcomes following oesophagectomy
Sarcopenia, n (%) 50 (58.1) 53 (55.8) 22 (50.0) 0.675 52 (55.3) 64 (59.8) 39 (59.1) 0.797
Sarcopenic obesity, n (%) 8 (9.3) 6 (6.3) 2 (4.5) n/a 3 (3.2) 4 (3.7) 1 (1.5) n/a
2 2
Skeletal muscle index (cm /m ) 46.2 ± 9.3 46.1 ± 8.6 46.9 ± 10.1 0.866 46.3 ± 8.7 45.0 ± 8.5 46.3 ± 9.2 0.479
2
BMI (kg/m ) 25.9 ± 4.0 25.9 ± 4.0 26.5 ± 4.7 0.710 25.6 ± 3.6 25.4 ± 3.9 25.9 ± 4.2 0.756
Fat percentage 30.7 ± 58 30.8 ± 5.7 30.6 ± 4.4 0.965 30.0 ± 4.8 29.9 ± 5.4 30.5 ± 4.4 0.570
2 2
Visceral adipose tissue index (cm /m ) 52.8 ± 34.8 50.8 ± 32.5 48.0 ± 32.9 0.773 44.5 ± 27.8 43.9 ± 29.2 47.8 ± 43.8 0.648
2 2
Subcutaneous adipose tissue index (cm /m ) 51.5 ± 28.0 53.4 ± 30.3 58.1 ± 29.8 0.592 52.8 ± 26.8 51.4 ± 27.2 56.3 ± 32.4 0.478
2 2
Total adipose tissue indexa (cm /m ) 104.4 ± 53.3 104.2 ± 51.7 106.1 ± 48.4 0.984 96.3 ± 45.9 95.4 ± 48.8 104.6 ± 53.3 0.471
n = 86 n = 95 n = 44 n = 86 n = 95 n = 44
Muscle strength
Hand grip strength, dom (kg) 40.3 ± 10.0 43.4 ± 8.7 43.9 ± 13.6 0.405 41.5 ± 8.1 44.1 ± 9.5 45.4 ± 12.6 0.376
Hand grip strength, ndom (kg) 39.1 ± 8.4 41.3 ± 8.4 41.2 ± 11.9 0.659 40.2 ± 9.4 41.8 ± 8.7 39.8 ± 11.3 0.747
30 s chair stand test (number of stands) 39.1 ± 8.4 17.7 ± 4.7 20.2 ± 5.1 0.264 18.6 ± 8.4 18.4 ± 6.0 20.8 ± 7.3 0.569
Maximal inspiratory pressure (cmH2O) 97.3 ± 31.1 98.0 ± 35.4 89.3 ± 30.1 0.724 98.0 ± 29.2 99.0 ± 26.6 99.2 ± 31.8 0.761
Maximal expiratory pressure (cmH2O) 128.9 ± 44.1 133.5 ± 39.9 128.3 ± 45.0 0.904 133 ± 38.7 140.7 ± 41.1 143.3 ± 49.4 0.675
Values are presented as mean ± standard deviation unless otherwise indicated; major complications are defined as complications of Clavien–Dindo grade IIIB or higher. BMI, body mass
index; dom, dominant hand; n/a, not applicable; nCRTx, neoadjuvant chemoradiation; ndom, non-dominant hand.
a
Total adipose tissue index based on the sum of visceral and subcutaneous adipose tissue surface areas.
Journal of Cachexia, Sarcopenia and Muscle 2020
DOI: 10.1002/jcsm.12540
78 E.R.C. Hagens et al.
Figure 2 Influence of body composition and muscle strength on post-operative complications. T0 is prior to neoadjuvant therapy, and T1 is after neo-
adjuvant therapy and prior to surgery.
Table 4 Multivariable analysis on the influence of traditional clinical factors, body composition, and muscle strength on overall survival according to
the Cox proportional hazard model
Prior to nCRTx After nCRTx
HR (95% CI) P value HR (95% CI) P value
Traditional clinical variables
ypN categorya
N1 0.95 (1.02–3.73) 0.096 1.85 (1.23–2.79) 128 cm 1.81 (1.30–2.53) 0.001
Results are based on fitting separate univariate Cox models for each factor followed by stepwise variable selection (Supporting Informa-
tion, Table S1); bold values represent statistical significance. CI, confidence interval; HR, hazard ratio; nCRTx, neoadjuvant chemoradia-
tion; TRG, tumour regression grade; VAT, visceral adipose tissue surface area.
a
ypN stage based on AJCC 8th, reference group is N0.
b
Reference group is TRG 1–2.
c
There was no linearity between VAT and log hazard; therefore, VAT has been dichomatized by median split.
A Japanese study, including patients with mostly squamous The present study showed a relation between visceral ad-
cell carcinoma, found a significant difference in post- ipose tissue area and long-term survival, but not between
operative complications and mortality in older patients with long-term survival and subcutaneous adipose tissue or body
and without sarcopenia. They did not find this effect in youn- fat percentage. This indicates that the distribution of adipose
ger patients.43 This suggests that not only the amount of tissue might play a role in long-term survival. Other studies
muscle but also the quality of the muscle is of influence, suggest that visceral adipose tissue surface area is related
and younger patients might have better muscle quality.44,45 to a higher inflammation and an adverse cardiometabolic risk
A recent study on the influence on skeletal muscle surface in- profile. These conditions may directly promote tumour pro-
dex and skeletal muscle quality showed that preoperative gression or predict other co-morbid conditions such as car-
skeletal muscle quantity does not influence post-operative diovascular disease that can further impair survival.47–49 On
outcomes after a pancreatoduodenectomy but showed that the other hand, subcutaneous adipose tissue might play a
the muscle quality, determined as muscle attenuation index, protective role in overall survival in cancer patients as it
does have a major effect on post-operative complications.46 may provide protective nutritional reserves.50 Therefore, if
Journal of Cachexia, Sarcopenia and Muscle 2020
DOI: 10.1002/jcsm.12540Body composition and outcomes following oesophagectomy 9
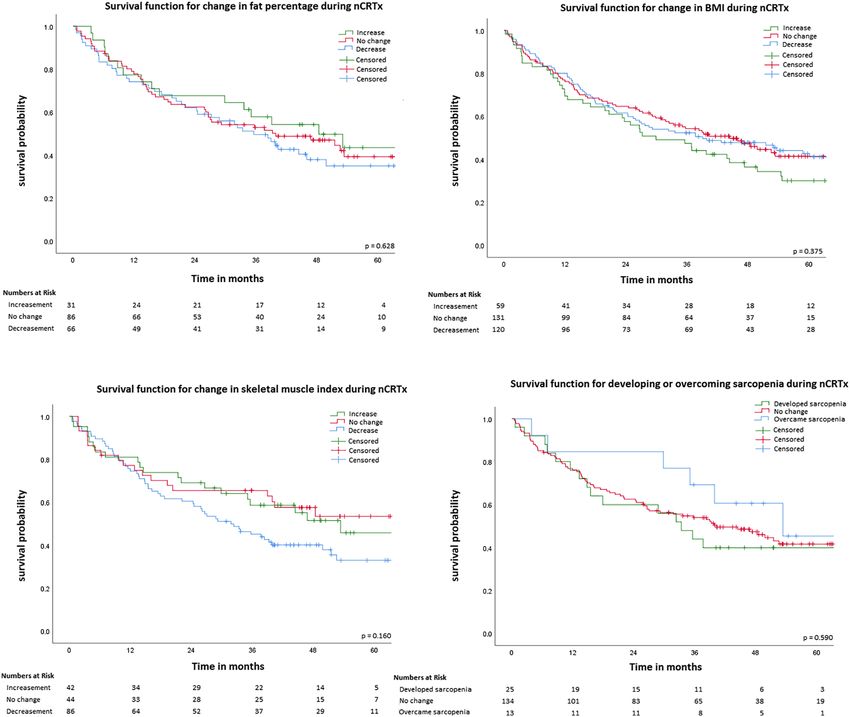
Figure 3 Kaplan–Meier survival curves. Change in fat percentage defined as at least 2% change, change in BMI defined as at least 1 unit change,
2 2
change in skeletal muscle index defined as at least 1.5 cm /m change. P values based on log-rank test. BMI, body mass index; nCRTx, neoadjuvant
chemoradiation.
possible, the amount of visceral adipose tissue should be together with the retrospective nature of the study. More-
aimed to be decreased in oesophageal cancer patients. over, the influence of sarcopenic obesity on post-operative
Furthermore, two reviews showed that patients with a complications or long-term survival could not be assessed
high BMI have a better overall 5 years of survival, which properly because the incidence of sarcopenic obesity in this
was not encountered in the present study.17,39 This phenom- cohort was very low. Sarcopenic obesity has been reported
enon is also seen in other types of cancer and is called the as one of the most powerful independent predictors of poor
BMI paradox. The BMI paradox is a hypothesis that holds that survival for patients with cancer.16,53 It should also be men-
BMI is, counterintuitively, associated with higher survival in tioned that handgrip strength is less reliable in older patients
certain groups of people, such as patients with cancer. A the- and the chair stand test can be influenced by co-morbidities.
ory behind the BMI paradox is that BMI cannot be regarded a The cohort in this study has a median age of 65 years, and al-
proxy for the amount or location of adipose tissue, nor for most half of the patients have co-morbidities; this might have
muscle mass and muscle quality. A healthy BMI can mask ex- made the muscle strength outcomes less reliable.
cess adiposity, which is associated with worse survival, and Also, no standardized cut-off values for sarcopenia exist.
patients with a high BMI do not necessarily have a high Most of the oncological studies use sex-specific cut-off values
amount of adipose tissue.51 A wide amount of other theories determined by Prado et al.54 This was a study in obese pa-
behind the BMI paradox such as methodological explanations tients with, aside from gastrointestinal tumours, also tumours
and other clinical explanations exist.52 in the respiratory tract. This population differs systematically
Our study has some limitations. Skeletal muscle strength from patients with oesophageal cancer, and therefore, these
was only assessed in patients who were also included in an- cut-off values might not be applicable. The present study
other study.25 Patients’ characteristics of this cohort were used the cut-off values by Martin et al., which are more appli-
comparable with the total population in the study but were cable to patients in our cohort.32 Strengths of this study were
much smaller than the total number of patients in the pres- that the measurements on the CT scans were performed by
ent study. This might have contributed to selection bias, different researchers and then the mean surface area was
Journal of Cachexia, Sarcopenia and Muscle 2020
DOI: 10.1002/jcsm.1254010 E.R.C. Hagens et al.
calculated, reducing the intra-observer variability. Only CT Online supplementary material
scans of sufficient quality were included. Studies show that
CT scan quality influences measurements of surface areas Additional supporting information may be found online in the
on CT slices, especially portal phase and slice thickness.30,55 Supporting Information section at the end of the article.
Furthermore, we did not only focus on skeletal muscle sur-
face or sarcopenia, but we also focused on other parameters Table S1. Univariable and multivariable analysis of traditional
of body composition and muscle strength. clinical factors and body composition and muscle strength for
In order to determine the precise influence of body com- predicting overall risk of mortality
position and muscle strength on short-term and long-term
outcomes, future studies should use a uniform method of
measuring body composition. A large prospective study is
necessary to not only study muscle mass but also at muscle
Conflict of interest
quality, muscle strength, BMI, and adipose tissue distribution
E.H., M.F., M.E., M.H., P.B., and D.L. have nothing to de-
and quantity.
clare. H.V.L. has served as a consultant for BMS, Celgene,
In conclusion, sarcopenia occurs frequently in patients
Lilly, and Nordic and has received unrestricted research
with oesophageal cancer and is associated with less muscle
funding from Bayer, BMS, Celgene, Lilly, Merck Serono,
strength and a higher fat percentage. Impaired muscle
MSD, Nordic, Philips, and Roche. M.V.B.H. is consultant
strength and a high amount of visceral adipose tissue are as-
for Mylan and Medtronic and Johnson & Johnson and has
sociated with worse short-term outcomes and worse survival.
received research/travel grants from Olympus, Medtronic,
Therefore, patients with poor fitness might benefit from pre-
and Stryker. S.G. is consultant for Medtronic and has re-
operative nutritional and muscle strengthening guidance,
ceived a research grant from Olympus. The authors certify
aiming to increase muscle strength and decrease visceral ad-
that they comply with the ethical guidelines for publishing
ipose tissue. However, this hypothesis should be confirmed in
in the Journal of Cachexia, Sarcopenia and Muscle: update
a large prospective study.
2019.56
Funding
None.
References
1. Straatman J, van der Wielen N, or junctional cancer (CROSS): long-term re- 11. Tamandl D, Paireder M, Asari R, Baltzer PA,
Nieuwenhuijzen GAP, Rosman C, Roig J, sults of a randomised controlled trial. Lan- Schoppmann SF, Ba-ssalamah A. Markers
Scheepers JJ, et al. Techniques and cet Oncol 2015;16:1090–1098. of sarcopenia quantified by computed to-
short-term outcomes for total minimally 5. Buderi SI, Shackcloth M, Page RD. Does mography predict adverse long-term out-
invasive Ivor Lewis esophageal resection neoadjuvant chemoradiotherapy increase come in patients with resected
in distal esophageal and gastroesophageal survival in patients with resectable oesoph- oesophageal or gastro-oesophageal junc-
junction cancers: pooled data from six ageal cancer? Interact Cardiovasc Thorac tion cancer. 2015.
European centers. Surg Endosc 2017;31: Surg 2017;24:115–120. 12. Sheetz KH, Zhao L, Holcombe SA, Wang
119–126. 6. Evans WJ. Skeletal muscle loss: cachexia, SC, Reddy RM, Lin J, et al. Decreased
2. Biere SS, van Berge Henegouwen MI, Maas sarcopenia, and inactivity. Am J Clin Nutr core muscle size is associated with worse
KW, Bonavina L, Rosman C, Garcia JR, 2010;91:1123–1127. patient survival following esophagectomy
et al. Minimally invasive versus open 7. Evans WJ, Morley JE, Argilés J, Bales C, for cancer. Dis Esophagus
oesophagectomy for patients with oesoph- Baracos V, Guttridge D, et al. Cachexia: a 2013;26:716–722.
ageal cancer: a multicentre, open-label, new definition. Clin Nutr 2008;27:793–799. 13. Yip C, Goh V, Davies A, Gossage J, Mitch-
randomised controlled trial. Lancet 8. Fearon K, Strasser F, Anker SD, Bosaeus I, ell-Hay R, Hynes O, et al. Assessment of
2012;379:1887–1892. Bruera E, Fainsinger RL, et al. Definition sarcopenia and changes in body composi-
3. van Hagen P, Hulshof MCCMC, van and classification of cancer cachexia: an in- tion after neoadjuvant chemotherapy and
Lanschot JJBJ, Steyerberg EWW, van Berge ternational consensus. Lancet Oncol associations with clinical outcomes in oe-
Henegouwen MI, Wijnhoven BPLP, et al. 2011;12:489–495. sophageal cancer. Eur Radiol
Preoperative chemoradiotherapy for 9. Anandavadivelan P, Lagergren P. Cachexia 2014;24:998–1005.
esophageal or junctional cancer. N Engl J in patients with oesophageal cancer. Nat 14. Grotenhuis BA, Shapiro J, van Adrichem S,
Med 2012;366:2074–2084. Rev Clin Oncol 2015;13:185, advance on. de Vries M, Koek M, Wijnhoven BPL,
4. Shapiro J, van Lanschot JJB, Hulshof 10. Bozetti F, Migliavacca S, Scotti A, Bonalumi et al. Sarcopenia/muscle mass is not a
MCCM, van Hagen P, van Berge MG, Scarpa DBF. Impact of cancer, type, prognostic factor for short- and
Henegouwen MI, Wijnhoven BPL, et al. site, stage and treatment on the nutritional long-term outcome after esophagectomy
Neoadjuvant chemoradiotherapy plus sur- status of patients. Ann Surg 1982;196: for cancer. World J Surg
gery versus surgery alone for oesophageal 170–179. 2016;40:2698–2704.
Journal of Cachexia, Sarcopenia and Muscle 2020
DOI: 10.1002/jcsm.12540Body composition and outcomes following oesophagectomy 11
15. Gregor MF, Hotamisligil GS. Inflammatory postoperative pulmonary complications high body mass index in esophageal cancer
mechanisms in obesity. Annu Rev Immunol post-esophagectomy. Dis Esophagus patients does not influence postoperative
2011;29:415–445. 2011;24:489–494. outcome or long-term survival. Ann Surg
16. Cruz-Jentoft AJ, Baeyens JP, Bauer JM, 29. Shen W. Total body skeletal muscle and ad- Oncol 2012;19:766–771.
Boirie Y, Cederholm T, Landi F, et al. ipose tissue volumes: estimation from a 41. Elliott JA, Doyle SL, Murphy CF, King S,
Sarcopenia: European consensus on defini- single abdominal cross-sectional image. J Guinan EM, Beddy P, et al. Sarcopenia.
tion and diagnosis: report of the European Appl Physiol 2004;97:2333–2338. Ann Surg 2017;266:1.
Working Group on Sarcopenia in Older Peo- 30. Mourtzakis M, Prado CMM, Lieffers JR, 42. Blom RLGM, Sosef MN, Nap M, Lammering
ple. Age Ageing 2010;39:412–423. Reiman T, Mccargar LJ, Baracos VE. A prac- G, van den Berkmortel F, Hulshof MCCM,
17. Mengardo V, Pucetti F, Mc Cormack O, tical and precise approach to quantification et al. Comparison of two neoadjuvant che-
Chaudry A, Allum WH. The impact of obe- of body composition in cancer patients moradiotherapy regimens in patients with
sity on esophagectomy: a meta-analysis. using computed tomography images ac- potentially curable esophageal carcinoma.
Dis Esophagus. December 2017. quired during routine care. Appl Physiol Dis esophagus Off J Int Soc Dis Esophagus
18. Boshier PR, Heneghan R, Markar SR, Nutr Metab 2008;1006:997–1006. 2014;27:380–387.
Baracos VE, Low DE. Assessment of body 31. Mitsiopoulos N, Baumgartner RN, 43. Nakashima Y, Saeki H, Nakanishi R, Sugi-
composition and sarcopenia in patients Heymsfield SB, Lyons W, Gallagher D, Ross yama M, Kurashige J, Oki E, et al. Assess-
with esophageal cancer: a systematic re- R. Cadaver validation of skeletal muscle ment of sarcopenia as a predictor of poor
view and meta-analysis. Dis esophagus Off measurement by magnetic resonance im- outcomes after esophagectomy in elderly
J Int Soc Dis Esophagus. May 2018. aging and computerized tomography. patients with esophageal cancer. Ann Surg
19. Okamura A, Watanabe M, Yamashita K, 1998;85:115–122. 2017;267:1100–1104.
Yuda M, Hayami M, Imamura Y, et al. Impli- 32. Martin L, Birdsell L, Macdonald N, Reiman 44. Goodpaster BH, Park SW, Harris TB,
cation of visceral obesity in patients with T, Clandinin MT, McCargar LJ, et al. Can- Kritchevsky SB, Nevitt M, Schwartz AV,
esophageal squamous cell carcinoma. cer cachexia in the age of obesity: skele- et al. The loss of skeletal muscle strength,
Langenbecks Arch Surg 2018;403:245–253. tal muscle depletion is a powerful mass, and quality in older adults: the
20. Saeed N, Shridhar R, Almhanna K, Hoffe S, prognostic factor, independent of body health, aging and body composition study.
Chuong M, Meredith K. CT-based assess- mass index. J Clin Oncol 2013;31: J Gerontol A Biol Sci Med Sci
ment of visceral adiposity and outcomes 1539–1547. 2006;61:1059–1064.
for esophageal adenocarcinoma. J 33. Lee JS, Lee HS, Ha JS, Han KS, Rha KH, Hong 45. Abe T, Thiebaud RS, Loenneke JP. Age-re-
Gastrointest Oncol 2017;8:833–841. SJ, et al. Subcutaneous fat distribution is a lated change in handgrip strength in men
21. von Elm E, Altman DG, Egger M, Pocock SJ, prognostic biomarker for men with castra- and women: is muscle quality a contribut-
Gotzsche PC, Vandenbroucke JP. Strength- tion resistant prostate cancer. J Urol ing factor? Age (Dordr) 2016;38:28.
ening the Reporting of Observational Stud- 2018;200:114–120. 46. Van Rijssen LB, van Huijgevoort NCM,
ies in Epidemiology (STROBE) statement: 34. Baumgartner RN, Wayne SJ, Waters DL, Coelen RJS, Tol JA, Haverkort EB, Nio CY,
guidelines for reporting observational stud- Janssen I, Gallagher D, Morley JE. et al. Skeletal muscle quality is associated
ies. BMJ 2007;335:806–808. Sarcopenic obesity predicts instrumental with worse survival after
22. de Boer Maureen M, Wijnhoven B, van der activities of daily living disability in the el- pancreatoduodenectomy for periampu-
Gaast A, Rozema T, Grard Nieuwenhuijzen derly. Obes Res 2004;12:1995–2004. llary, nonpancreatic cancer. Ann Surg Oncol
GJBH en PDS. Herziene richtlijn ‘Oesofagus- 35. Guinan EM, Doyle SL, Bennett AE, O’Neill L, 2017;24:272–280.
carcinoom’. Ned Tijdschr Geneeskd Gannon J, Elliott JA, et al. Sarcopenia dur- 47. Bjorge T, Lukanova A, Tretli S, Manjer J,
2011;155:A3732. ing neoadjuvant therapy for oesophageal Ulmer H, Stocks T, et al. Metabolic risk fac-
23. Dindo D, Demartines N, Clavien P-A. Classi- cancer: characterising the impact on mus- tors and ovarian cancer in the Metabolic
fication of surgical complications: a new cle strength and physical performance. Syndrome and Cancer project. Int J
proposal with evaluation in a cohort of Support care cancer Off J Multinatl Assoc Epidemiol 2011;40:1667–1677.
6336 patients and results of a survey. Ann Support Care Cancer 2018;26:1569–1576. 48. Goodpaster BH, Kelley DE, Wing RR, Meier
Surg 2004;240:205–213. 36. Reisinger KW, Bosmans JWAM, A, Thaete FL. Effects of weight loss on re-
24. Low DE, Alderson D, Cecconello I, Chang Uittenbogaart M, Alsoumali A, Poeze M, gional fat distribution and insulin sensitivity
AC, Darling GE, DJourno XB, et al. Interna- Sosef MN, et al. Loss of skeletal muscle in obesity. Diabetes 1999;48:839–847.
tional consensus on standardization of data mass during neoadjuvant chemoradiother- 49. Park JS, Cho MH, Nam JS, Ahn CW, Cha BS,
collection for complications associated apy predicts postoperative mortality in Lee EJ, et al. Visceral adiposity and leptin
with esophagectomy. Ann Surg esophageal cancer surgery. Ann Surg Oncol are independently associated with C-
2015;262:286–294. 2015;22:4445–4452. reactive protein in Korean type 2 diabetic
25. van Egmond MA, van der Schaaf M, 37. Tan BHL, Brammer K, Randhawa N, Welch patients. Acta Diabetol 2010;47:113–118.
Hagens ERC, van Laarhoven HWM, van NT, Parsons SL, James EJ, et al. Sarcopenia 50. Antoun S, Bayar A, Ileana E, Laplanche A,
Berge Henegouwen MI, Haverkort EB, is associated with toxicity in patients un- Fizazi K, di Palma M, et al. High subcutane-
et al. Muscle strength is associated with dergoing neo-adjuvant chemotherapy for ous adipose tissue predicts the prognosis
muscle mass in patients with esophageal oesophago-gastric cancer. Eur J Surg Oncol in metastatic castration-resistant prostate
cancer awaiting surgery. J Geriatr Phys Ther 2015;41:333–338. cancer patients in post chemotherapy set-
June 2018;n/a:n/a–n/a. 38. Correa-de-Araujo R, Harris-Love MO, ting. Eur J Cancer 2015;51:2570–2577.
26. Trutschnigg B, Kilgour RD, Reinglas J, Miljkovic I, Fragala MS, Anthony BW, 51. Caan BJ, Cespedes Feliciano EM, Kroenke
Rosenthall L, Hornby L, Morais JA, et al. Manini TM. The need for standardized as- CH. The importance of body composition
Precision and reliability of strength (Jamar sessment of muscle quality in skeletal mus- in explaining the overweight paradox in
vs. Biodex handgrip) and body composition cle function deficit and other aging-related cancer-counterpoint. Cancer Res
(dual-energy X-ray absorptiometry vs. muscle dysfunctions: a symposium report. 2018;78:1906–1912.
bioimpedance analysis) measurements in Front Physiol 2017;8:87. 52. Lennon H, Sperrin M, Badrick E, Renehan
advanced cancer patients. Appl Physiol 39. Deng H-Y, Qin C-L, Qiu X-M, Zhou Q. Does AG. The obesity paradox in cancer: a re-
Nutr Metab 2008;33:1232–1239. high body mass index have any impact on view. Curr Oncol Rep 2016;18:1–8.
27. Jones CJ, Rikli RE, Beam WC. A 30-s chair- survival of patients undergoing oesop- 53. Prado CMM, Wells JCK, Smith SR, Stephan
stand test as a measure of lower body hagectomy for oesophageal cancer? Inter- BCM, Siervo M. Sarcopenic obesity: a criti-
strength in community-residing older act Cardiovasc Thorac Surg 2018;26: cal appraisal of the current evidence. Clin
adults. Res Q Exerc Sport 1999;70:113–119. 693–695. Nutr 2012;31:583–601.
28. Feeney C, Reynolds JV, Hussey J. Preopera- 40. Blom RLGM, Lagarde SM, Klinkenbijl JHG, 54. Prado CM, Lieffers JR, McCargar LJ, Reiman
tive physical activity levels and Busch ORC, van Berge Henegouwen MI. A T, Sawyer MB, Martin L, et al. Prevalence
Journal of Cachexia, Sarcopenia and Muscle 2020
DOI: 10.1002/jcsm.1254012 E.R.C. Hagens et al.
and clinical implications of sarcopenic obe- 55. Rollins KE, Javanmard-Emamghissi H, 56. von Haehling S, Morley JE, Coats AJS, Anker
sity in patients with solid tumours of the Awwad A, Macdonald IA, Fearon KCH, Lobo SD. Ethical guidelines for publishing in the
respiratory and gastrointestinal tracts: a DN. Body composition measurement using Journal of Cachexia, Sarcopenia and Mus-
population-based study. Lancet Oncol computed tomography: does the phase of cle: update 2019. J Cachexia Sarcopenia
2008;9:629–635. the scan matter? Nutrition 2017;41:37–44. Muscle 2019;10:1143–1145.
Journal of Cachexia, Sarcopenia and Muscle 2020
DOI: 10.1002/jcsm.12540You can also read