Effects of Resmetirom on Noninvasive Endpoints in a 36-Week Phase 2 Active Treatment Extension Study in Patients With NASH
←
→
Page content transcription
If your browser does not render page correctly, please read the page content below
Hepatology Communications, VOL. 0, NO. 0, 2021

Effects of Resmetirom on Noninvasive
Endpoints in a 36-Week Phase 2 Active
Treatment Extension Study in Patients
With NASH
Stephen A. Harrison,1,2 Mustafa Bashir,3 Sam E. Moussa,4 Kevin McCarty,5 Juan Pablo Frias,6 Rebecca Taub,7 and Naim Alkhouri8

        Resmetirom (MGL-3196), a selective thyroid hormone receptor-β agonist, was evaluated in a 36-week paired liver bi-
        opsy study (NCT02912260) in adults with biopsy-confirmed nonalcoholic steatohepatitis (NASH). The primary end-
        point was relative liver fat reduction as assessed by MRI–proton density fat fraction (MRI-PDFF), and secondary
        endpoints included histopathology. Subsequently, a 36-week active treatment open-label extension (OLE) study was
        conducted in 31 consenting patients (including 14 former placebo patients) with persistently mild to markedly elevated
        liver enzymes at the end of the main study. In patients treated with resmetirom (80 or 100 mg orally per day), MRI-
        PDFF reduction at OLE week 36 was −11.1% (1.5%) mean reduction (standard error [SE]; P < 0.0001) and −52.3%
        (4.4%) mean relative reduction, P < 0.0001. Low-density lipoprotein (LDL) cholesterol (−26.1% [4.5%], P < 0.0001),
        apolipoprotein B (−23.8% [3.0%], P < 0.0001), and triglycerides (−19.6% [5.4%], P = 0.0012; −46.1 [14.5] mg/dL,
        P = 0.0031) were reduced from baseline. Markers of fibrosis were reduced, including liver stiffness assessed by transient
        elastography (−2.1 [0.8] mean kilopascals [SE], P = 0.015) and N-terminal type III collagen pro-peptide (PRO-C3)
        (−9.8 [2.3] ng/mL, P = 0.0004 (baseline ≥ 10 ng/mL). In the main and OLE studies, PRO-C3/C3M (matrix metallo-
        proteinase-degraded C3), a marker of net fibrosis formation, was reduced in resmetirom-treated patients (−0.76 [−1.27,
        −0.24], P = 0.0044 and −0.68, P < 0.0001, respectively). Resmetirom was well tolerated, with few, nonserious adverse
        events. Conclusion: The results of this 36-week OLE study support the efficacy and safety of resmetirom at daily doses
        of 80 mg and 100 mg, used in the ongoing phase 3 NASH study, MAESTRO-NASH (NCT03900429). The OLE
        study demonstrates a potential for noninvasive assessments to monitor the response to resmetirom from an individual
        patient with NASH. (Hepatology Communications 2021;0:1-16).

N
         onalcoholic steatohepatitis (NASH) is a pro-                        NAFLD, including NASH, is associated with a con-
         gressive form of nonalcoholic fatty liver disease                   stellation of comorbid conditions that include metabolic
         (NAFLD), defined as the presence of ≥5%                             syndrome (obesity, type 2 diabetes mellitus, hyperten-
hepatic steatosis with inflammation and hepatocyte                           sion, dyslipidemia) and hypothyroidism and is associ-
injury (e.g., ballooning), with or without fibrosis.(1,2)                    ated with increased cardiovascular risk.(3) Patients with

       Abbreviations: AE, adverse event; ALT, alanine aminotransferase; ANCOVA, analysis of covariance; ApoB, apolipoprotein B; ApoCIII,
    apolipoprotein CIII; AST, aspartate aminotransferase; BL, baseline; C3M, metalloproteinase-degraded collagen III; CAP, controlled-attenuation
    parameter; CFB, change from baseline; CT1, corrected T1; FT3, free T3; FT4, free thyroxine; GGT, gamma-glutamyl transpeptidase; LDL-C,
    low-density lipoprotein–cholesterol; NAFLD, nonalcoholic fatty liver disease; NAS, NASH activity score; NASH, nonalcoholic steatohepatitis; OLE,
    open-label extension; Pbo, placebo; PDFF, proton density fat fraction; PRO-C3, N-terminal type III collagen propeptide; Res, resmetirom; RT3,
    reverse T3; SHBG, sex hormone binding globulin; THR-β, thyroid hormone receptor-β; T3, triiodothyronine; ULN, upper limit of normal; VCTE,
    vibration-controlled transient elastography.
      Received October 19, 2020; accepted November 22, 2020.
      Additional Supporting Information may be found at onlinelibrary.wiley.com/doi/10.1002/hep4.1657/suppinfo.
      Supported by Madrigal Pharmaceuticals, West Conshohocken, Pennsylvania.
      © 2021 The Authors. Hepatology Communications published by Wiley Periodicals LLC on behalf of the American Association for the Study of Liver
    Diseases. This is an open access article under the terms of the Creative Commons Attribution-NonCommercial-NoDerivs License, which permits use
    and distribution in any medium, provided the original work is properly cited, the use is non-commercial and no modif ications or adaptations are
    made.

                                                                                                                                                       1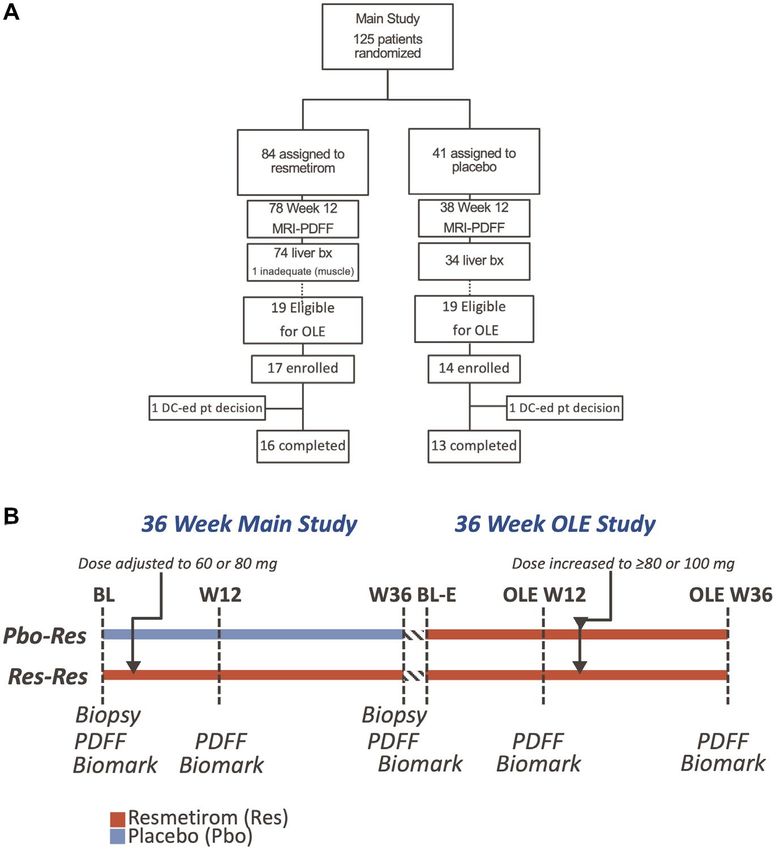
HARRISON ET AL.                                                                         Hepatology Communications, Month 2021

more advanced NASH fibrosis have increased morbid-                               in patients with NAFLD/NASH relative to age-
ity and mortality from both cardiovascular disease(4)                            matched controls.(15,16)
and from progression of their liver disease, including                              Resmetirom (MGL-3196) is a liver-directed, orally
progression to cirrhosis, liver failure, and hepatocellular                      active agonist of thyroid hormone receptor (THR)
carcinoma.(5,6) Diagnosis of NASH is complicated by                              that is about 28-fold more selective than triiodothy-
the requirement for an invasive procedure, liver biopsy,                         ronine (T3) for THR-β versus THR-α.(17,18) It is
to confirm diagnosis, and there is an unmet need for                             highly protein bound (>99%), has poor tissue pene-
noninvasive biomarkers and imaging that can diagnose                             tration outside the liver, and demonstrates specific
and stage advanced NASH with fibrosis(7,8) and mon-                              uptake into the liver. In NASH, selectivity for THR-β
itor a patient’s response to treatment.                                          may provide metabolic benefits of thyroid hormone
   There is no approved therapy for NASH, and its                                that are mediated by the liver, including reduction
prevalence has increased with increasing world-wide                              of excess hepatic fat, atherogenic lipids (low-density
prevalence of obesity.(9,10) Obeticholic acid, a bile acid                       lipoprotein–cholesterol [LDL-C], triglycerides), and
analog that activates farnesoid X receptors, improved                            lipoproteins (apolipoprotein B [ApoB], lipoprotein[a]
fibrosis in a phase 3 clinical trial in patients with                            [Lp(a)], Apo CIII), while avoiding unwanted systemic
NASH and F2 or F3 fibrosis.(11) For other agents                                 actions of excess thyroid hormone in heart and bone
assessed in patients with NASH, trials with serial liver                         that are largely mediated through THR-α.(15)
biopsies did not meet the primary endpoints of fibro-                               In a 36-week phase 2 serial liver biopsy NASH
sis reduction or NASH resolution.(12-14)                                         clinical trial, resmetirom demonstrated statistically
   Evidence suggests that NASH may be, in part, a                                significant reductions compared with placebo in
condition of diminished liver thyroid hormone lev-                               MRI–proton density fat fraction (PDFF) (a measure
els or hepatic hypothyroidism, and that the incidence                            of liver steatosis), liver enzymes, atherogenic lipids,
of clinical and subclinical hypothyroidism is higher                             and Lp(a), markers of inflammation and fibrosis.(19)

       View this article online at wileyonlinelibrary.com.
       DOI 10.1002/hep4.1657
       Potential conflict of interest: Dr. Harrison owns stock in, advises, consults, and received grants from Akero, Galectin, Genf it, Hepion, Metacrine,
    NGM, and Northsea. He advises, consults for, and received grants from Axcella, Civi, Cymabay, Galmed, Gilead, Hightide, Intercept, Madrigal,
    Novartis, Novo Nordisk, Poxel, and Sagimet. He owns stock in, advises, and consults for Histoindex. He owns stock in and advises Pathai. He owns
    stock in and received grants from Cirus. He advises and consults for Altimmune, Echosens, Foresite Labs, Indalo, Medpace, Prometic, Ridgeline, and
    Terns. He consults and received grants from Enyo and Viking. He advises 89 Bio, Arrowhead, and Theratechnologies. He consults for Boston, B Riley
    FBR, Canfite, Fibronostics, Fortress, GNS Healthcare, Inipharm, Ionis, Kowa Research Institute, Microba PTY, Piper Sandler & Co., and Sonic
    Incytes Medical Corp. Dr. Frias consults for, is on the speakers’ bureau for, and received grants from Merck and Sanof i. He consults and received
    grants from Boerhinger Ingelheim, Eli Lilly, and Novo Nordisk. He consults for Altimmune, Axcella, Coherus, Gilead, and Intercept. He received
    grants from Allergan, AstraZeneca, BMS, Janseen, Madrigal, Novartis, Pf izer, and Theracos. Dr. Alkhouri consults for and is on the speakers’ bureau
    for Gilead, Intercept, and Echosens. He consults for and received grants from Pf izer. He consults for Allergan and Perspectum. He is on the speakers’
    bureau for AbbVie and Alexion. He received grants from Akero, NGM, NorthSea, Genf it, Madrigal, Novo Nordisk, and Zydus. Dr. Bashir consults
    for ICON and PLC. He received grants from Carmot, CymaBay, Madrigal, Metacrine, NGM, Pinnacle Clinical Research, and ProSciento. Dr. Taub
    owns stock and is employed by Madrigal.

    ARTICLE INFORMATION:
    From the 1 Radcliffe Department of Medicine, University of Oxford, Oxford, United Kingdom; 2 Department of Medicine, Pinnacle
    Clinical Research, San Antonio, TX, USA; 3 Department of Radiology, Center for Advanced Magnetic Resonance, Duke University
    Medical Center, Durham, NC, USA; 4 Department of Medicine, University of Arizona for Medical Sciences, Tuscon, AZ, USA;
    5
      Medpace, Cincinnati, OH, USA; 6 Department of Medicine, University of California, San Diego, CA, USA; 7 Madrigal Pharmaceuticals,
    West Conshohocken, PA, USA; 8 Arizona Liver Health, Phoenix, AZ, USA.

    ADDRESS CORRESPONDENCE AND REPRINT REQUESTS TO:
    Stephen A. Harrison, M.D.                                                  San Antonio, TX 78229
    Pinnacle Clinical Research                                                 E-mail: stephenharrison87@gmail.com
    5109 Medical Dr. Ste. 200                                                  Tel.: +1-210-982-0320

2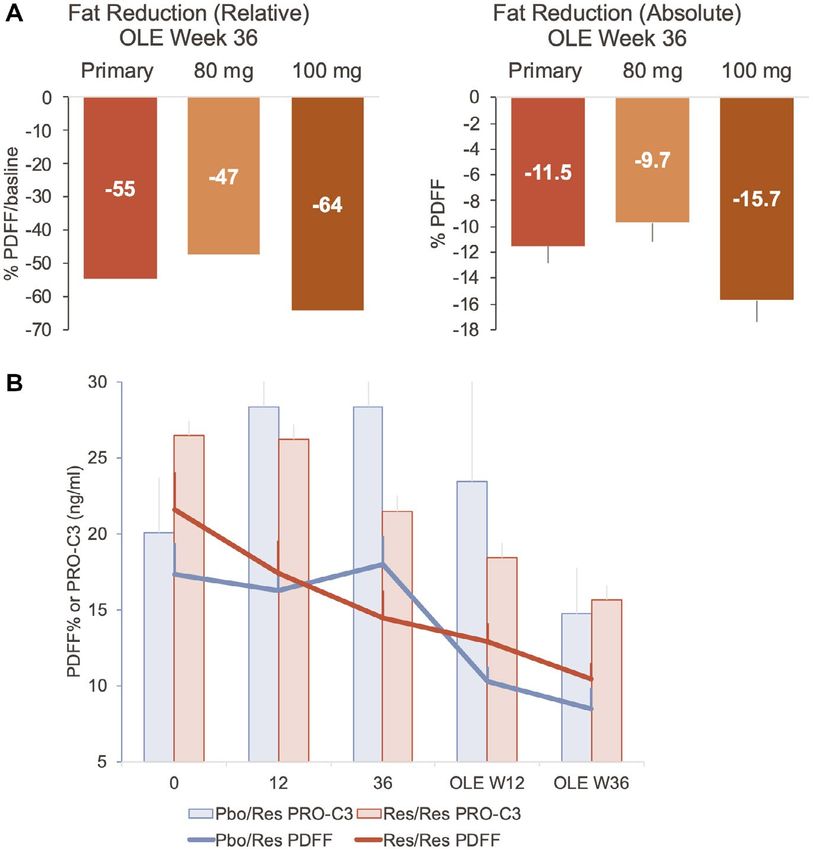
Hepatology Communications, Vol. 0, No. 0, 2021                                                   HARRISON ET AL.

Resmetirom-treated patients also had improvements           allow patients to enroll in a 36-week active treatment
in NASH on liver biopsy compared with placebo.              OLE study in which all patients received open-label
Patients who were on higher doses of resmetirom             resmetirom treatment, and safety, serial imaging, and
(≥80 mg vs. 60 mg), or who had higher exposure to           biomarker assessments were conducted.
resmetirom and/or demonstrated greater reduction in            Eligibility for the OLE study was defined in
hepatic fat on week 12 MRI-PDFF, had a higher inci-         the protocol amendment dated November 6, 2017.
dence of NASH resolution and liver fibrosis reduction.      Patients eligible for entry into the OLE study must
An active treatment open-label extension (OLE) study        have completed the main 36-week study after the
was conducted in a subset of patients completing the        OLE study amendment was approved, undergone a
36-week main study, who were predicted to have an           liver biopsy and MRI-PDFF assessment at week 36,
incomplete response to either placebo or resmetirom         and had ALT or AST levels that had not fully normal-
treatment in the main study based on residual mini-         ized during weeks 16-30 of the main study (normal
mally to markedly elevated liver enzymes (alanine ami-      defined as ALT ≤ 30 IU/L for males and ≤19 IU/L
notransferase [ALT] and/or aspartate aminotransferase       for females; AST ≤ 30 IU/L). With respect to ALT
[AST]) at the end of the main study. The OLE study          or AST, eligible patients had to have:
assessed the impact of 80 and 100 mg daily doses of
                                                            • Worsening ALT or AST ≥ 30% from baseline, and
resmetirom on safety and noninvasive assessments of
                                                              >upper limit of normal (ULN)
NASH. Additionally, in both the main and OLE stud-
                                                            • Improvement in ALT or AST, but levels remained
ies, the impact of resmetirom treatment was assessed
                                                              elevated ≥1.5-2-fold ULN
on a biomarker of net fibrosis formation (N-terminal
                                                            • ALT or AST ≥ 2-fold ULN (whether improved or
type III collagen propeptide [PRO-C3]/metallopro-
                                                              worsened)
teinase-degraded collagen III [C3M]) and a measure
of hepatic inflammation (free T3/reverse T3).                  Thirty-one of a total 38 eligible patients (14 of 19
                                                            placebo and 17 of 19 resmetirom-treated) from 12 sites
                                                            from the main study signed an informed consent to
Participants and Methods                                    participate in the OLE study (Fig. 1) and were enrolled
                                                            from December 14, 2017, to May 8, 2018; all received
PATIENTS AND CLINICAL TRIAL                                 active treatment in the OLE study (Fig. 1A). The OLE
                                                            study enrollment occurred at week 38 of the main study,
DESIGN AND OVERSIGHT
                                                            after the 2-week follow-up off the study drug, up to
   The design, eligibility, and oversight of the main       2 months after completion of the main study (Fig. 1B).
36-week study have been described.(19) The proto-           Treatment and dose were blinded at the time of entry
col was designed by Madrigal (R.T.), S.A.H., M.B.,          into the OLE study, and an unblinded reviewer assigned
and Medpace (KM). All study data were available to          dose until the main study was completed and had been
Madrigal, Medpace (K.M.), and S.A.H. The statistical        unblinded. After unblinding of the main study and re-
analyses were performed by K.M., and the MRI-PDFF           viewing the data, all patients in the OLE study had a
analyses were performed by M.B. Briefly, NCT02912260        dose increase to at least 80 mg, the last increase in dose
was a 36-week multicenter, randomized, double-blind,        occurring at OLE week 24 (Fig. 1B).
placebo-controlled study in adults with biopsy-                Written, informed consent was obtained from all
confirmed NASH (fibrosis stages 1-3) and hepatic fat        patients before enrollment in the main study, and a
fraction of at least 10% at baseline when assessed by       second informed consent was obtained for participa-
MRI-PDFF. Patients were randomized 2:1 to receive           tion in the OLE study. The studies were performed in
resmetirom or matching placebo, orally once a day. Serial   accordance with ethical principles of the Declaration
hepatic fat measurements were obtained at weeks 12          of Helsinki and were consistent with the International
and 36, and a second liver biopsy was obtained at week      Conference on Harmonization/Good Clinical Practice
36. The primary efficacy endpoint, relative reduction in    and applicable regulatory requirements. The institu-
liver fat as determined on MRI-PDFF, and key second-        tional review board or independent ethics commit-
ary liver biopsy endpoints were met.(19) During the main    tee of each study center approved the study and all
36-week study, a protocol amendment was completed to        amendments.

                                                                                                                    3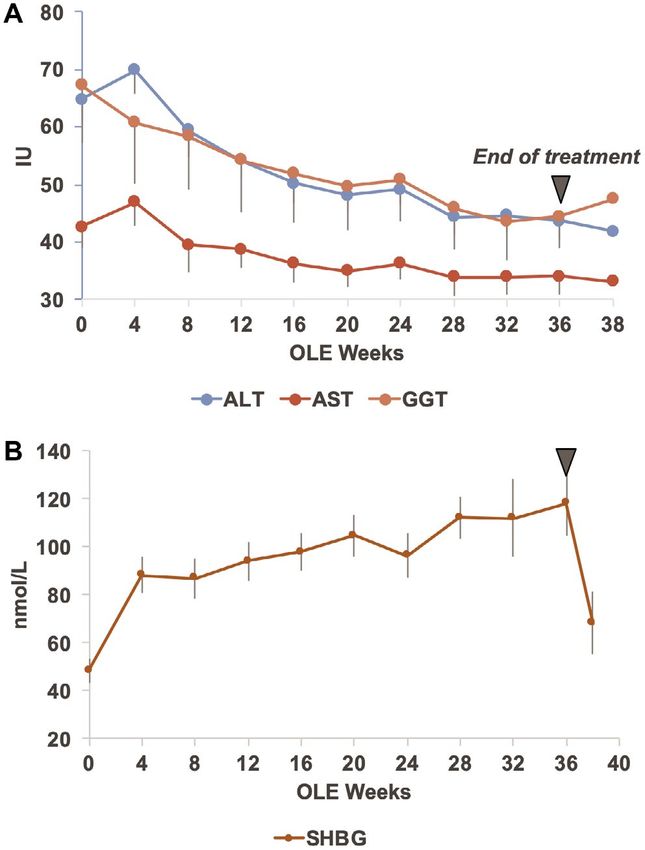
HARRISON ET AL.                                                       Hepatology Communications, Month 2021

FIG. 1. Disposition (A) of and treatment schematic (B) of patients in the MGL-3196-05 main and OLE studies. Abbreviations: BL,
baseline; DC, discontinued.

ASSESSMENTS                                                     assessment at week 2, patients remained on the initial
                                                                dose or were down-titrated or up-titrated by 20 mg at
   Study populations: All OLE study patients had                week 4, as determined by an unblinded reviewer. After
completed the 36-week main study, including week 36             the main study was unblinded, all patients in the OLE
liver biopsy and weeks 12 and 36 MRI-PDFF. Two                  study had doses increased to at least 80 mg or 100 mg
major groups were included in the OLE study: former             of resmetirom (the patients most advanced in the OLE
resmetirom patients, many of whom were treated with             study had the dose increase no later than week 24).
a higher dose of resmetirom during the OLE (Res/                   Procedures: The 36-week OLE study followed the
Res), and former placebo patients who were treated              design of the 36-week main study(19) with a major
with resmetirom during the OLE study (Pbo/Res).                 exception that no additional liver biopsy was obtained
   Dose determination: Res/Res patients entering the            after week 36 of the OLE study. In addition, most
OLE study initially continued on the dose of resme-             OLE patients had liver stiffness measurement by
tirom that they were on at the end of the main study.           vibration-controlled transient elastography (VCTE) to
Pbo/Res patients were started on an 80-mg dose of               assess liver fibrosis, and controlled-attenuation param-
resmetirom on day 1 of the OLE study. Based on                  eter (CAP) score to assess liver steatosis (FibroScan;
a trough and 4-hour post-dose pharmacokinetic                   Echosens, Paris, France), determined at OLE day 1

4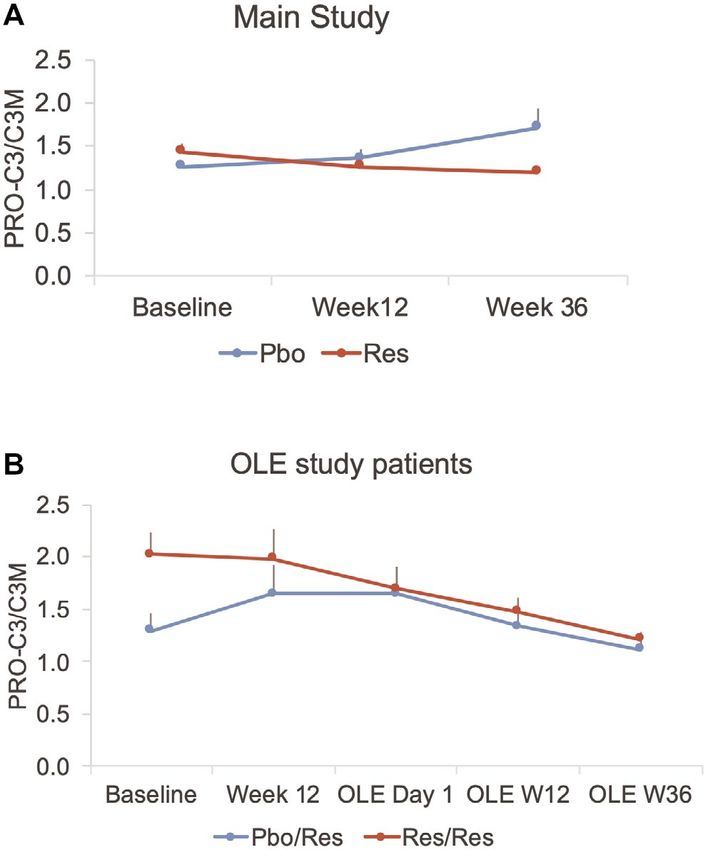
Hepatology Communications, Vol. 0, No. 0, 2021                                              HARRISON ET AL.

and OLE week 36. The main study week 36 PDFF             the absence of a placebo control group, within-group
was the baseline PDFF for the OLE study. NASH            analyses (t test) and paired group analyses (t test or
biomarkers and PDFF measurements were made at            least-squared mean) were conducted where appropri-
weeks 12 and 36 of the OLE study, and safety and         ate. For group analyses, the ANCOVA model included
lipid laboratory determinations were made at monthly     the specified group as a factor and baseline level as
visits throughout the study.                             a covariate. The presentation of results included the
                                                         estimated means overall and by group, their standard
STATISTICAL METHODS                                      errors, and P values.

Outcomes
   All OLE study endpoints were exploratory. For         Results
most parameters, baseline was defined as the time
of initial treatment with resmetirom, the main study     PATIENT CHARACTERISTICS
baseline for Res/Res and the OLE study baseline for         The baseline characteristics of patients enrolled in
Pbo/Res. The main efficacy outcomes included rela-       the OLE study are found in Table 1. The mean age
tive and absolute change in MRI-PDFF at OLE week         was 48.2 (12.3) years, 51.6% were male, and 87.1%
36. Other key outcomes included safety assessments       were White, with a mean body mass index of 35.3
and change from baseline in liver enzymes (ALT,          (5.2) kg/m2. Diabetes was present in 45.2%, and
AST, and gamma-glutamyl transpeptidase [GGT]),           hypertension was present in 51.6%. All patients met
PRO-C3 as a biomarker of liver fibrosis (Nordic          the liver enzyme entry criteria for the OLE study,
Bioscience, Herlev, Denmark), C3M as biomarker of        including several patients in the Res/Res population
fibrosis regression,(20) LDL-C and other lipids, and     who had demonstrated improvement at the end of the
FibroScan TE and CAP.                                    main study compared with baseline.
                                                            The NASH activity score (NAS) improved at
Statistical Analyses                                     week 36 of the main study compared with baseline
                                                         biopsy in Res/Res patients, in whom 53% of biop-
   In the statistical analysis plan, the prespecified    sies showed a 2-point reduction of NAS at week 36,
main analyses population included week 36 com-           and 17.6% of biopsies showed a reduction in fibro-
pleters (Pbo/Res, n = 13; Res/Res, n = 16), and          sis as compared with 14.3% and 0% in Pbo/Res,
the safety population included all 31 patients who       respectively.
enrolled in the OLE study and received at least one
dose. Twenty nine of the 31 patients completed all
36 weeks of the OLE study; 2 discontinuations were
                                                         MRI-PDFF OUTCOMES
patient decision. The primary week 36 MRI-PDFF              In the Res/Res population, the average reduc-
analysis population included Pbo/Res patients            tion in PDFF during the main study at week 36
(n = 12) plus Res/Res patients with a dose increase      was 27.9%, and 31.6% at OLE study week 12,
in the OLE study (n = 11) receiving a dose of 80 mg      and did not change significantly from week 36 of
or greater at week 36, and excluding patients with       the main study. At OLE week 12, 10/16 Res/Res
a weight loss or weight gain ≥9.5%. Completers by        patients were on the same dose of resmetirom as in
dose included patients on 80 mg (n = 21), 1 Pbo/Res      the main study; seven additional dose increases were
patient on 60 mg (protocol deviation), and patients      made after week 12, and one additional increase to
on ≥100 mg (n = 7).                                      100 mg after the initial increase to 80 mg at week
   Endpoints were summarized using descriptive sta-      4. At OLE week 36, Pbo/Res patients and Res/Res
tistics by key groups listed previously and continuous   patients with a dose increase during the OLE study
endpoints were analyzed using analysis of covariance     (primary efficacy population) experienced a mean
(ANCOVA) or a paired t test to describe relative         relative reduction of 52.3% (standard error = 4.4%,
and/or absolute change from baseline to various time     P < 0.0001) (Table 2 and Figure 2) and abso-
points including weeks 12, 32, and 36. Because of        lute reduction of 11.1% (1.5%) in PDFF. Patients

                                                                                                              5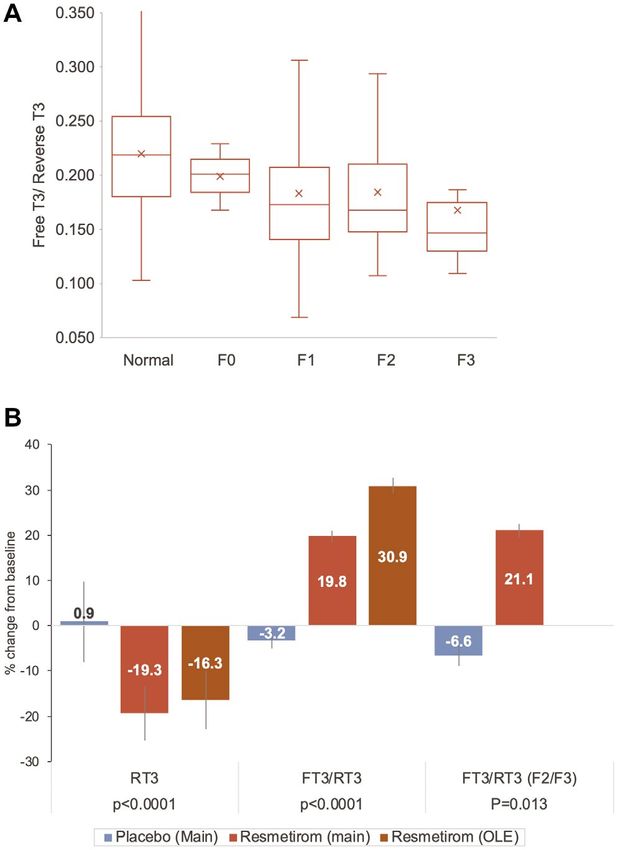
HARRISON ET AL.                                                          Hepatology Communications, Month 2021

                                               TABLE 1. BASELINE CHARACTERISTICS
                                                      Pbo/Res (n = 14)                   Res/Res (n = 17)            All (n = 31)

Age, years (SD)                                          42.4 (10.5)                        53.1 (11.8)               48.2 (12.3)
Male, n (%)                                               8 (57.1)                           8 (47.1)                  16 (51.6)
Race, White, n (%)                                       14 (100.0)                          13 (76.5)                 27 (87.1)
    Black                                                   0 (0)                             1 (5.9 )                  1 (3.2)
    Asian                                                   0 (0)                            2 (11.8)                   2 (6.4)
    Other                                                   0 (0)                             1 (5.9)                   1 (3.2)
Hispanic, n (%)                                           9 (64.3)                           7 (41.2)                  16 (51.6)
BMI, mean (SD)                                           35.1 (5.2)                         34.5 (5.2)                35.3 (5.2)
T2D, n (%)                                                5 (35.7)                           9 (52.9)                  14 (45.2)
Hypertension, n (%)                                       6 (42.9)                           10 (58.8)                 16 (51.6)
NAS, main BL mean (SD)                                    4.7 (0.9)                          4.9 (1.1)                 4.8 (1.0)
NAS, main week 36 mean (SD)                               4.2 (1.5)                          3.9 (1.4)                 4.1 (1.4)
NAS, 2-point decrease, n (%)                              2 (14.3)                           9 (52.9)                  11 (35.5)
Fibrosis stage, main BL mean (SD)                         1.6 (1.0)                          1.8 (1.0)                 1.7 (1.0)
Fibrosis stage, main week 36 mean (SD)                    1.8 (1.0)                          2.0 (0.8)                 1.8 (1.0)
F0 at week 36, n (%)                                         0                               3 (17.6)                   3 (9.7)
F2-F3 at week 36, n (%)                                   7 (50.0)                           13 (76.5)                 20 (64.6)
MRI-PDFF main BL mean% (SD%)                             17.4 (7.6)                         21.0 (6.4)                19.4 (7.1)
MRI-PDFF main week 36 mean% (SD%)                        18.0 (7.0)                         14.2 (6.1)                15.9 (6.7)
    %CFB, main (BL to week 36)                           12.2 (46.6)                       −27.9 (37.0)               −9.8 (45.6)
ALT (IU/L), main BL                                      58.9 (27.4)                        68.3 (40.9)               64.1 (35.2)
ALT (IU/L), OLE BL                                       70.6 (51.7)                        58.5 (35.6)               64.0 (43.2)
AST (IU/L), main BL                                      36.0 (19.7)                        46.6 (19.5)               41.8 (20.0)
AST (IU/L), OLE BL                                       40.9 (24.8)                        43.8 16.4)                42.5 (20.3)
GGT (IU/L), main BL                                      70.3 (61.5)                        62.6 (33.1)               66.1 (47.3)
GGT (IU/L), OLE BL                                       76.6 (75.1)                        57.6 (30.8)               66.2 (55.2)
Total bilirubin (mg/dL), OLE BL                         0.506 (0.17)                       0.574 (0.20)              0.543 (0.19)
Direct bilirubin (mg/dL), OLE BL                        0.089 (0.035)                      0.106 (0.043)             0.099 (0.040)
Alkaline phosphatase (IU/L), OLE BL                      83.4 (30.1)                        78.0 (20.3)               79.6 (27.4)
PRO-C3 ng/mL, main BL mean (SD)                          15.3 (8.7)                         23.2 (10.8)               19.6 (10.5)
PRO-C3 ng/mL, OLE BL mean (SD)                           19.6 (13.6)                        18.4 (6.3)                19.0 (10.1)
C3M ng/mL, main BL, mean (SD)                            11.8 (2.9)                         10.9 (1.9)                11.3 (2.4)
C3M ng/mL, OLE BL, mean (SD)                             12.2 (3.0)                         11.5 (2.3)                11.8 (2.6)
PRO-C3/C3M, main BL                                      1.30 (0.63)                        2.10 (0.89)               1.74 (0.87)
PRO-C3/C3M, OLE BL                                       1.70 (1.00)                        1.70 (0.80)               1.67 (0.89)
FibroScan VCTE (kPa) OLE BL, mean (SD)                    8.3 (2.6)                         11.9 (5.0)                10.3 (4.4)
FibroScan CAP, OLE BL, mean (SD)                        325.5 (77.5)                       317.8 (71.0)              320.8 (72.5)
Direct LDL (mg/dL) OLE BL, mean (SD)                     121 (35.1)                        125.7 (42.9)              123.7 (39.1)
TGs (mg/dL) OLE BL, mean (SD)                           176.1 (110.1)                      178.4 (72.0)              177.4 (88.8)
HDL (mg/dL) OLE BL, mean (SD)                            43.5 (11.2)                        46.8 (14.2)               45.1 (12.6)
ApoB (mg/dL) OLE BL, mean (SD)                            110 (29)                           112 (30)                110.9 (29.5)
ApoCIII (mg/dL), main BL, mean (SD)                      10.3 (3.3)                         11.2 (3.8)                10.8 (3.6)
ApoCIII (mg/dL), OLE BL, mean (SD)                       10.4 (5.3)                         10.6 (3.2)                10.5 (4.1)
Common concomitant meds
    NSAIDs                                                4 (28.6)                            8 (47)                    12 (39)
    Biguanides (metformin)                                4 (28.6)                           7 (41.2)                  11 (35.5)
    Proton pump inhibitors                                4 (28.6)                           7 (41.2)                  11 (35.5)
    Statins                                               3 (21.4)                           6 (35.3)                  9 (29.0)
    Angiotensin-converting enzyme inhibitors              4 (28.6)                           4 (23.5)                  8 (25.8)

Note: Data are presented as n (%) or mean (SD). For FibroScan, n = 11; Pbo/Res and Res/Res, n = 14.
Abbreviations: BL, baseline; BMI, body mass index; %CFB, percent change from baseline; HDL, high density lipoprotein; NSAID, non-
steroidal anti-inflammatory drug; TGs, triglycerides; T2D, type 2 diabetes.

6
Hepatology Communications, Vol. 0, No. 0, 2021 HARRISON ET AL.
TABLE 2. CHANGE IN MRI-PDFF
n Pbo/Res P Value n Res/Res P Value n All P Value
Week 12 %CFB 13 −39.9 (4.2)HARRISON ET AL. Hepatology Communications, Month 2021 FIG. 2. MRI-PDFF results in the OLE study relative median (−54.6 [−35.6, −65.8]) (A) and absolute mean fat reduction (B) (Table 2) as determined by MRI-PDFF at week 36 in the primary population (Pbo/Res and Res/Res patients with a dose increase during the OLE study) and by final dose. Time course of PDFF in the Pbo/Res (blue line) and primary Res/Res (red line) population compared with change in PRO-C3. and PRO-C3/C3M showed a significant decrease which is predictive of liver fibrosis stage,(21,23) decreased with resmetirom treatment (P = 0.0044) (Supporting with resmetirom treatment (−2.1 [0.8] kPa, P = 0.015). Table S2 and Fig. 4). In Res/Res and Pbo/Res patients, another potential In the OLE study, similar to the main study, PRO- marker of inflammation/fibrosis, corrected T1 (CT1) C3 was reduced significantly with resmetirom treat- measured on MRI, showed normalization with time ment (P = 0.0005), with greatest reduction at OLE on resmetirom treatment (Fig. 5). week 36, coincident with decrease in PDFF (Fig. 2B and Table 4). The magnitude of reduction in PRO-C3 THYROID PARAMETERS was greater with higher baseline PRO-C3. Similarly, in the OLE, C3M increased and PRO-C3/C3M Thyroid axis hormones may be altered in NASH, decreased significantly with treatment (P < 0.0001 for which is associated with subclinical and clinical hypo- each measurement) (Fig. 4 and Table 4). thyroidism.(15,16) In a post hoc analysis, evidence for In the OLE, other potential fibrosis markers such as intrahepatic hypothyroidism at baseline was assessed in adiponectin, which has been proposed as inversely cor- randomized main and OLE study patients. Compared related with fibrosis in the liver,(22) increased signifi- with a data set of non-NASH patients of similar age, cantly (Table 4). Liver stiffness (VCTE) on FibroScan, there were no differences in baseline free T4 (FT4) or 8
Hepatology Communications, Vol. 0, No. 0, 2021                                                                 HARRISON ET AL.

                                  TABLE 3. EFFECTS ON LIPIDS AND LIPOPROTEINS
Lipids and Lipoproteins                         n                  CFB                  P Value               %CFB            P Value

LDL-C (mg/dL)
  Week 12                                       29              −31.6 (5.2)
HARRISON ET AL. Hepatology Communications, Month 2021
TABLE 4. LIVER ENZYMES AND BIOMARKERS AT OLE WEEK 12 AND 36
n Pbo/Res P Value n Res/Res P-Value n All P Value
Liver enzymes
ALT (IU/L)
Week 12, CFB 14 −16.8 (4.7) 0.0014 16 −14.4 (4.4) 0.0029 30 −15.5 (4.8) 0.0028
Week 36, CFB 13 −31.7 (4.6)Hepatology Communications, Vol. 0, No. 0, 2021 HARRISON ET AL.
TABLE 4. Continued
n Pbo/Res P Value n Res/Res P-Value n All P Value
FibroScan VCTE (kPa)
Week 36, CFB 11 −2.0 (0.66) 0.0064 14 −2.2 (0.58) 0.0012 25 −2.1 (0.8) 0.015
80 mg 19 −1.8 (0.45) 0.0007
100 mg 5 −3.4 (0.88) 0.0008
FibroScan CAP
BL 11 325.5 (77.5) 13 316.8 (71.0) 24 320.8 (72.5)
Week 36, CFB 11 −14.5 (12.4) 0.26 13 −10.7 (11.4) 0.36 24 −12.4 (11.3) 0.29
80 mg 19 −8.3 (9.3) 0.39
100 mg 4 −33.2 (20.3) 0.12
Adiponectin (mg/L)
BL 14 3.9 (1.4) 16 4.5 (2.2) 4.25 (1.9)
Week 12, CFB 14 0.84 (0.30) 0.79 16 −0.039 (0.29) 30 0.018 (0.22) 0.93
Week 36, CFB 13 1.3 (0.30) 0.0002 16 0.95 (0.27) 0.0017 29 1.1 (0.20)HARRISON ET AL. Hepatology Communications, Month 2021
FIG. 4. Time course of PRO-C3/C3M in the main (A) and OLE
(B) studies. Both the main and OLE times are shown in (B). Res/
Res patients were on resmetirom for both the main and OLE 36-
FIG. 3. Time course in OLE study patients of liver enzymes ALT,
week studies, and Pbo/Res were on placebo during the main study
AST, and GGT (A) and SHBG (B). The baseline (week 0) is the
and started on resmetirom on OLE day 1 for 36 weeks.
OLE baseline for both Res/Res and Pbo/Res patients.
demonstrated NASH and fibrosis reduction on liver
placebo or resmetirom treatment in the main 36-week biopsy, PDFF, and biomarkers at week 36 of the main
study based on residual minimally to markedly elevated study (Table 1). Thus, liver enzyme response did not
liver enzymes (ALT and/or AST) at the end of the always predict biopsy or MRI-PDFF response.
main study. The study examined whether an increase In the main study, about half of the patients on
in resmetirom dose and/or 72 weeks of treatment resmetirom received 60 mg, which was shown to be a
in Res/Res patients or 36 weeks of treatment with less effective dose than 80 mg or 100 mg in reducing
≥80 mg resmetirom in Pbo/Res patients could lead to PDFF or achieving NASH resolution.(19) The OLE
improvement in noninvasive measures of NASH and study provided an opportunity to determine whether
fibrosis. At the time the patients entered the OLE increasing the dose of resmetirom from 60 mg to at
study, their treatment code and treatment response on least 80 mg in Res/Res patients and/or switching to
liver biopsy, MRI-PDFF, lipids, and other pharmaco- resmetirom treatment in patients who were on placebo
dynamic biomarkers (e.g., SHBG, FT4) were blinded in the main study would improve the biomarker and
to the study team. Eligible patients included an equal PDFF responses. Predefined treatment groups (e.g.,
number from the placebo and resmetirom treatment Pbo/Res vs. Res/Res; Res/Res with a dose increase
groups, and because the study was randomized 2:1 vs. Res/Res no dose increase; 80 mg vs. 100 mg dose
resmetirom, placebo, indicated a higher percentage of group) were assessed.
placebo patients qualified for the OLE (55.9%, pla- Effect on noninvasive efficacy endpoints that had
cebo; 25.7% resmetirom). Some patients in the OLE been observed during the main study were confirmed
study, particularly in the resmetirom treatment group, during the OLE study. These included a MRI-PDFF
12Hepatology Communications, Vol. 0, No. 0, 2021 HARRISON ET AL.
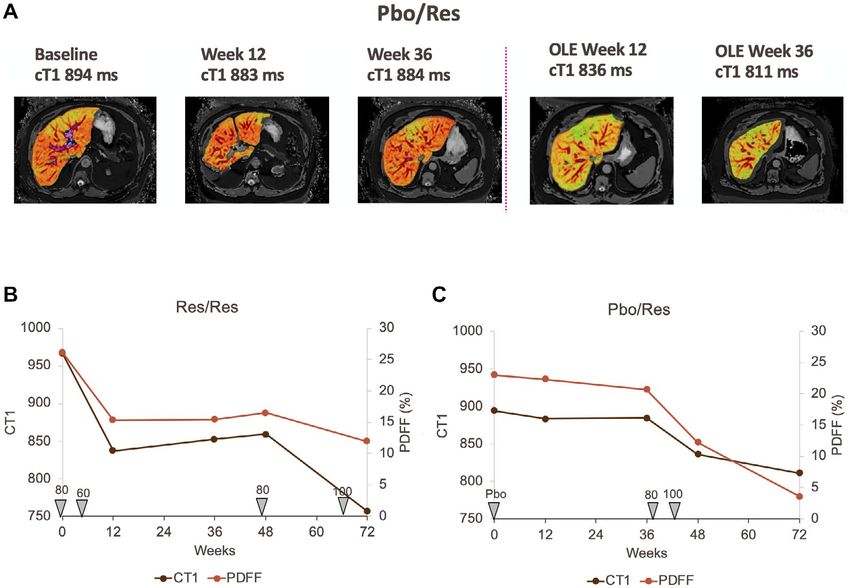
FIG. 5. Time course of CT1 and PDFF and dose in individual Pbo/Res and Res/Res patients. (A) CT1 images at indicated assessment
times of a Pbo/Res patient. (B,C) The Res/Res and Pbo/Res patient, respectively, time course of CT1, PDFF, and dose administered over
time from the start of the main study to the end of the OLE.
reduction of >50% relative fat reduction compared with from an 80 mg dose appeared to improve the PDFF
baseline, and a high percentage of patients achieving and CT1 responses in 2 patients (Table 2, Figs. 2A
>30% fat reduction on MRI-PDFF, which was shown and 5). However, given the small number of patients
to be associated with increased NASH reduction and treated with 100 mg compared with 80 mg, no statis-
resolution in the main study.(19,24) Atherogenic lipid tical comparison was possible between the two doses.
and lipoprotein lowering of >20 to >25% were observed Notably, there were no safety findings associated with
for LDL-C, ApoB, triglycerides, and ApoCIII. higher doses of resmetirom used in the OLE, as com-
The change in PDFF was −26.8% (11.4) and pared with the main study.
−52.6% (5.2) at the end of the main and OLE studies, Type III collagen is a key component of liver
respectively, in Res/Res patients with a dose increase fibrosis in patients with NASH, and identifying
during the OLE study, who also showed an improve- reliable noninvasive measures of fibrosis progression
ment in lipid lowering, liver enzymes, and other bio- or regression will be critical in the long-term treat-
markers relative to patients who did not receive a ment of NASH. PRO-C3 and C3M, serum markers
dose increase. There was little change in the PDFF reflecting type III collagen formation and degrada-
or other biomarkers in placebo patients during the tion, respectively, were assessed to determine the net
main study, and a convincing improvement in sev- effect on collagen. The observed reduction in PRO-
eral imaging and biomarker responses in the Pbo/Res C3 along with increase or no change in C3M levels as
group during the 36-week OLE study. At the end of reflected by the PRO-C3/C3M level may indicate an
the OLE study, Pbo/Res patients, who were dosed at overall decrease in fibrosis.(8) Similarly, liver stiffness
80 mg or 100 mg, showed improvement in PDFF, (VCTE) on FibroScan showed statistically significant
biomarkers, and lipid endpoints relative to the main improvement during the 36-week OLE study and,
study (Tables and Fig. 2B). An increase to 100 mg as an increasingly validated measure of liver fibrosis,
13HARRISON ET AL. Hepatology Communications, Month 2021
TABLE 5. SAFETY
Main Study OLE Study
Placebo,* n = 41 Resmetirom, n = 31
Patients with AEs, n (%) 28 (68) 18 (58)
Severe 2 (5) 0
Moderate 13 (32) 10 (32)
Mild 13 (32) 8 (26)
Patients with severe AEs 2 (5) 0
Most common AEs, n (%)
Diarrhea 4 (10) 3 (10)
Nausea 3 (7) 1 (3)
Headache 6 (15) 0
Urinary tract infection 4 (10) 1 (3)
Dizziness 4 (10) 1 (3)
Grade 3 Common terminology
criteria, n (%)
ALT > 5 × ULN 3 (7) 0
GGT > 5 × ULN 5 (12) 0
*Reported in Harrison et al.(19)
components of liver function that are defective in
NASH. Thyroid hormone acting through THR-β is
vital to maintain normal lipid regulation and mito-
chondrial function in the liver.(15) In a large National
Health and Nutrition Education Survey database and
FIG. 6. Effects of resmetirom on RT3 and FT3/RT3 in patients median follow-up of 23 years, individuals with low
with NASH. (A) Baseline FT3/RT3 in normal (non-NASH) and thyroid function demonstrated an association with
NASH according to liver biopsy fibrosis stage. Shown as a box and NAFLD.(26) Low thyroid function was associated with
whisker plot with box defined by quartile 1, 3, and median, with
quartile line shown; “x” indicates the mean, SD, and error bars. (B) a higher risk for all-cause and cardiovascular mortality
Effect of resmetirom on thyroid pathway hormones at week 36 in in individuals with NAFLD and not in those without
the main study or OLE. Compared with placebo in the main study, NAFLD. Another study reports intrahepatic hypo-
within-group comparison over time in the OLE. Abbreviation: F2/ thyroidism in human NASH livers, hypothesized as
F3, patients with baseline NASH fibrosis stage of F2 or F3.
caused by depressed conversion of prohormone T4 to
active hormone T3.(16) This conversion mediated by
deiodinase 1 and is depressed in NASH livers, while
represents an important noninvasive in-office test that the level of thyroid hormone degradative enzyme
has potential utility to monitor individual NASH deiodinase 3 made in stellate cells is increased.
patient response to treatment.(21) Decreased RT3 and an increase in the FT3/RT3 ratio
Notably, CAP, another parameter measured by by resmetirom may reflect a correction in endogenous
FibroScan, was uncorrelated with main week 36 hepatic thyroid hormone activity and improvement
PDFF or OLE week 36 PDFF; the change in CAP in hepatic function through increased direct THR-β
did not show a relationship to the change in PDFF. activity. The improvements in atherogenic lipids and
The CAP score may provide a categorical measure of lipoproteins, coupled with the improvement in hepatic
liver fat that approximately compares with the ste- thyroid function and reduction in lipotoxic fat, sup-
atosis score on liver biopsy, but unlike MRI-PDFF, port the potential for reduced atherosclerotic risk in
does not represent a precise measure of liver fat.(25) patients with NASH treated with resmetirom.
Mechanistically, as a targeted hepatic therapeu- The OLE had significant limitations. Although
tic acting through THR-β, resmetirom may restore the completion rate in the OLE study was high, the
14Hepatology Communications, Vol. 0, No. 0, 2021 HARRISON ET AL.
sample size was relatively small. Differences between
7) Piazzolla VA, Mangia A. Noninvasive diagnosis of NAFLD and
doses could not be adequately explored because of the NASH. Cells 2020;9:1005.
relatively small numbers of patients on a 100-mg dose. 8) Boyle M, Tiniakos D, Schattenberg JM, Ratziu V, Bugianessi
E, Petta S, et al. Performance of the PRO-C3 collagen neo-epi-
Nonetheless, the 36-week OLE study and additional
tope biomarker in non-alcoholic fatty liver disease. JHEP Rep
post hoc assessments from the main study (PRO-C3/ 2019;1:188-198.
C3M, FT3/RT3) demonstrated that resmetirom has 9) Konerman MA, Jones JC, Harrison SA. Pharmacotherapy for
NASH: current and emerging. J Hepatol 2018;68:362-375.
a positive impact on several noninvasive markers of 10) Younossi Z, Anstee QM, Marietti M, Hardy T, Henry L, Eslam
liver fat, inflammation, and fibrosis. Furthermore, M, et al. Global burden of NAFLD and NASH: trends, predic-
these noninvasive biomarkers may be useful to moni- tions, risk factors and prevention. Nat Rev Gastroenterol Hepatol
2018;15:11-20.
tor response to treatment over time. Taken as a whole, 11) Younossi ZM, Ratziu V, Loomba R, Rinella M, Anstee
this study demonstrates that a series of noninvasive QM, Goodman Z, et al. Obeticholic acid for the treatment of
biomarkers, including imaging, may be useful in mon- non-alcoholic steatohepatitis: interim analysis from a multi-
centre, randomised, placebo-controlled phase 3 trial. Lancet
itoring response to resmetirom in individual patients 2019;394:2184-2196.
with NASH. 12) Harrison SA, Wong VW, Okanoue T, Bzowej N, Vuppalanchi R,
Based in part on the safety and efficacy of the OLE Younes Z, et al. Selonsertib for patients with bridging fibrosis or
compensated cirrhosis due to NASH: results from randomized
study, a resmetirom phase 3 clinical trial MAESTRO- phase III STELLAR trials. J Hepatol 2020;73:26-39.
NASH (NCT03900429) was initiated in patients with 13) Harrison SA, Alkhouri N, Davison BA, Sanyal A, Edwards C,
NASH and stage F2 or F3 fibrosis, to test whether Colca JR, et al. Insulin sensitizer MSDC-0602K in non-alcoholic
steatohepatitis: a randomized, double-blind, placebo-controlled
resmetirom at daily doses of 80 mg and 100 mg com- phase IIb study. J Hepatol 2020;72:613-626.
pared with placebo will resolve NASH, reduce liver 14) Harrison SA, Goodman Z, Jabbar A, Vemulapalli R, Younes
fibrosis, and reduce LDL-C after 52 weeks of treat- ZH, Freilich B, et al. A randomized, placebo-controlled trial of
emricasan in patients with NASH and F1–F3 fibrosis. J Hepatol
ment. MAESTRO-NAFLD-1 (NCT04197479), a 2020;72:816-827.
52-week phase 3 “real-life NASH study” that enrolls 15) Sinha RA, Bruinstroop E, Singh BK, Yen PM. Nonalcoholic fatty
liver disease and hypercholesterolemia: roles of thyroid hormones,
patients based on NASH diagnosed using noninvasive
metabolites, and agonists. Thyroid 2019;29:1173-1191.
assessments is also being conducted to assess safety 16) Bohinc BN, Michelotti G, Xie G, Pang H, Suzuki A, Guy CD,
and the effects of 80 mg and 100 mg of resmetirom on et al. Repair-related activation of hedgehog signaling in stro-
mal cells promotes intrahepatic hypothyroidism. Endocrinology
serial biomarkers, lipids, MRI-PDFF, and FibroScan. 2014;155:4591-4601.
17) Kelly MJ, Pietranico-Cole S, Larigan JD, Haynes NE, Reynolds
Acknowledgments: We thank the investigators, trial par- CH, Scott N, et al. Discovery of 2-[3,5-dichloro-4-(5-iso-
ticipants, and their families. propyl-6-oxo-1,6-dihydropyridazin-3-yloxy)phenyl]-3,5-dio
xo-2,3,4,5-tetrahydro[1,2,4]triazine-6-carbonitrile (MGL-3196),
a highly selective thyroid hormone receptor beta agonist in clini-
REFERENCES cal trials for the treatment of dyslipidemia. J Med Chem 2014;57:
3912-3923.
1) Chalasani N, Younossi Z, Lavine JE, Charlton M, Cusi K, Rinella 18) Taub R, Chiang E, Chabot-Blanchet M, Kelly MJ, Reeves RA,
M, et al. The diagnosis and management of nonalcoholic fatty Guertin MC, et al. Lipid lowering in healthy volunteers treated
liver disease: practice guidance from the American Association for with multiple doses of MGL-3196, a liver-targeted thyroid hor-
the Study of Liver Diseases. Hepatology 2018;67:328-357. mone receptor-beta agonist. Atherosclerosis 2013;230:373-380.
2) Diehl AM, Day C. Cause, pathogenesis, and treatment of nonal- 19) Harrison SA, Bashir MR, Guy CD, Zhou R, Moylan CA, Frias
coholic steatohepatitis. N Engl J Med 2017;377:2063-2072. JP, et al. Resmetirom (MGL-3196) for the treatment of non-
3) Stahl EP, Dhindsa DS, Lee SK, Sandesara PB, Chalasani alcoholic steatohepatitis: a multicentre, randomised, double-blind,
NP, Sperling LS. Nonalcoholic fatty liver disease and the placebo-controlled, phase 2 trial. Lancet 2019;394:2012-2024.
heart: JACC state-of-the-art review. J Am Coll Cardiol 20) Barascuk N, Veidal SS, Larsen L, Larsen DV, Larsen MR, Wang
2019;73:948-963. J, et al. A novel assay for extracellular matrix remodeling associ-
4) Henson JB, Simon TG, Kaplan A, Osganian S, Masia R, Corey ated with liver fibrosis: an enzyme-linked immunosorbent assay
KE. Advanced fibrosis is associated with incident cardiovascular (ELISA) for a MMP-9 proteolytically revealed neo-epitope of
disease in patients with non-alcoholic fatty liver disease. Aliment type III collagen. Clin Biochem 2010;43:899-904.
Pharmacol Ther 2020;51:728-736. 21) Eddowes PJ, Sasso M, Allison M, Tsochatzis E, Anstee QM,
5) Angulo P, Kleiner DE, Dam-Larsen S, Adams LA, Bjornsson Sheridan D, et al. Accuracy of fibroscan controlled attenuation
ES, Charatcharoenwitthaya P, et al. Liver fibrosis, but no other parameter and liver stiffness measurement in assessing steato-
histologic features, is associated with long-term outcomes of pa- sis and fibrosis in patients with nonalcoholic fatty liver disease.
tients with nonalcoholic fatty liver disease. Gastroenterology Gastroenterology 2019;156:1717-1730.
2015;149:389-397.e310. 22) Park PH, Sanz-Garcia C, Nagy LE. Adiponectin as an anti-
6) Dulai PS, Singh S, Patel J, Soni M, Prokop LJ, Younossi Z, et al. fibrotic and anti-inflammatory adipokine in the liver. Curr
Increased risk of mortality by fibrosis stage in nonalcoholic fatty Pathobiol Rep 2015;3:243-252.
liver disease: systematic review and meta-analysis. Hepatology 23) Hashemi SA, Alavian SM, Gholami-Fesharaki M. Assessment
2017;65:1557-1565. of transient elastography (FibroScan) for diagnosis of
15HARRISON ET AL. Hepatology Communications, Month 2021
fibrosis in non-alcoholic fatty liver disease: a systematic review and and cardiovascular mortality. Am J Gastroenterol 2020;115:
meta-analysis. Caspian J Intern Med 2016;7:242-252. 1496-1504.
24) Patel J, Bettencourt R, Cui J, Salotti J, Hooker J, Bhatt A, et al.
Association of noninvasive quantitative decline in liver fat content
on MRI with histologic response in nonalcoholic steatohepatitis. Author names in bold designate shared co-first
Therap Adv Gastroenterol 2016;9:692-701. authorship.
25) Caussy C, Reeder SB, Sirlin CB, Loomba R. Noninvasive, quan-
titative assessment of liver fat by MRI-PDFF as an endpoint in
NASH trials. Hepatology 2018;68:763-772.
26) Kim D, Vazquez-Montesino LM, Escober JA, Fernandes CT, Supporting Information
Cholankeril G, Loomba R, et al. Low thyroid function in nonal-
coholic fatty liver disease is an independent predictor of all-cause Additional Supporting Information may be found at
onlinelibrary.wiley.com/doi/10.1002/hep4.1657/suppinfo.
16You can also read