Impact of succussion on pharmaceutical preparations analyzed by means of patterns from evaporated droplets - Nature
←
→
Page content transcription
If your browser does not render page correctly, please read the page content below
www.nature.com/scientificreports

            OPEN           Impact of succussion on
                           pharmaceutical preparations
                           analyzed by means of patterns
                           from evaporated droplets
                           Maria Olga Kokornaczyk1*, Sandra Würtenberger2 & Stephan Baumgartner1,3,4

                           The aim of the present study was to investigate if patterns obtained from evaporating droplets of
                           pharmaceutical preparations reveal the impact of succussion on such medicinal products. For this
                           purpose, five pharmaceutical preparations (Echinacea 10−2, Baptisia 10−3, Baptisia 10−4, Luffa 10−4, and
                           Spongia 10−6) were prepared according to the European Pharmacopoeia guidelines for the production of
                           homeopathic remedies, in three variants each: with varying numbers of succussion strokes (i) 100, (ii) 10
                           (succussed samples), and (iii) zero (gently mixed, unsuccussed sample). System stability was studied by
                           means of systematic positive control experiments. Patterns were evaluated by means of computerized
                           image analysis regarding grey level distribution, texture, and fractality. For all investigated
                           pharmaceutical preparations, significant differences were found between the succussed and gently
                           mixed samples; whereas, all three samples (prepared with 100, 10 and zero succussion strokes) could be
                           significantly differentiated for Luffa 10−4 and Spongia 10−6 for one image evaluation parameter each.
                           Control experiments showed a reasonable stability of the experimental set-up.

                           It is known that shaking a solution may have impact on proteins it contains1,2; the introduction of air bubbles into
                           the solution3, as also the action of sharing forces, may trigger oxidation processes and aggregation of these mol-
                           ecules1,4–6. Solely, an accidental dropping of a vial has been reported to modify some proteins in suspension2. In
                           pharmaceutical preparations, in some cases shaking and the thereby induced aggregation of proteins may influ-
                           ence their properties; therefore, the development of measures mitigating the shaking influence, like for instance
                           development of new coatings for pre-filled syringes, is important and is addressed in recent investigations6.
                                The impact of agitation upon liquid pharmaceutical products has been investigated by means of various
                           analytical approaches, including methods analyzing the particle formation (micro-flow imaging, dynamic light
                           scattering, light obscuration method), protein degradation (size exclusion chromatography, tryptic digestion/
                           HPLC), formation of free radicals (hydroxyphenyl fluorescein assay), and flow dynamics occurring during agi-
                           tation (high speed imaging). Furthermore, different spectroscopy methods (fluorescence spectroscopy, Fourier
                           transform infrared spectroscopy) and calorimetric methods (differential scanning calorimetry) have been applied
                           for accessing the characteristics of agitated samples1–6. Here we propose for the first time to apply the droplet
                           evaporation method (DEM) to access the characteristics of agitated pharmaceutical preparations in a comparably
                           quick and integral manner.
                                Recently, methods based on droplet evaporation find application in various fields of science and technology,
                           as for instance in fabrication of novel materials, microelectronics, ink-jet printing, coating technologies, bioassay
                           manufacturing, condensation of solutes7–9, and also for analytical purposes. Among DEM’s analytical applica-
                           tions the most studied one is medical diagnosis9,10. It is based on the idea that in the case of some diseases pat-
                           terns formed in desiccated droplets of some specific corporal fluids (e.g. blood, serum, tears, sweat) would differ
                           depending on whether the fluid was taken from a diseased or healthy donor, since the disease would specifically
                           modify the composition of the fluid.

                           1
                            Society for Cancer Research, Hiscia Institute, 4144, Arlesheim, Switzerland. 2Scientific & Regulatory Affairs, Hevert-
                           Arzneimittel GmbH & Co. KG, 55569, Nussbaum, Germany. 3Institute of Integrative Medicine, University of Witten/
                           Herdecke, 58313, Herdecke, Germany. 4University of Bern, Institute of Complementary and Integrative Medicine,
                           3010, Bern, Switzerland. *email: m.kokornaczyk@vfk.ch

Scientific Reports |   (2020) 10:570 | https://doi.org/10.1038/s41598-019-57009-2                                                               1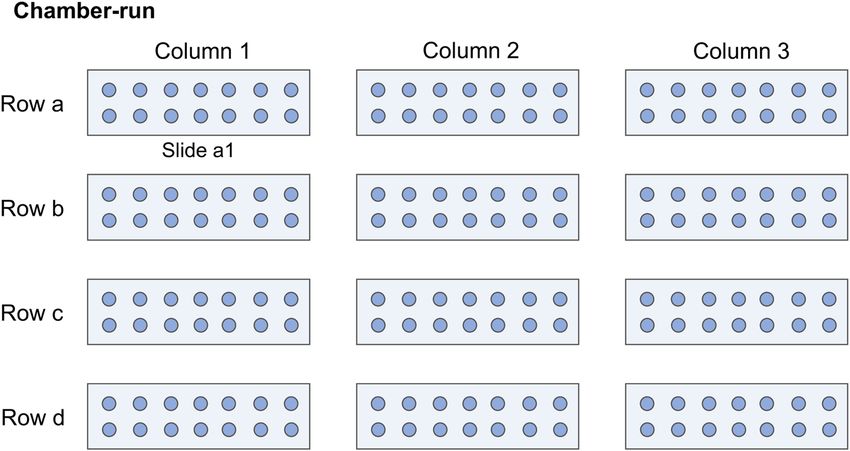
www.nature.com/scientificreports/ www.nature.com/scientificreports
In a previous study11, we have proposed DEM as a tool for a phenomenological, multi-factorial character-
ization of pharmaceutical preparations in a low dilution range (10−2-10−6). The corresponding experimental
procedure consists in the evaporation of droplets of the diluted pharmaceutical preparations under controlled
conditions, the consecutive inspection of patterns formed in droplet residues under an optical microscope with
dark-field, and computerized image evaluation. In the present study further investigations by means of the
same experimental protocol were conducted to determine, if it is possible to ‘visualize’ through the formation
of self-assembled patterns any differences between succussed and unsuccussed samples; and furthermore, if the
number of succussion strokes (NS) performed would show any impact on the patterns.
We have chosen to investigate the impact of shaking on pharmaceutical products according to the guidelines
for homeopathic preparations, since the application of succussion is a mandatory procedure according to the
European Pharmacopoeia12. The corresponding processing of pharmaceutical preparations from a given liquid
substance consists in subsequent dilution steps (in a defined dilution ratio), each followed by succussion (i.e.
introduction of some kind of motion into the liquid, mostly vigorous).
The choice of the pharmaceutical preparations was based on both their pattern forming properties (dendrite
formation was preferably chosen)11 and their presence in the product Sinusitis Hevert SL. We investigated five
different pharmaceutical preparations of vegetal (Echinacea 10−2, Baptisia 10−3, Baptisia 10−4, Luffa 10−4) and
animal (Spongia 10−6) origin, prepared in three different variants each: succussed by the application of 100 or 10
strokes (succussed samples), or without succussion (only gently mixed control sample). The agitation technique
applied was adopted from the production protocol as used by the pharmaceutical company Hevert-Arzneimittel
GmbH & Co.
A crucial point in analytical methods involving images as main experimental output is the image evaluation
and the choice of proper evaluation tools and evaluation criteria or parameters. In many studies DEM images
were analyzed exclusively by means of visual evaluation13; despite the fact that the human eye is the most precise
tool for form recognition, the visual evaluation of patterns may be subjective and it also strongly restricts the
size of the image database to be evaluated. In previous studies we introduced the computerized measurement of
several image evaluation parameters characterizing the images in terms of their grey level distribution, texture11,
and fractality14. The parameter grey level distribution measures the image brightness15, which in case of DEM
images provides information on the structures size, thickness of branches, and their brightness. The size of the
structure can be assessed in a more precise way by means of the parameter foreground pixel, which measures the
structure’s area16, however does not access the brightness. The parameter entropy is an attribute of the grey level
co-occurrence matrix measuring how often different pixel brightness values occur in an image; in particular,
entropy characterizes the heterogeneity of the brightness values distribution and describes so the image’s disor-
der17. Finally, the parameter local connected fractal dimension measures the fractal dimension of structures in a
pre-defined size range and accesses so the structures complexity16. Moreover, in the present study we added the
parameter lacunarity, a complementary measure to fractal dimension, characterizing the gaps in-between the
structure elements16 and providing so information about the structure’s density.
Results
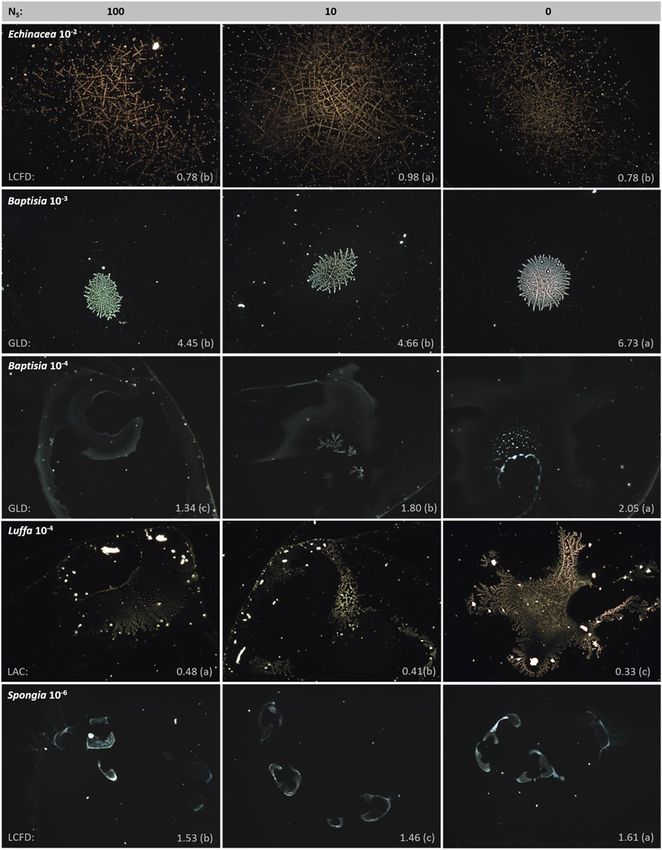
Qualitative description of the patterns. When analyzed by means of DEM, the five here investigated
pharmaceutical preparations created visually recognizable and easily identifiable patterns (Fig. 1). In case of
Echinacea 10−2, Baptisia 10−3, and Luffa 10−4 the patterns consisted of dendritic, fractal-like structures placed in
the droplet center. Echinacea 10−2 created large, dense networks of very fine ramifications, Baptisia 10−3 created
rather small, roundly shaped structures, and Luffa 10−4 structures made out of rather few and thick dendrites.
Baptisia 10−4 created unspecific patterns consisting of lines, smears, and, in some cases, single dendrites distrib-
uted all over the droplet. Whereas, Spongia 10−6 created one to five filled, wavy forms per droplet, characterized
by a concave and a convex side, placed near to each other and facing each other with the concave sides.
In general, in all pharmaceutical preparations, the impact of succussion on the patterns was visually percepti-
ble in a varying, but rather small degree, and it seemed to decrease the structure’s ordering.
Computerized pattern evaluation. The results of the computerized pattern evaluation of the pharma-
ceutical preparations produced with different numbers of succussion strokes (NS = 100, 10, 0), the corresponding
systematic positive control experiments, and the F-tests of the analysis of variance for Echinacea 10−2, Baptisia
10−3, Baptisia 10−4, Luffa 10−4, and Spongia 10−6 are shown in Tables 1–5, respectively.
Echinacea 10−2. In case of Echinacea 10−2 (Table 1) application of succussion significantly increased the
pattern evaluation parameters grey level distribution (GLD) and entropy (for NS = 10, 100). Also, the fractality
parameters local connected fractal dimension (LCFD) and lacunarity increased following the succussion, however,
LCFD only for NS = 10 and lacunarity only for NS = 100.
All systematic control experiments performed did not show any significance between the randomization
groups for the main effects.
Baptisia 10−3. As shown in Table 2, Baptisia 10−3 succussed samples (NS = 100, 10) were characterized by
significantly lower GLD, entropy, FP, and LCFD values compared to the unsuccussed samples, whereas lacunarity
was significantly higher.
The systematic control experiments yielded a significant main effect for the parameters FP and entropy; the
other three image analysis parameters did not show statistically significant differences between the randomization
groups for the main effects. Thus, the main experiments’ outcome regarding FP and entropy can be distorted due
to chamber gradients (see below) and was excluded from further evaluation.
Scientific Reports | (2020) 10:570 | https://doi.org/10.1038/s41598-019-57009-2 2www.nature.com/scientificreports/ www.nature.com/scientificreports
Figure 1. Examples of patterns formed in evaporating droplets of liquid pharmaceutical preparations;
the droplet residues dried on a glass substrate were photographed by means of dark-field microscopy in
magnification 100×. In rows patterns obtained from Echinacea 10−2, Baptisia 10−3, Baptisia 10−4, Luffa
10−4, and Spongia 10−6 are represented, whereas in columns varies the preparation manner consisting in the
performance of vertical succussion strokes (NS = 100, 10, or 0). Pattern examples derive from main experiments
(cf. Fig. 2) and were selected based on an image-analysis parameter value (grey-level distribution (GLD),
lacunarity (LAC), and local connected fractal dimension (LCFD)), which is close to the mean value of the
corresponding parameter. Different letter codes (a, b, c) are significantly different (p < 0.05).
Baptisia 10−4. In case of Baptisia 10−4 the parameter FP could differentiate significantly between all samples
(NS = 0, 10, 100); whereas the parameters GLD, entropy, LCFD, and lacunarity differentiated between the suc-
cussed (NS = 10, 100) and unsuccussed (NS = 0) samples (Table 3).
The systematic control experiments yielded a significant main effect for the parameter FP; the other four
image analysis parameters did not show statistically significant differences between the randomization groups for
the main effects. Thus, the main experiments’ outcome regarding FP can be distorted due to chamber gradients
(see below) and was excluded from further evaluation.
Scientific Reports | (2020) 10:570 | https://doi.org/10.1038/s41598-019-57009-2 3www.nature.com/scientificreports/ www.nature.com/scientificreports
Echinacea 10−2 SPC Echinacea 10−2 SPC
NS N Mean NS N Mean Factor F p F p
100 138 22.28 a 10 140 7.78 a NS 6.25 0.0021** 1.40 0.3694 ns
GLD 10 127 22.11 a 10 133 8.23 a 133 81.77www.nature.com/scientificreports/ www.nature.com/scientificreports
Baptisia 10−4 SPC Baptisia 10−4 SPC
NS N Mean NS N Mean Factor F p F p
100 158 1.47 a 10 133 0.78 a NS 14.70www.nature.com/scientificreports/ www.nature.com/scientificreports
Spongia 10−6 SPC Spongia 10−6 SPC
NS N Mean NS N Mean Factor F p F p
100 131 1.97 b 10 120 0.72 a NS 2.87 0.0574 ns 1.23 0.2937 ns
GLD 10 128 2.31 a 10 119 0.80 a Day 15.68www.nature.com/scientificreports/ www.nature.com/scientificreports
Echinacea 10−2 Baptisia 10−3 Baptisia 10−4 Luffa 10−4 Spongia 10−6
Factor F p F p F p F p F p
Row 3.35 0.0191* 3.52 0.0152* 3.29 0.0208* 1.58 0.1934 ns 2.38 0.0691 ns
GLD Column 1.01 0.3644 ns 2.49 0.0839 ns 0.11 0.8910 ns 1.91 0.1496 ns 1.35 0.2592 ns
Interaction 0.97 0.4443 ns 2.49 0.0223* 2.46 0.0238* 1.22 0.2968 ns 0.42 0.8625 ns
Row 2.08 0.1019 ns 1.80 0.1457 ns 4.39 0.0047** 0.71 0.5460 ns 5.20 0.0016**
Entropy Column 0.97 0.3787 ns 0.85 0.4269 ns 0.75 0.4737 ns 1.60 0.2039 ns 2.03 0.1324 ns
Interaction 0.52 0.7958 ns 3.14 0.0051** 2.29 0.0351* 1.83 0.0920 ns 3.33 0.0034**
Row 4.79 0.0027** 2.53 0.0570 ns 6.20 0.0004*** 0.75 0.5250 ns 0.88 0.4515 ns
FP Column 1.04 0.3532 ns 0.90 0.4053 ns 0.15 0.8633 ns 0.21 0.8121 ns 1.05 0.3501 ns
Interaction 1.06 0.3839 ns 2.07 0.0564 ns 3.67 0.0015** 0.51 0.7990 ns 0.59 0.7372 ns
Row 2.95 0.0328* 2.34 0.0729 ns 5.15 0.0017** 2.65 0.0485* 0.15 0.9315 ns
LCFD Column 1.24 0.2914 ns 1.47 0.2301 ns 1.08 0.3417 ns 1.54 0.2148 ns 1.46 0.2335 ns
Interaction 1.55 0.1607 ns 1.47 0.1888 ns 3.50 0.0022** 1.08 0.3757 ns 1.39 0.2128 ns
Row 0.35www.nature.com/scientificreports/ www.nature.com/scientificreports
Figure 2. Flow-chart depicting the study design consisting of main experiments aiming at the differentiation
of five pharmaceutical preparations (Echinacea 10−2, Baptisia 10−3, Baptisia 10−4, Luffa 10−4, and Spongia
10−6) prepared with different numbers of succussion strokes (NS = 100, 10, or 0) and corresponding systematic
positive control experiments.
Study design. The experimentation took place in the laboratories of Society for Cancer Research (Arlesheim,
Switzerland). As shown in Fig. 2 the study consisted of main experiments and full systematic positive control
experiments. The main experiments were performed on five pharmaceutical preparations (Echinacea 10−2,
Baptisia 10−3, Baptisia 10−4, Luffa 10−4, and Spongia 10−6), prepared from the 10−1 dilutions by applying different
numbers of succussion strokes (NS = 100, 10, or 0). These three variations of a given homeopathic preparation
were analyzed in one experimental run, consisting of twelve slides with droplets deposited on them (Fig. 3). Four
slides were used for each pharmaceutical preparation. The slides were distributed in a climatized chamber fol-
lowing a quasi-randomization design. Each main experiment had a corresponding systematic positive control
experiment where the analyzed sample was prepared three times with NS = 10 and analyzed following the same
quasi-randomization design as in the main experiment. All experiments were independently repeated three times.
Preparation of pharmaceutical preparations for analysis. 0.8 g of a pharmaceutical preparation in
dilution 10−1 was weighed and placed in a sterile glass cylinder (SBR-ET, Mix Cyl. 10 ml, B; Brand GmbH + CO
KG, Wertheim, Germany) with stopper (untargeted volume 13 ml); subsequently 7.2 ml purified water according
to Pharm. Eur. 9.412 (“purified water in bulk”, X-SEPTRON LINE 10 VAL, BWT AQUA AG, Aesch, Switzerland)
was added in order to reach a dilution of 1:9. The cylinder was closed tightly; 10 or 100 succussion strokes were
applied by hand. The movement to achieve succussion was performed in the air without hitting against a firm
base. For the unsuccussed samples, the content of the cylinder was mixed with a glass stirrer by performing
circular movements in order to not create any foam. After the settling of any foam in preparations NS = 10 and
100, the cylinders were re-opened and 0.8 ml of the solution were taken for the preparation of the next dilution,
as described previously. In this way three variants (NS = 100, 10, 0) of each preparation (Echinacea 10−2, Baptisia
10−3, Baptisia 10−4, Luffa 10−4, and Spongia 10−6) were produced. All samples were prepared fresh for each exper-
iment. The samples were not blinded.
Droplet evaporation method. Microscope slides (76 × 26 mm, pre-cleaned, cut edges; Thermo Scientific,
Gerhard Menzel B.V. & Co. KG, Braunschweig, Germany) were degreased by washing them with a dishwasher
liquid, then thoroughly rinsed with hot tap water, and placed in 4 consecutive purified water baths. Each slide
was wiped dry with a laboratory wiper (KIMTECH science, Kimberly-Clark Professional, Roswell, Canada) just
before droplet deposition. 3 μl droplets of the tested pharmaceutical preparation were deposited on the slides in
two parallel rows, 7 droplets per row, by the use of a micro-pipette of 20 µl capacity (Eppendorf Research Plus,
Eppendorf, Hamburg, Germany).
Evaporation took place in an incubator (KBF 720, cooled incubator with controlled humidity system, WTB
Binder Labortechnik GmbH, Tuttingen, Germany) with an inner plexi-glass-chamber with a semi-permeable
cover placed on a vibration absorbing basis. The microscope slides with droplets were placed in the inner-chamber
and left for evaporation in 26 °C and 44%rH for 1 hour. The slide distribution inside the chamber followed a
quasi-randomization design in order to provide a uniform arrangement of the samples within the rows (Fig. 2).
Scientific Reports | (2020) 10:570 | https://doi.org/10.1038/s41598-019-57009-2 8www.nature.com/scientificreports/ www.nature.com/scientificreports
Figure 3. Graphical representation of one chamber-run design. The arrangement of the slides in the
evaporation chamber was organized in 4 rows (a-d) and 3 columns (1–3), in which 12 slides were placed (slide
a1, a2, … d3). On each slide 14 droplets were deposited for evaporation.
Photographing of patterns. The droplet residues were examined and photographed in dark field in mag-
nification 100× by use of an optical microscope (Zeiss Lab.A1; Carl Zeiss Microscopy GmbH, Jena, Germany)
with an attached camera (Moticam 5.0 MP; CMOS; Motic Electric Group Co., Ltd, Xiamen, China). Droplets
with disturbed crystallization due to presence of contaminating particles or due to edge effects on the slide were
not considered. Per experiment (one chamber-run, Fig. 3), 168 droplets were prepared (14 droplets x 12 slides).
For Echinacea 10−2 the three main experiments yielded 399 evaluable droplet residue images and the three
positive control experiments 406 images (399/406); for Baptisia 10−3 415/387; for Baptisia 10−4 461/386; for Luffa
10−4 410/413; and for Spongia 10−6 395/354, giving in total 4’026 images. Images were saved in jpeg-format
(2592 × 1944 pixel).
In case of Echinacea 10−2, Baptisia 10−3, Luffa 10−4, and Spongia 10−6, the 100X images included the whole
structure formed inside the droplet; whereas, in case of Baptisia 10−4, only selected parts of the structure were
included, chosen by the experimenter on the basis of density and intensity of forms.
Computerized pattern evaluation. Image analysis was performed with the software ImageJ (v. 1.50b)27
with the plug-ins GLCM Texture28 and Frac-Lac16. All 100× images were subjected to a background extraction by
means of the sliding paraboloid with rolling ball radius set at 50 pixels ensuring same background throughout the
image database. Consecutively the images were analyzed (i) for their grey-level distribution, (ii) after conversion
into 8-bit type, by running the GLCM algorithm (considering distances between pixel pairs of 4 pixels and angles
of 90°), for their texture (parameter entropy), and (iii) after conversion into binary, by means of Frac-Lac’s DLC
tool with odd sizes scaling method and size limits for the grid caliber series of minimum 4 and maximum 40
pixels, for the size of the structures (parameter foreground pixels), complexity (parameter local connected fractal
dimension), and characterization of the gaps between the structure elements (parameter lacunarity). After conver-
sion into binary, 68 Echinacea 10−2 images could not be used due to a too dense ramification-network, and were
excluded from fractality analysis. Whereas, in case of Baptisia 10−3 and Luffa 10−4, fractal analysis was performed
on images reduced in size to 500 × 375 pixel.
Statistical analysis. The data deriving from the computerized image analysis were analyzed by means of a
two-way analysis of variance (CoStat, v. 6.311) (CoHort Software, Monterey, USA) at alpha = 0.05 with independent
factors number of succussion strokes (NS) and day or row and column. An interaction term between the independent
factors was included in the statistical model in order to assess stability and reproducibility. Distribution of data was
checked by visual inspection. Slight deviations from normality were irrelevant due to the central limit theorem.
Data-sets with larger deviations from normality were logarithmically transformed (log10); in total 18 data sets were
transformed (Echinacea 10−2 main/control study: FP, LAC/FP, LAC; Baptisia 10−3: FP, LAC/FP, LAC; Baptisia 10−4:
GLD, FP/GLD, FP; Luffa 10−4: FP/FP; Spongia 10−6: GLD, FP/GLD, FP). Global significance was determined with
F-tests. Pairwise mean comparison was performed two-tailed with the protected Fisher’s least significant differ-
ence test (pairwise comparisons were evaluated only if the global F-test was significant at p < 0.05). This procedure
gives a good safeguard against type I as well as type II errors, and thus balances well between false-positive and
false-negative conclusions29. Results of the transformed data sets were back-transformed for presentation.
Data availability
The datasets generated and analyzed during the current study are available from the corresponding author on
reasonable request.
Received: 11 April 2019; Accepted: 20 December 2019;
Published: xx xx xxxx
Scientific Reports | (2020) 10:570 | https://doi.org/10.1038/s41598-019-57009-2 9www.nature.com/scientificreports/ www.nature.com/scientificreports
References
1. Kiese, S. et al. Shaken, not stirred: mechanical stress testing of an IgG1 antibody. J. Pharm. Sci. 97(10), 4347–66 (2008).
2. Randolph, T. W. et al. Do Not Drop: Mechanical Shock in Vials Causes Cavitation, Protein Aggregation, and Particle Formation. J.
Pharm. Sci. 104, 602–11 (2015).
3. Kelkar, M. A., Gogate, P. R. & Pandit, A. B. Process intensification using cavitation: optimization of oxidation conditions for
synthesis of sulfone. Ultrason Sonochem. 13, 523–8 (2006).
4. Thomas, C. R. & Geer, D. Effects of shear on proteins in solution. Biotechnol. Lett. 33, 443–56 (2011).
5. Jayaraman, M., Buck, P. M., Ignatius, A. A., King, K. R. & Wang, W. Agitation-induced aggregation and subvisible particulate
formation in model proteins. Eur. J. Pharm. Biopharm. 87, 299–309 (2014).
6. Gerhardt, A. et al. Protein aggregation and particle formation in prefilled glass Syringes. J. Pharm. Sci. 103, 1601–1612 (2014).
7. Mampallil, D. & Eral, H. B. A review on suppression and utilization of the coffee-ring effect. Adv. Colloid Interface Sci. 252, 38–54 (2018).
8. Bhardwaj, R., Fang, X., Somasundaran, P. & Attinger, D. Self-assembly of colloidal particles from evaporating droplets: role of DLVO
interactions and proposition of a phase diagram. Langmuir 26(11), 7833–7842 (2010).
9. Misyura, S. Y. Evaporation of a sessile water drop and a drop of aqueous salt solution. Sci. Rep. 7, 14759 (2017).
10. Chen, R., Zhang, L., Zang, D. & Shen, W. Blood drop patterns: formation and application. Adv. Colloid Interface Sci. 23, 1–14 (2016).
11. Kokornaczyk, M.O., Würtenberger, S. & Baumgartner, S. Phenomenological characterization of homeopathic preparations in low
potency levels by means of pattern formation in evaporating droplets. Homeopathy, https://doi.org/10.1055/s-0038-1676325 (2018).
12. European Pharmacopoeia, Ninth Edition, Supplement 9.4. EDQM, editor. Stasbourg, France: Council of Europe; 2017.
13. Kokornaczyk, M. O., Scherr, C. & Baumgartner, S. Phase-transition-induced pattern formation applied to basic research on
homeopathy: a systematic review. Homeopathy. 107, 181–188 (2018).
14. Kokornaczyk, M. O. et al. Self-organized crystallization patterns from evaporating droplets of common wheat grain leakages as a
potential tool for quality analysis. ScientificWorldJournal. 11, 1712–25 (2011).
15. Ferreira, T., Rasband, W.S. ImageJ User Guide — IJ 1.46. From: imagej.nih.gov/ij/docs/guide/. (2010–2012).
16. Karperien, A. FracLac for ImageJ, http://rsb.info.nih.gov/ij/plugins/fraclac/FLHelp/Introduction.htm (1999-2013).
17. Eichkitz, C. G., Amtmann, J. & Schreilechner, M. G. Calculation of grey level co-occurance matix-based seismic attributes in three
dimensions. Computers & Geosciences 60, 176–183 (2013).
18. Kalliantas, D., Kassalia, M. E. & Karigianni, C. H. S. Trituration and fractal dimension in homeopathic Pharmacopoeia. Pharm Anal
Acta. 8, 554 (2017).
19. Kokornaczyk, M. O. et al. Droplet evaporation method as a new potential approach for highlighting the effectiveness of ultra high
dilutions. Complement Ther Med. 22, 333–40 (2014).
20. Kokornaczyk, M. O., Baumgartner, S. & Betti, L. Polycrystalline structures formed in evaporating droplets as a parameter to test the
action of Zincum metallicum 30c in a wheat seed model. Homeopathy. 105, 173–9 (2016).
21. Betti, L. et al. Number of succussion strokes affects effectiveness of ultra-high-diluted arsenic on in vitro wheat germination and
polycrystalline structures obtained by droplet evaporation method. Homeopathy. 106, 47–54 (2017).
22. Baumgartner, S., Doesburg, P., Scherr, C. & Andersen, J.O. Development of a biocrystallisation assay for examining effects of
homeopathic preparations using cress seedlings. Evid Based Complement Alternat Med. 2012, 125945; 10.1155/E.pub (2012).
23. Wiesbauer, J., Cardinale, M. & Nidetzky, B. Shaking and stirring: Comparison of controlled laboratory stress conditions applied to
the human growth hormone. Process Biochem. 48, 33–40 (2013).
24. Waxman, L. & Vilivam, V. A comparison of protein stability in prefillable syringes made of glass and plastic. PDA J. Pharm. Sci.
Technol. 71, https://doi.org/10.5731/pdajpst.2016.007146 (2017).
25. Gerhardt, A., Nguyen, B., Lewus, R., Carpenter, J. & Randolph, T. Effect of the siliconization method on particle generation in a
monoclonal antibody formulation in pre-filled syringes. J. Pharm. Sci. 104 https://doi.org/10.1002/jps.24387 (2015).
26. Uchino, T. et al. Reconstitution of L-Asparaginase in siliconized syringes with shaking and headspace air induces protein
aggregation. Chem Pharm Bull (Tokyo). 63, 770–779 (2015).
27. Schneider, C. A., Rasband, W. S. & Eliceiri, K. W. NIH Image to ImageJ: 25 years of image analysis. Nature methods 9(7), 671–675
(2012).
28. Cabrera, J. E. GLCM texture analyzer. https://imagej.nih.gov/ij/plugins/texture.html (2003–2006).
29. Carmer, S. G. & Swanson, M. R. An evaluation of ten pairwise multiple comparison procedures by Monte Carlo Methods. J. Am.
Stat. Assoc. 68, 66–74 (1973).
Author contributions
M.O.K., S.W., S.B. designed the experimental set-up of the study. Experiments were performed by M.O.K. Data
were extracted and statistically analyzed by M.O.K. Statistical analysis was independently cross-checked by S.B.
The manuscript was written by M.O.K., S.B. and S.W. All authors approved the final version of the manuscript.
Competing interests
The authors declare no competing interests.
Additional information
Correspondence and requests for materials should be addressed to M.O.K.
Reprints and permissions information is available at www.nature.com/reprints.
Publisher’s note Springer Nature remains neutral with regard to jurisdictional claims in published maps and
institutional affiliations.
Open Access This article is licensed under a Creative Commons Attribution 4.0 International
License, which permits use, sharing, adaptation, distribution and reproduction in any medium or
format, as long as you give appropriate credit to the original author(s) and the source, provide a link to the Cre-
ative Commons license, and indicate if changes were made. The images or other third party material in this
article are included in the article’s Creative Commons license, unless indicated otherwise in a credit line to the
material. If material is not included in the article’s Creative Commons license and your intended use is not per-
mitted by statutory regulation or exceeds the permitted use, you will need to obtain permission directly from the
copyright holder. To view a copy of this license, visit http://creativecommons.org/licenses/by/4.0/.
© The Author(s) 2020
Scientific Reports | (2020) 10:570 | https://doi.org/10.1038/s41598-019-57009-2 10You can also read