GROmars: A GROMACS-Based Toolset to Analyze Density Maps Derived from Molecular Dynamics Simulations
←
→
Page content transcription
If your browser does not render page correctly, please read the page content below
Please cite this article in press as: Briones et al., GROmars: A GROMACS-Based Toolset to Analyze Density Maps Derived from Molecular Dynamics Sim-
 ulations, Biophysical Journal (2019), https://doi.org/10.1016/j.bpj.2018.11.3126

Computational Tool

GROmars: A GROMACS-Based Toolset to Analyze
Density Maps Derived from Molecular Dynamics
Simulations
Rodolfo Briones,1 Christian Blau,2 Carsten Kutzner,3 Bert L. de Groot,3 and Camilo Aponte-Santamarı́a4,5,*
1
  Computational Neurophysiology Group, Institute of Complex Systems 4, Forschungszentrum Ju   €lich, Ju
                                                                                                      €lich, Germany; 2Department of
Biochemistry and Biophysics, Science for Life Laboratory, Stockholms Universitet, Stockholm, Sweden; 3Department of Theoretical and
Computational Biophysics, Max Planck Institute for Biophysical Chemistry, Göttingen, Germany; 4Max Planck Tandem Group in
Computational Biophysics, University of Los Andes, Bogotá, Colombia; and 5Interdisciplinary Center for Scientific Computing, Heidelberg
University, Heidelberg, Germany

ABSTRACT We introduce a computational toolset, named GROmars, to obtain and compare time-averaged density maps
from molecular dynamics simulations. GROmars efficiently computes density maps by fast multi-Gaussian spreading of atomic
densities onto a three-dimensional grid. It complements existing map-based tools by enabling spatial inspection of atomic
average localization during the simulations. Most importantly, it allows the comparison between computed and reference
maps (e.g., experimental) through calculation of difference maps and local and time-resolved global correlation. These compar-
ison operations proved useful to quantitatively contrast perturbed and control simulation data sets and to examine how much bio-
molecular systems resemble both synthetic and experimental density maps. This was especially advantageous for multimolecule
systems in which standard comparisons like RMSDs are difficult to compute. In addition, GROmars incorporates absolute and
relative spatial free-energy estimates to provide an energetic picture of atomistic localization. This is an open-source GROMACS-
based toolset, thus allowing for static or dynamic selection of atoms or even coarse-grained beads for the density calculation.
Furthermore, masking of regions was implemented to speed up calculations and to facilitate the comparison with experimental
maps. Beyond map comparison, GROmars provides a straightforward method to detect solvent cavities and average charge
distribution in biomolecular systems. We employed all these functionalities to inspect the localization of lipid and water molecules
in aquaporin systems, the binding of cholesterol to the G protein coupled chemokine receptor type 4, and the identification of
permeation pathways through the dermicidin antimicrobial channel. Based on these examples, we anticipate a high applicability
of GROmars for the analysis of molecular dynamics simulations and their comparison with experimentally determined densities.

INTRODUCTION
Molecular dynamics (MD) is a well-established method for                     complex trajectories of hundreds of thousands or even mil-
the study of biomolecular systems. By monitoring the time                    lions of atoms generated by the simulations. To extract
evolution of these systems at atomic (or quasiatomic) level                  relevant information from this large amount of data, it is
or resolution, MD provides key structural, energetic, and                    usually important to focus the analyses to particular regions
(thermo)dynamic information. This information has been                       of interest. Molecular visualization programs such as VMD
instrumental in uncovering the molecular mechanisms of a                     (2), PyMOL (3), or CHIMERA (4) have greatly contributed
growing number of bio-macromolecular systems at an un-                       to this task by allowing a visual inspection of MD simula-
precedentedly broad spatiotemporal scale range (1).                          tions. Moreover, MD packages such as GROMACS (5),
   An inherent challenge of MD is the a posteriori analysis                  NAMD (6) via VMD, AMBER (7), or CHARMM (8)
of the simulations. MD users are typically confronted with                   contain plenty of subpackages to quantitatively analyze
                                                                             MD trajectories. In addition, there are a handful of external
Submitted August 29, 2018, and accepted for publication November 26,
                                                                             tools and scripts (9–12) to compute observables from MD
2018.                                                                        simulations.
*Correspondence: ca.aponte@uniandes.edu.co                                      Because of the dynamic nature of a trajectory, atoms and
Rodolfo Briones, Christian Blau, and Carsten Kutzner contributed equally     molecules might exchange positions. If the region of interest
to this work.                                                                is localized, such as a binding pocket or a protein surface,
Editor: Michele Vendruscolo.                                                 multiple molecules such as solvent or lipids may visit
https://doi.org/10.1016/j.bpj.2018.11.3126
Ó 2018 Biophysical Society.

                                                                                               Biophysical Journal 116, 1–8, January 8, 2019 1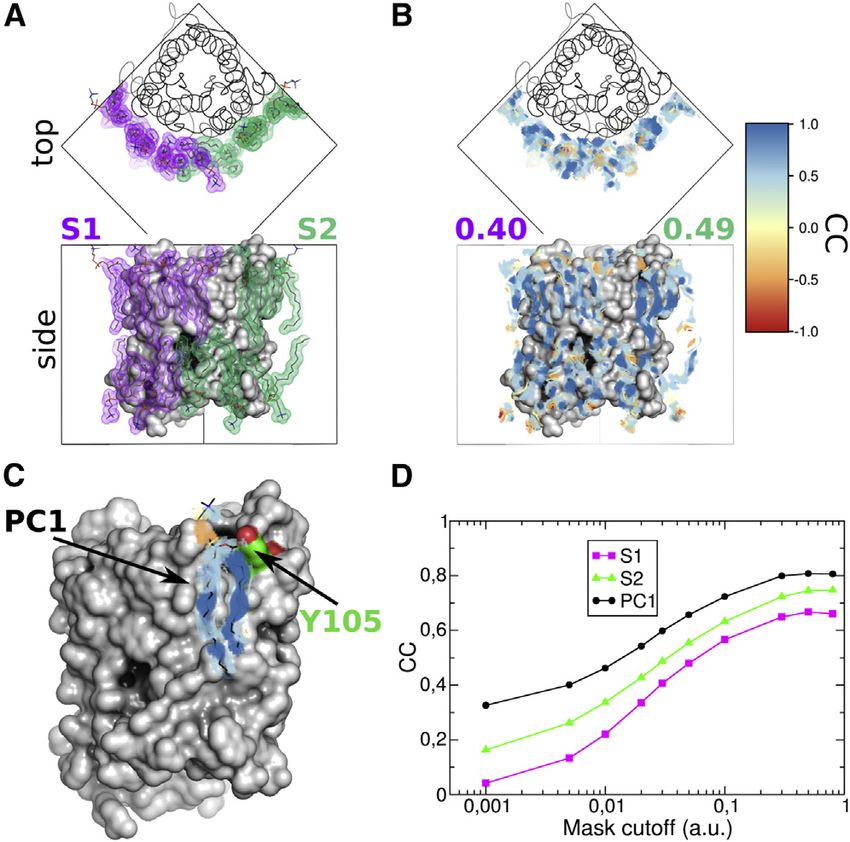
Please cite this article in press as: Briones et al., GROmars: A GROMACS-Based Toolset to Analyze Density Maps Derived from Molecular Dynamics Sim-
 ulations, Biophysical Journal (2019), https://doi.org/10.1016/j.bpj.2018.11.3126

Briones et al.

such locations during the course of a simulation. Therefore,
density maps, which average over the identity of individual
molecules, are a natural choice for analyses in such cases. In
fact, different tools have been developed to include this
functionality (GridMAT (13), g_lomepro (14), volmap in
VMD (2,15), or PackMem (16), among others).
   Likewise, atomistic density maps are ubiquitous to struc-
tural biology. Obtained by experimental techniques such
as x-ray crystallography, cryo-electron microscopy (cryo-
EM), or cryo-electron crystallograpy (cryo-EC), density
maps enable the determination of the structure of bio-mac-
romolecules and their assemblies. In practical terms, den-
sity maps have the advantage to work at a grid level,
therefore allowing straightforward analysis operations
such as difference, correlation between maps, or region
masking. In fact, structural biology suites (e.g., PHENIX
(17) or CCP4 (18)) and visualization packages (like those
mentioned above (2–4)) routinely handle and operate
with density maps.
   The use of density maps in MD simulations, not only for
analysis but also for structure refinement, is becoming
increasingly popular with experimentally biased methodol-
ogies in which structural models are fitted, for instance, into
x-ray or cryo-EM density maps (19,20). Moreover, pack-
                                                                              FIGURE 1 Density maps from atomic positions. (A) A group of N atoms
ages such as CHIMERA (4) or VMD (2) offer modules to                          is considered (here, a lipid molecule). The position of the i-th atom is ri(t).
compute occupancy maps from a structure ensemble, e.g.,                       A lattice enclosing the N atoms of dimensions (Lx, Ly, Lz) and origin defined
representing different snapshots of an MD trajectory. Apart                   by the vector Lmin is considered. (B) Atomic Gaussian spreading on the lat-
from the occupancy, the possibility of using density maps to                  tice is sketched for one atom in red. Spreading is shown in two dimensions
                                                                              for clarity. The density contribution of the i-th atom at the lattice position gj
compare sets of MD simulations has been less explored by
                                                                              depends on the separation jgj  ri(t)j. Lattice resolution is indicated at the
the current available tools.                                                  top right corner. (C) The resulting density map for the lipid molecule is ob-
   Here, we exploit this possibility by introducing                           tained by summing up all atomic contributions onto all lattice points (con-
GROmars, an open-source GROMACS-based toolset, to                             toured at 1s). For MD trajectories, the density map is time averaged over an
efficiently compute and compare time-averaged density                         ensemble of positions sampled by the group of atoms. To see this figure in
                                                                              color, go online.
maps derived from MD simulations. GROmars produces
density maps that allow us to spatially inspect the average
location of atoms of interest during a simulation. Thus,
                                                                              (Fig. 1 A). The lattice is divided into Nx, Ny, and Nz bins, thus yielding
it constitutes an alternative to the current map-based tools
                                                                              a resolution of Dx ¼ Lx/Nx, Dy ¼ Ly/Ny, and Dz ¼ Lz/Nz along the three
designed for this purpose. Most importantly, GROmars ex-                      principal coordinate axes (Fig. 1 B). The coordinates of the j-th lattice
pands these tools by enabling quantitative comparison of the                  point are given by the vector gj.
computed map with a reference map derived, for instance,                         We assume that each atom spreads isotropically and model the spatial
from experiments or control simulations. In this work, we                     decay of the atomic density with a linear combination of NG Gaussians.
                                                                              For a point located at a distance d from the atom, the density reads
describe the methods behind GROmars and illustrate its
comparison capabilities by revealing important details of                                                            X
                                                                                                                     NG
                                                                                                                                    2
the localization of lipids and water molecules around and                                              PðdÞ ¼              Ag eBg d :                     (1)
inside two aquaporin membrane proteins, the binding of                                                               g¼1

cholesterol at the surface of CXCR4, and the solute perme-
ation through the dermicidin antimicrobial channel.                           Here, Ag and Bg are coefficients that change depending on the atom type.
                                                                              These coefficients can be obtained from the atomic scattering factors—typi-
                                                                              cally fitted by using NG ¼ 2, 4, or 5 Gaussians—from x-ray crystallography
METHODS                                                                       or electron microscopy data. Gaussians are by default truncated after five
                                                                              standard deviations, SDs (neglecting less than 1.5  105 of the total inte-
Density maps derived from MD simulations                                      grated density). The density at each lattice point is estimated by summing
                                                                              up the P contributions from all atoms to that point (Fig. 1 B):
Let us consider a group of N atoms whose time-dependent coordinates are
ri(t), with i ¼ 1...N. We define a three-dimensional lattice, enclosing the                                    X
                                                                                                               N
N atoms, of dimensions Lx, Ly, and Lz along the x, y, and z axes, respec-                        rðj; tÞ ¼       P gj  ri ðtÞ  :                        (2)
tively (Fig. 1 A). The lattice position is defined by the vector Lmin                                          i¼1

2 Biophysical Journal 116, 1–8, January 8, 2019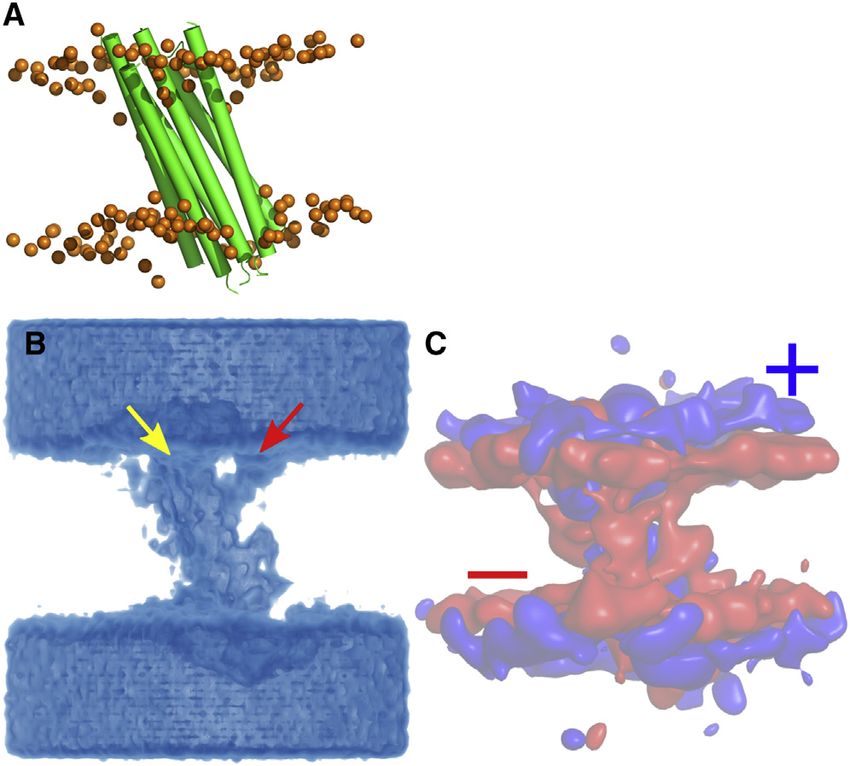
Please cite this article in press as: Briones et al., GROmars: A GROMACS-Based Toolset to Analyze Density Maps Derived from Molecular Dynamics Sim-
 ulations, Biophysical Journal (2019), https://doi.org/10.1016/j.bpj.2018.11.3126

                                                                                                                                         Computational Tool

   To reduce the computational cost of evaluating the Gaussian functions at       grid points at the borders of thickness rlocal/2 of the original lattice are
many grid points, we take advantage of the factorization of the Gaussian          not considered as centers for the cubic lattice. Hence, the correlation map
function in Eq. 1, as suggested in (21). The average density is computed          has a reduced number of bins along the three principal axes.
as the ensemble average, for example, recovered from an MD simulation
from S discrete, equally spaced time steps tn as                                  Spatial free energy

                                   1X S                                           Absolute (Gabs(j)) and relative (Grel(j)) spatial free-energy estimates are
                         rðjÞ ¼          rðj; tn Þ:                        (3)    defined according to the formulas
                                   S n¼1
                                                                                                        Gabs ðjÞ ¼ G0  ln rðjÞ                              (7)
Accordingly, an estimate of the SD of the density reads

                                    S                  2
                               1 X                                                and
             s2 ðrðjÞÞ ¼                rðj; tn Þ  rðjÞ :                 (4)                                                    !
                             S  1n ¼ 1                                                                                   rðjÞ
                                                                                                      Grel ðjÞ ¼ G0  ln           :                         (8)
                                                                                                                         rref ðjÞ
Therefore, the density map produced by GROmars consists of the time
average and the SD of the density, computed by using Eqs. 3 and 4, at all
grid points j of the lattice.                                                     Here, G0 is an arbitrarily chosen reference value. These two values permit
                                                                                  us to obtain an energetic picture of the atomistic localization, by contrasting
                                                                                  different regions within the same map (absolute estimate) or different maps
Comparison with a reference density map                                           at the same position (relative estimate). Regions of zero density can be
                                                                                  masked to avoid singularities in the calculation (see Atom Selection and
GROmars allows the comparison of the computed density map with an                 Region Masking below).
external reference map, rref. This reference map may be derived, for
instance, from a control simulation or an experimentally determined map
from x-ray crystallography, cryo-EM, or cryo-EC. Several arithmetic and           Atom selection and region masking
statistical operations are enabled to quantitatively compare the maps.
                                                                                  A density calculation may be restricted to a fixed or a dynamic set of atoms,
Difference density maps                                                           e.g., protein atoms for the former or ligand atoms located within 5 Å from a
                                                                                  protein for the latter. In addition, GROmars allows us to mask regions using
A difference map is calculated by subtracting the reference from the
                                                                                  an external map file with the same geometry and resolution of the computed
computed map:
                                                                                  density map. The mask value at the j-th lattice point is M(j). Accordingly, if
                                                                                  M(j) is smaller than a threshold mask cutoff Mcutoff, then the calculation of
                        DrðjÞ ¼ rðjÞ  rref ðjÞ:                           (5)
                                                                                  the average density at this point is excluded:

Dr(j) allows to detect the changes in the average atomic localization, for                               masked;   if MðjÞ < Mcutoff
instance, of a perturbed simulation in comparison to a control simulation.                      rðjÞ is                                                      (9)
                                                                                                         unmasked; otherwise:
Global correlation
                                                                                  The masking attribute allows to focus the comparison between maps within
A global correlation coefficient (cc) between the computed and the refer-         regions of interest that cannot be specified by atom selections. Accordingly,
ence map is retrieved as                                                          comparison operations are carried out only for the unmasked points. If no
                    Ph           i                                                external mask map is provided, then the whole lattice is considered for
                     j rð j Þ  m  ½rref ð j Þ  mref                           the comparison.
     cc ¼                                                1         ;     (6)
                Ph              i2 P                    2
                                                           2
                   j   rð jÞ  m  j ½rref ð jÞ  mref                           Simulation and density-calculation details
                                                                                  Gaussian coefficients (Ag and Bg) were derived from electron crystallog-
where the summations add up all the j points of the density map. Here,            raphy structure factors (22). These values were set as the default values
m and mref denote the spatial mean of the density mapsr and rref, respec-         of the toolset, although any other arbitrary set can be specified by the
tively. The global correlation is also obtained in a time-resolved fashion        user. The toolset features are illustrated through four membrane protein ex-
by block averaging the density for a moving time window of size Dt.               amples (see below), although its applicability is not restricted to these types
Accordingly, for each time t R Dt, the density map entering into Eq. 6 cor-       of proteins. Previous MD trajectories (23–26) and experimental density
responds to that obtained within the time range [t  Dt, t].                      maps (24,27) were considered. See trajectory preparation and density-
                                                                                  calculation details in the Supporting Materials and Methods.
Local correlation
The local correlation at different points of the lattice is computed, following
a similar implementation as the one from CHIMERA (4). A small cubic lat-          RESULTS AND DISCUSSION
tice of size rlocal in each dimension is considered. The cubic lattice is
centered at a grid position j. Subsequently, the correlation coefficient be-
                                                                                  Difference maps: Comparison between perturbed
tween the computed map and the reference map is obtained using Eq. 6,             and control simulations
but only considering the grid points that are within the cubic lattice. The re-
sulting value is stored at the center grid point j. The process is repeated by
                                                                                  We studied the localization of lipids around aquaporin-0
sliding the cubic lattice over the space, thus yielding a local correlation       (AQP0) to illustrate the basic features of GROmars.
map. To avoid a different number of grid points in the calculation, the           AQP0 is the most abundant protein in the eye lens, where

                                                                                                     Biophysical Journal 116, 1–8, January 8, 2019 3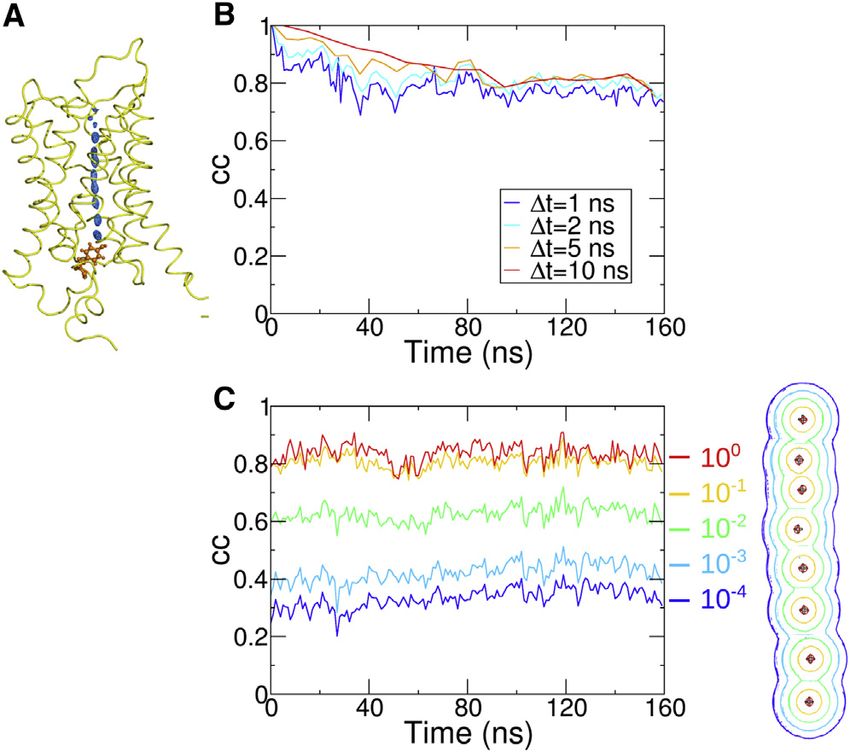
Please cite this article in press as: Briones et al., GROmars: A GROMACS-Based Toolset to Analyze Density Maps Derived from Molecular Dynamics Sim-
ulations, Biophysical Journal (2019), https://doi.org/10.1016/j.bpj.2018.11.3126
Briones et al.
it acts as an anchor between membrane junctions (28) lation, which were not visited in the restrained simulations.
(Fig. 2 A). AQP0 is an ideal system to systematically assess By symmetry, the lipid-exposed protein surface could be
lipid-protein interactions in biological membranes with both divided into two adjacent surfaces, S1 and S2 (Fig. 2 A).
cryo-EC (27,29,30) and MD simulations (23,31,32). As a Increments in the density are more notable on the S2
validation of our implementation, we first reproduced with surface, which was found to be more rigid than S1. Differ-
GROmars the density maps we obtained earlier for dimyr- ence maps are routinely computed in crystallography.
istoylglycerophosphocholine (DMPC) lipids (23). In fact, Here, by applying the same strategy to maps derived
we obtained identical maps as before, highlighting that from MD simulations, we could visually stress the
annular lipids display a high level of localization, whereas effect of protein mobility on the localization of annular
bulk lipids show smearing of their positions (31) (Fig. 2, lipids (31).
B and C). We then computed with GROmars a difference
map to contrast a perturbed and a control simulation. In
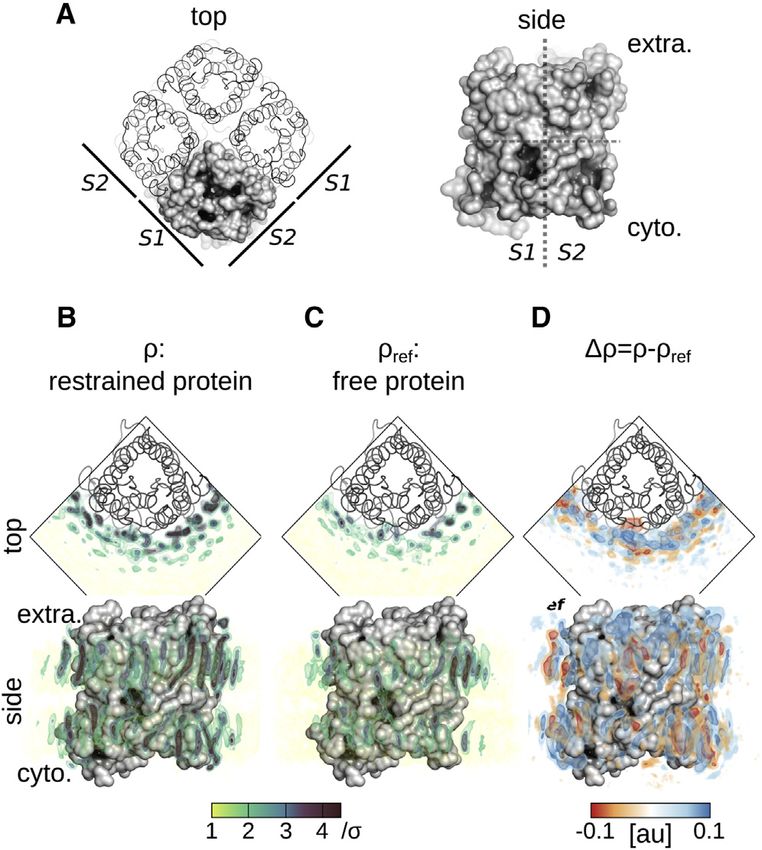
Correlation between MD and experimental maps
the perturbed simulation, AQP0 was maintained as a rigid
body, whereas the lipids, water molecules, and ions were We next examined for the DMPC-AQP0 system the correla-
fully flexible (Fig. 2 B). In the control simulation, AQP0 tion between the map obtained from MD simulations and
was also fully flexible (23) (Fig. 2 C). The difference map the map determined by cryo-EC (Fig. 3). In the simulations,
revealed regions with increased density (blue), which is an the protein was free to move. To focus on the annular lipids,
indication of stronger localization for the acyl chains in we masked all the lattice voxels except those overlapping
front of the rigid AQP0 (Fig. 2 D). The reduced-density with the solved cryo-EC annular-lipid positions (Fig. 3 A).
red areas (red) corresponded mainly to zones affected The global correlation coefficient was 0.40 for S1 and
by the protein expansion in the unrestrained control simu- 0.49 for S2. Despite the moderate global correlation, the
local correlation map displayed regions of high correlation
(Fig. 3 B). In particular, at the crystallographic position
FIGURE 3 Correlation between MD and experimental maps (A). Crys-
FIGURE 2 Difference map highlights changes between perturbed and tallographic annular-lipid positions (color) around AQP0 (black) were
control simulations (A). Aquaporin-0 (AQP0) is displayed (tetramer: considered for the correlation calculation. The remaining regions were
cartoon and one monomer: surface). (B and C) Normalized density maps masked. The lipid masks were separated by symmetry into surface S1
for DMPC lipids (color) around an AQP0 monomer (gray) are shown. (magenta) and S2 (green). (B) Local correlation map around AQP0 is dis-
The protein was position restrained (B: r) or free to move (C: rref). played in color according to the color scale at the right. Global correlation
(D) The difference map between the perturbed and the reference map is dis- values at surfaces S1 and S2 are indicated. (C) The local correlation map
played (Dr ¼ r rref). The density is contoured as isosurfaces at different near the crystallographic lipid PC1 is depicted (same color code as in B).
SD levels (s) in (B and C) and at absolute arbitrary units (au) in (D). In all (D) Global correlation as a function of the mask cutoff, Mcutoff, is presented
panels, top and side views are displayed (extra: extracellular; intra: intracel- for the indicated regions. The correlation maps presented in (B) and (C)
lular, and S1 and S2: surface sides for each monomer). To see this figure in correspond to Mcutoff ¼ 0.03 and 0.02, respectively. To see this figure in
color, go online. color, go online.
4 Biophysical Journal 116, 1–8, January 8, 2019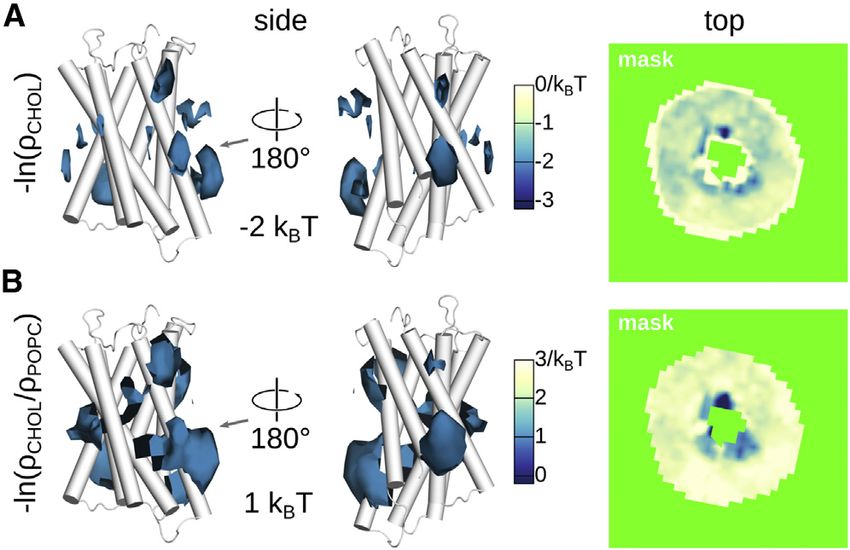
Please cite this article in press as: Briones et al., GROmars: A GROMACS-Based Toolset to Analyze Density Maps Derived from Molecular Dynamics Sim-
 ulations, Biophysical Journal (2019), https://doi.org/10.1016/j.bpj.2018.11.3126

                                                                                                                                Computational Tool

PC1, the global correlation coefficient was found to be 0.54,                    exchanging their positions (among themselves and also
and this value locally increased up to values of up to 0.8                       with water molecules from the bulk media), it is difficult
(Fig. 3 C). We observed that the global correlation increased                    to establish how much they deviate from their original (or
when increasing the masked region by augmenting the mask                         other reference) positions with conventional similarity mea-
cutoff Mcutoff (Fig. 3 D). This suggest that for the regions of                  sures such as root-mean-square deviations (RMSDs). To
high lipid localization (high density), there is a good corre-                   tackle this difficulty, we computed the density map of this
spondence between the experimental and the MD maps. In                           set of water molecules within time windows Dt and deter-
contrast, diffuse experimental lipid positions (low density)                     mined the correlation coefficient with the map computed
cannot be uniquely attributed to the smearing out of the den-                    during the first time window (Fig. 4 B). The correlation sta-
sity by the lipid dynamics in the simulations. The correla-                      bilized at around a value of 0.8 after 40 ns of relaxation,
tion analysis presented here thus allowed us to expand our                       thereby indicating that inside the channel, the water posi-
previous studies (23,31) by including a more quantitative                        tions preserved a high correlation with the initial water
comparison of the cryo-EC and the MD data sets.                                  localization. Note that increasing Dt increased the relaxa-
                                                                                 tion time (by about twofold), but the correlation converged
                                                                                 to the same value. We also considered the x-ray density map
Time-resolved global correlation
                                                                                 (24) as a reference for the correlation calculation (Fig. 4 C).
We next examined the localization of water molecules                             We restricted the calculations to a volume that enclosed the
inside the yeast aquaporin channel, Aqy1 (Fig. 4 A). Aqy1                        crystallographic water molecules by masking the rest of the
aids yeast to counteract sudden osmotic shocks by regu-                          space (Fig. 4 C, right). Because 40 ns of equilibration pre-
lating membrane water permeation through a gating                                ceded this simulation (and this part was omitted from this
mechanism involving phosphorylation and potentially                              analysis), the correlation coefficient did not start at a value
membrane-mediated mechanical stress (33). Because the                            of one but at lower values. Subsequently, the correlation co-
water molecules inside the Aqy1 pore are constantly                              efficient fluctuated around a converged value that increased
                                                                                 by reducing the considered volume enclosing the crystallo-
                                                                                 graphic water molecules. The high correlation encountered
                                                                                 here for small enclosing volumes is consistent with our pre-
                                                                                 vious observation that the average positions of the water
                                                                                 molecules inside the channel (related to local minima in
                                                                                 the free-energy profile along the pore coordinate) agree
                                                                                 well with the x-ray crystallographic positions (24). When
                                                                                 extending to larger volumes, energetically unstable regions
                                                                                 are also considered, and they may not be captured compa-
                                                                                 rably well in the simulation and in the experiment. In addi-
                                                                                 tion, the density of the protein atoms contributed to the x-ray
                                                                                 map but not to the MD-computed map. These two may be
                                                                                 the reasons for the low correlation for large enclosing vol-
                                                                                 umes. Overall, the time-resolved correlation analysis pre-
                                                                                 sented here allowed us to quantitatively monitor how
                                                                                 much this multimolecular system deviates from its initial
                                                                                 state (Fig. 4 B) and to expand the comparison between
                                                                                 simulated and experimental data beyond average positions
                                                                                 (Fig. 4 C). This type of analysis is extremely useful
                                                                                 to compare non-covalently bonded multimolecular systems,
FIGURE 4 Time-resolved global correlation allows to monitor how                  for which conventional similarity measures, like the RMSD,
much multimolecule systems deviate from initial (or reference) states.           are difficult to obtain.
(A) The x-ray structure of yeast aquaporin (Aqy1) is shown (24) (backbone:
yellow, tyrosine residue occluding the pore at the cytoplasmic side: orange,
and electron density associated to the water molecules inside the pore: con-     Spatial free energies: An energetic view of atomic
toured in blue at s ¼ 1.5). (B) The density map was computed for the water       localization
molecules inside the Aqy1 pore for different time windows Dt. The corre-
lation coefficient (cc) between the computed map and the map calculated          In this example, the energetics associated to the localization
for the first time window ([0, Dt]) is presented as a function of the time.      of cholesterol molecules around the transmembrane G pro-
(C) The cc of the computed map and the x-ray density map is depicted as
                                                                                 tein coupled chemokine receptor type 4 (CXCR4) was eval-
a function of the time. The calculation was restricted to the volumes enclos-
ing the crystallographic water molecules depicted at the right side (cystallo-   uated. The function of this important receptor has been
graphic positions: red þ symbols). The color indicates the mask cutoff value     shown to depend on the cholesterol level in the membrane
Mcutoff. To see this figure in color, go online.                                 (25,34). From the study of Pluhackova et al. (25), we took

                                                                                                Biophysical Journal 116, 1–8, January 8, 2019 5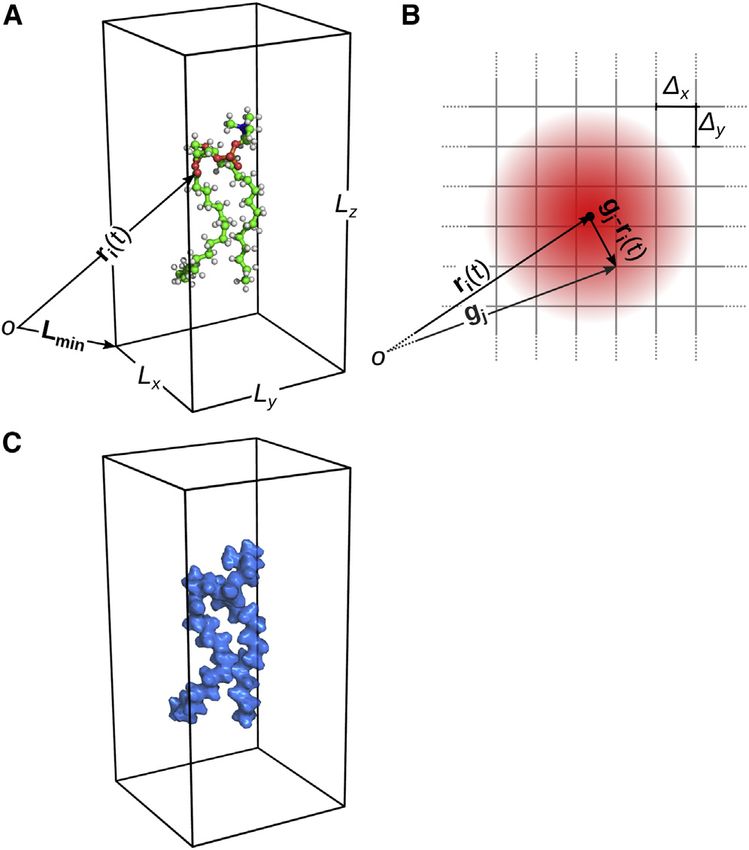
Please cite this article in press as: Briones et al., GROmars: A GROMACS-Based Toolset to Analyze Density Maps Derived from Molecular Dynamics Sim-
 ulations, Biophysical Journal (2019), https://doi.org/10.1016/j.bpj.2018.11.3126

Briones et al.

a 1-ms coarse-grained (CG) MD trajectory of CXCR4                               commodates in a tilted position inside the membrane and al-
embedded in a lipid bilayer composed of 1-palmitoyl-2-                          lows the passage of ions through an unusual side pathway
oleoyl-sn-glycero-3-phosphocholine (POPC) and choles-                           (26) (Fig. 6 A). We took the last 75 ns of a previous 150-ns
terol (1:10 cholesterol/POPC ratio). We computed spatial                       all-atom simulation of dermicidin embedded in a mixed lipid
free energy maps for cholesterol as defined by Eqs. 7 and 8                     bilayer, which was fully solvated by explicit water molecules
(Fig. 5). We considered scaled Gaussian coefficients for the                    (26). The density map of all the water molecules of the system
CG beads (see details in the Supporting Materials and                           revealed the tilted channel connecting the two water com-
Methods). The absolute free energy map revealed regions                         partments and, in addition, a small side cavity (Fig. 6 B). In
at the protein surface that were energetically favorable for                    fact, ions use this side path either to exit or to enter the chan-
cholesterol binding (Fig. 5 A). These regions might be                          nel (26). Thus, GROmars constitutes a straightforward tool
considered as sites with moderate binding affinity because                      to detect pathways through channels and in general cavities
these presented a difference of 2.0 kBT with respect to                       through biomolecules, provided that solvent molecules
the bulk regions. The relative free energy map displayed                        (water molecules in our case) fill these cavities. GROmars
the localization of cholesterol weighted by that of POPC                        is thus complementary to the pool of packages created for
lipids (Fig. 5 B). Distant from the protein, the 1:10 choles-                   this purpose (HOLE (36), MOLE (37), and CAVER (38),
terol/POPC ratio resulted in a relative free-energy difference                  among others). When the partial charges of the atoms are
of 2.3 kBT. At the cholesterol binding sites on the surface                    spread instead of the atomic densities, the resulting map
of the protein, the difference shifted toward a higher affinity                 corresponds to the average charge distribution, as presented
for cholesterol by at least 1.0 kBT from the bulk value.                        for dermicidin in Fig. 6 C. Hence, another extension of
In consequence, representation of the density in terms of                       GROmars is to help describe the average charge distribution
spatial free energies shows an energetic picture of the                         of biomolecular systems.
cholesterol localization. These results also demonstrate
that the chosen Gaussian coefficients properly account for
                                                                                CONCLUSIONS
the spreading of CG beads, extending the GROmars appli-
cation range from all-atom to CG systems.                                       Here, we present GROmars, an open-source GROMACS-
                                                                                based toolset for the efficient calculation and comparison
Beyond map comparison: GROmars as path and
charge distribution finder
In the last example, we explored the potential of GROmars to
detect pathways and cavities through biomolecules and to
determine charge distributions. We considered dermicidin,
a human antimicrobial membrane channel, which reduces
Staphylococcus aureus growth on the epidermal surface
(35). This channel is an interesting test system because it ac-

                                                                                FIGURE 6 GROmars applications beyond map comparison include the
                                                                                finding of cavities and charge distributions of biomolecules. (A) The dermi-
                                                                                cidin antimicrobial channel (green) is found in a tilted conformation inside
                                                                                a phospholipid bilayer (phosphorous atoms: orange) (26). (B). The density
FIGURE 5 Spatial free energy for cholesterol (color) around CXCR4               map of the water molecules around and inside the bilayer revealed a main
(white cartoon) is shown. Absolute (A) and relative (B) estimates are pre-      (yellow arrow) and an unconventional (red arrow) conduction pathway for
sented (side views: left, and top view: right). Top view was taken at the       the passage of solutes. The density is shown in volume representation, con-
height indicated with the gray arrows. Spatial free energy is color coded ac-   touring it at blue-shade values of 0.6, 1.0, and 1.4 s. (C) The charge density
cording to the shown scales. The region shown in green was masked. To see       of dermicidin, lipid molecules, and ions is contoured at two arbitrary (nega-
this figure in color, go online.                                                tive and positive) values. To see this figure in color, go online.

6 Biophysical Journal 116, 1–8, January 8, 2019
Please cite this article in press as: Briones et al., GROmars: A GROMACS-Based Toolset to Analyze Density Maps Derived from Molecular Dynamics Sim-
ulations, Biophysical Journal (2019), https://doi.org/10.1016/j.bpj.2018.11.3126
Computational Tool
of density maps from MD simulations. GROmars repre- 5. Abraham, M. J., T. Murtola, ., E. Lindahl. 2015. GROMACS: high
performance molecular simulations through multi-level parallelism
sents an alternative to current map-based methodologies from laptops to supercomputers. SoftwareX. 1–2:19–25.
(2,4,13,14,16) to visually inspect the average location 6. Phillips, J. C., R. Braun, ., K. Schulten. 2005. Scalable molecular dy-
of atoms of interest during simulations. Most notably, namics with NAMD. J. Comput. Chem. 26:1781–1802.
GROmars uses the concepts of density maps used in struc- 7. Case, D. A., T. E. Cheatham, III, ., R. J. Woods. 2005. The Amber
tural biology, such as difference and correlation maps, to biomolecular simulation programs. J. Comput. Chem. 26:1668–1688.
allow the comparison of perturbed and control MD data 8. Brooks, B. R., C. L. Brooks, III, ., M. Karplus. 2009. CHARMM: the
sets, as well as MD and experimental information. It is a biomolecular simulation program. J. Comput. Chem. 30:1545–1614.
powerful method to tackle multimolecular simulations for 9. McGibbon, R. T., K. A. Beauchamp, ., V. S. Pande. 2015. MDTraj: a
modern open library for the analysis of molecular dynamics trajec-
which RMSD or related comparison operations are not tories. Biophys. J. 109:1528–1532.
straightforward. GROmars exploits the power of working 10. Michaud-Agrawal, N., E. J. Denning, ., O. Beckstein. 2011.
with densities rather than with atomic positions, and its MDAnalysis: a toolkit for the analysis of molecular dynamics simula-
functionalities revealed important localization details of tions. J. Comput. Chem. 32:2319–2327.
various biomolecular test systems. Therefore, we consider 11. Gowers, R. J., M. Linke, ., O. Beckstein. 2016. MDAnalysis: a Py-
thon package for the rapid analysis of molecular dynamics simula-
this tool to be of high applicability for the analysis of bio- tions. In Proceedings of the 15th Python in Science Conference.
molecular simulations and their comparison with experi- SciPy, pp. 98–105.
mental data. 12. Mercadante, D., F. Gr€ater, and C. Daday. 2018. CONAN: a tool to
GROmars is available at the site https://mptg-cbp.github. decode dynamical information from molecular interaction Maps. Bio-
phys. J. 114:1267–1273.
io/gromaps.html.
13. Allen, W. J., J. A. Lemkul, and D. R. Bevan. 2009. GridMAT-MD: a
grid-based membrane analysis tool for use with molecular dynamics.
J. Comput. Chem. 30:1952–1958.
SUPPORTING MATERIAL
14. Gapsys, V., B. L. de Groot, and R. Briones. 2013. Computational
Supporting Materials and Methods, one figure, and one table are avail- analysis of local membrane properties. J. Comput. Aided Mol. Des.
able at http://www.biophysj.org/biophysj/supplemental/S0006-3495(18) 27:845–858.
34448-5. 15. Cohen, J., A. Arkhipov, ., K. Schulten. 2006. Imaging the migration
pathways for O2, CO, NO, and Xe inside myoglobin. Biophys. J.
91:1844–1857.
AUTHOR CONTRIBUTIONS
16. Gautier, R., A. Bacle, ., B. Antonny. 2018. PackMem: a versatile tool
C.A.-S., R.B., and B.L.d.G. designed research. C.A.-S., C.B., and C.K. im- to compute and visualize interfacial packing defects in lipid bilayers.
Biophys. J. 115:436–444.
plemented the tool. C.A.-S., R.B., and C.K. carried out the tests. All authors
discussed and analyzed the data and wrote the manuscript. 17. Adams, P. D., P. V. Afonine, ., P. H. Zwart. 2010. PHENIX: a compre-
hensive Python-based system for macromolecular structure solution.
Acta Crystallogr. D Biol. Crystallogr. 66:213–221.
18. Winn, M. D., C. C. Ballard, ., K. S. Wilson. 2011. Overview of the
ACKNOWLEDGMENTS CCP4 suite and current developments. Acta Crystallogr. D Biol. Crys-
tallogr. 67:235–242.
We thank Thomas Walz for providing us with the cryo-EC maps of the
DMPC-AQP0 system; Richard Neutze for the x-ray map of the Aqy1 chan- 19. Villa, E., and K. Lasker. 2014. Finding the right fit: chiseling structures
out of cryo-electron microscopy maps. Curr. Opin. Struct. Biol.
nel; Stefan Gahbauer for the CG trajectory of the CXCR4 receptor; and
25:118–125.
Cheng Song for the all-atom trajectory of the dermicidin channel.
20. Kim, D. N., and K. Y. Sanbonmatsu. 2017. Tools for the cryo-EM gold
C.B. acknowledges funding by the Centre of Excellence for Computational rush: going from the cryo-EM map to the atomistic model. Biosci. Rep.
Biomolecular Research, BioExcel CoE, funded by the European Union 37:BSR20170072.
(contract H2020-EINFRA-2015-1-675728). 21. Greengard, L., and J. Lee. 2004. Accelerating the nonuniform fast four-
ier transform. SIAM Rev. 46:443–454.
SUPPORTING CITATIONS 22. Hirai, T., K. Mitsuoka, ., Y. Fujiyoshi. 2007. Simulation of charge ef-
fects on density maps obtained by high-resolution electron crystallog-
References (3,5,22–27,39) appear in the Supporting Material. raphy. J. Electron Microsc. 56:131–140.
23. Briones, R., C. Aponte-Santamarı́a, and B. L. de Groot. 2017. Locali-
zation and ordering of lipids around aquaporin-0: protein and lipid
REFERENCES mobility effects. Front. Physiol. 8:124.
24. Aponte-Santamarı́a, C., G. Fischer, ., B. L. de Groot. 2017. Temper-
1. Dror, R. O., R. M. Dirks, ., D. E. Shaw. 2012. Biomolecular simula- ature dependence of protein-water interactions in a gated yeast aqua-
tion: a computational microscope for molecular biology. Annu. Rev. porin. Sci. Rep. 7:4016.
Biophys. 41:429–452. 25. Pluhackova, K., S. Gahbauer, ., R. A. Böckmann. 2016. Dynamic
2. Humphrey, W., A. Dalke, and K. Schulten. 1996. VMD: visual molec- cholesterol-conditioned dimerization of the G protein coupled chemo-
ular dynamics. J. Mol. Graph. 14:33–38, 27–28.. kine receptor type 4. PLoS Comput. Biol. 12:e1005169.
3. 2015. The PyMOL Molecular Graphics System, Version 1.8: 26. Song, C., C. Weichbrodt, ., K. Zeth. 2013. Crystal structure and func-
Schrödinger, LLC. tional mechanism of a human antimicrobial membrane channel. Proc.
4. Pettersen, E. F., T. D. Goddard, ., T. E. Ferrin. 2004. UCSF Natl. Acad. Sci. USA. 110:4586–4591.
Chimera—a visualization system for exploratory research and analysis. 27. Gonen, T., Y. Cheng, ., T. Walz. 2005. Lipid-protein interactions in
J. Comput. Chem. 25:1605–1612. double-layered two-dimensional AQP0 crystals. Nature. 438:633–638.
Biophysical Journal 116, 1–8, January 8, 2019 7Please cite this article in press as: Briones et al., GROmars: A GROMACS-Based Toolset to Analyze Density Maps Derived from Molecular Dynamics Sim-
ulations, Biophysical Journal (2019), https://doi.org/10.1016/j.bpj.2018.11.3126
Briones et al.
28. Costello, M. J., T. J. McIntosh, and J. D. Robertson. 1989. Distribution 34. Nguyen, D. H., and D. Taub. 2002. CXCR4 function requires
of gap junctions and square array junctions in the mammalian lens. membrane cholesterol: implications for HIV infection. J. Immunol.
Invest. Ophthalmol. Vis. Sci. 30:975–989. 168:4121–4126.
29. Hite, R. K., Z. Li, and T. Walz. 2010. Principles of membrane protein 35. Schittek, B., R. Hipfel, ., C. Garbe. 2001. Dermcidin: a novel human
interactions with annular lipids deduced from aquaporin-0 2D crystals. antibiotic peptide secreted by sweat glands. Nat. Immunol. 2:1133–
EMBO J. 29:1652–1658. 1137.
30. Hite, R. K., P. L. Chiu, ., T. Walz. 2015. Effect of lipid head groups on
double-layered two-dimensional crystals formed by aquaporin-0. PLoS 36. Smart, O. S., J. M. Goodfellow, and B. A. Wallace. 1993. The pore di-
One. 10:e0117371. mensions of gramicidin A. Biophys. J. 65:2455–2460.
31. Aponte-Santamarı́a, C., R. Briones, ., B. L. de Groot. 2012. Molecu- 37. Sehnal, D., R. Svobodová Vareková, ., J. Koca. 2013. MOLE 2.0:
lar driving forces defining lipid positions around aquaporin-0. Proc. advanced approach for analysis of biomacromolecular channels.
Natl. Acad. Sci. USA. 109:9887–9892. J. Cheminform. 5:39.
32. Stansfeld, P. J., E. E. Jefferys, and M. S. Sansom. 2013. Multiscale sim-
ulations reveal conserved patterns of lipid interactions with aquaporins. 38. Brezovsky, J., B. Kozlikova, and J. Damborsky. 2018. Computational
Structure. 21:810–819. analysis of protein tunnels and channels. Methods Mol. Biol.
1685:25–42.
33. Fischer, G., U. Kosinska-Eriksson, ., K. Lindkvist-Petersson. 2009.
Crystal structure of a yeast aquaporin at 1.15 angstrom reveals a novel 39. Gapsys, V., and B. L. de Groot. 2013. Optimal superpositioning of flex-
gating mechanism. PLoS Biol. 7:e1000130. ible molecule ensembles. Biophys. J. 104:196–207.
8 Biophysical Journal 116, 1–8, January 8, 2019You can also read