Single cell RNA sequencing reveals developmental heterogeneity among Plasmodium berghei sporozoites - Nature
←
→
Page content transcription
If your browser does not render page correctly, please read the page content below
www.nature.com/scientificreports
OPEN Single‑cell RNA sequencing reveals
developmental heterogeneity
among Plasmodium berghei
sporozoites
Anthony A. Ruberto1*, Caitlin Bourke2,3, Nicolas Merienne1, Thomas Obadia1,4,
Rogerio Amino1 & Ivo Mueller1,2,3*
In the malaria-causing parasite’s life cycle, Plasmodium sporozoites must travel from the midgut of
a mosquito to the salivary glands before they can infect a mammalian host. However, only a fraction
of sporozoites complete the journey. Since salivary gland invasion is required for transmission of
sporozoites, insights at the molecular level can contribute to strategies for malaria prevention. Recent
advances in single-cell RNA sequencing provide an opportunity to assess sporozoite heterogeneity
at a resolution unattainable by bulk RNA sequencing methods. In this study, we use a droplet-based
single-cell RNA sequencing workflow to analyze the transcriptomes of over 8000 Plasmodium berghei
sporozoites derived from the midguts and salivary glands of Anopheles stephensi mosquitoes.
The detection of known marker genes confirms the successful capture and sequencing of samples
composed of a mixed population of sporozoites. Using data integration, clustering, and trajectory
analyses, we reveal differences in gene expression profiles of individual sporozoites, and identify both
annotated and unannotated markers associated with sporozoite development. Our work highlights
the utility of a high-throughput workflow for the transcriptomic profiling of Plasmodium sporozoites,
and provides new insights into gene usage during the parasite’s development in the mosquito.
Malaria is a burden on global public health with 228 million cases and 405,000 deaths estimated in 20181. The
disease is the result of an infection by a Plasmodium parasite, transmitted via the bite of a female Anopheles
mosquito. In humans, P. falciparum and P. vivax cause most cases of the d isease1. Despite progress in reducing
the global malaria burden, the parasite still poses a major threat to millions of lives2,3.
An attractive target for intervention measures is the parasite in the sporozoite stage of its life cycle. Before
it can infect a mammalian host, a Plasmodium sporozoite must travel from the midgut (MID) of a mosquito
to the salivary gland (SG). Only a fraction of sporozoites, however, complete the journey4. Since SG invasion
is required for transmission of sporozoites to a vertebrate host, insights at the molecular level may help con-
tribute to strategies for malaria prevention. Extensive work has been performed in the phenotypic profiling of
sporozoites, both as they develop in the mosquito and in their journey to the liver5–7. Furthermore, a number
of genome-wide analyses generated from various Plasmodium species using bulk RNA sequencing (RNA-seq)
methods have elucidated important transcriptional profiles of s porozoites8–13.
Recent advances in single-cell RNA-seq (scRNA-seq) methods have prompted new ways of deriving biological
insights unattainable by bulk RNA-seq e fforts14,15. However, the use of scRNA-seq to explore gene expression
patterns across the different Plasmodium parasites is still a nascent area of research16–23. Only two studies17,20 have
previously assessed the transcriptional profiles of MID and SG sporozoites at single-cell resolution.
scRNA-seq requires partitioning and lysis of single cells, conversion of RNA into cDNA, and cDNA ampli-
fication to generate sequencing libraries. There are various methods available to accomplish these tasks, each of
which have their own advantages and d isadvantages24,25. To date, only the plate-based Smart-seq2 t echnology26
has been used to generate Plasmodium sporozoite scRNA-seq d ata17,20. Despite its high gene coverage, the plate-
based nature of the protocol makes detection of rare cell populations difficult due to the considerably fewer cells
1
Department of Parasites and Insect Vectors, Institut Pasteur, Paris, France. 2Division of Population Health and
Immunity, Walter and Eliza Hall Institute of Medical Research, Parkville, VIC, Australia. 3Department of Medical
Biology, University of Melbourne, Melbourne, VIC, Australia. 4Hub de Bioinformatique et Biostatistique –
Département Biologie Computationnelle, Institut Pasteur, 75015 Paris, France. *email: aruberto@pasteur.fr;
mueller@wehi.edu.au
Scientific Reports | (2021) 11:4127 | https://doi.org/10.1038/s41598-021-82914-w 1
Vol.:(0123456789)
www.nature.com/scientificreports/
that can be simultaneously processed. Complementary approaches to low-throughput, plate-based protocols
are high-throughput droplet-based methods27–29. At the cost of coverage, the ability of these methods to capture
hundreds to thousands of cells in a single experiment makes it possible to detect rare cell populations.
The goal of the present study was twofold: first, to test whether a high-throughput droplet-based single-cell
capture platform (10x Genomics) could be used to profile sporozoites at single-cell resolution; and second, to
design a workflow to analyze transcriptomes obtained from thousands of individual sporozoites in order to
expand the limited body of knowledge on sporozoite biology at single-cell resolution.
In what follows, we show that 10x Genomics’ droplet-based single-cell technology is an effective, high-
throughput method for partitioning sporozoites and generating scRNA-seq data. We profile the transcriptomes
of over 8000 P. berghei ANKA sporozoites derived from SGs and MIDs of mosquitoes 21 days after an infectious
blood meal. Then, we identify clusters of sporozoites with varying gene expression profiles that suggest different
developmental states among sporozoites. Last, we use these clusters as inputs for trajectory and gene enrichment
analyses, and offer novel insights into sporozoite biology at single-cell resolution.
Results
Strategy to capture sporozoites and measure gene expression at single‑cell resolution. To
date, there are no reports of Plasmodium sporozoites being individually isolated using droplet-based systems. We
performed scRNA-seq using 10x Genomics’ droplet-based technology, selected for its ability to isolate thousands
anner29. To minimize the risk of sequencing mosquito content,
of cells in a relatively quick and cost-effective m
GFP P. berghei ANKA sporozoites dissected from the MIDs and SGs of An. stephensi mosquitoes were purified
using a density gradient30 (Supplementary Fig. S1a online). Sporozoites from MIDs and SGs were then mixed
together, before they were individually partitioned into reagent-containing microdroplets enabling the genera-
tion of cell-barcoded cDNA libraries. In order to assess the reproducibility of the technology and our workflow,
we sequenced three mixed MID:SG sporozoite libraries derived from two different mosquito feeds (Fig. 1a; Sup-
plementary Fig. S1b online).
Our single-cell libraries (Pb1, Pb2, Pb3) were of high-quality and majority of the reads (average of 59%
across all three replicates (840,936,867/1,427,527,228)) aligned to the P. berghei ANKA genome (PlasmoDB, v46)
(Fig. 1b; Supplementary Fig. S1d,e online). Of the reads aligning to the genome, 41% (341,097,547/840,936,867)
mapped to regions encoding for P. berghei ANKA transcripts (Fig. 1b). After removing low-quality cells, we
obtained transcriptomic profiles of 8,354 sporozoites (Fig. 1c), and detected 1,648 unique genes (~ 31% of the
5,245 known genes in the P. berghei ANKA genome) across all replicates (Fig. 1d). Pseudobulk analysis of the
data revealed robust detection of highly abundant transcripts, with low-abundance transcripts serving as major
contributors to detection variability across the three replicates (Supplementary Table S2 online). We found similar
values across the three replicates upon assessing the median unique molecular identifiers (UMIs) per sporozoite
(Pb1, 329; Pb2, 284; Pb3, 237) and unique transcripts per sporozoite (Pb1, 193; Pb2, 177; Pb3, 153) (Fig. 1e).
After independently assessing the sequenced libraries generated from the three single-cell captures, we inte-
grated the three replicates by first identifying pairwise correspondences of highly variable genes between individ-
ual sporozoites, and then using this information to harmonize the d atasets31,32. Low dimensional representation of
the data, using a Uniform Manifold Approximation and Projection (UMAP), revealed two distinct populations of
sporozoites (Fig. 1f). As depicted in the UMAP, we detected various “up-regulated in infective sporozoite” (UIS)
genes, of which PBANKA_1328000 (Serine/threonine protein phosphatase; UIS2), PBANKA_1400800 (UIS3),
PBANKA_0501200 (Early transcribed membrane protein; UIS4), and PBANKA_1128100 (Phospholipase, UIS10)
were among the most highly expressed (Fig. 1g). We also found genes with known expression in MID sporozoites,
such as PBANKA_0901300 (Membrane-associated erythrocyte binding-like protein) and PBANKA_1306500
(TRAP-like protein; UOS3) (Fig. 1g). These results are twofold: first, they validate our protocol for scRNA-seq
analysis of sporozoites, and second, they show that high-throughput droplet-based scRNA-seq is a feasible
method capable of assessing gene expression in Plasmodium sporozoites.
Unsupervised graph‑based clustering resolves sporozoite heterogeneity. In addition to the
mapping of curated data on UMAP representations, unsupervised clustering is an effective and scalable approach
in identifying cell populations. We performed graph-based clustering using the Leiden algorithm33 to further
profile MID and SG sporozoites. Using a conservative resolution (Supplementary Fig. S2a online), we identi-
fied two distinct clusters, in all likelihood encoding for parasites derived from the two anatomical locations in
the mosquito (Fig. 2a). Loading 7,500 SG sporozoites (Supplementary Fig. S1a online), the number in cluster 1
(7,268) approximates the number of cells we expected to obtain (Fig. 2b; Supplementary Fig. S2b online). Cluster
2, however, comprised 1,086 sporozoites, which was a much lower output than the 3,500 MID sporozoites we
expected (Fig. 2b; Supplementary Fig. S2b online). We attributed this discrepancy to suboptimal processing of
MID sporozoites from the second mosquito feed.
We then assessed global patterns of gene usage and expression in the two clusters alongside metrics obtained
from the Malaria Cell Atlas (MCA)17 (Supplementary Fig. S2c,d online). Both the median number of transcripts
per sporozoite—186 in cluster 1 and 135 in cluster 2—and the median expression per sporozoite—309 in cluster
1 and 207 in cluster 2—varied (Figs. 2c,d). We detected a higher percentage of reads encoding for UIS genes in
SG sporozoites (cluster 1; 16.44%) relative to MID sporozoites (cluster 2; 2.66%) (Figs. 2c,d). The percentage of
reads encoding UIS genes in our SG sporozoites were similar to the P. berghei sporozoite populations from the
MCA (sgSpz 17.74% and bbSpz 19.71%), which indicates that despite differences in the total number of genes
detected and expressed (Fig. 2d), the global assessment of UIS expression is comparable between the two single-
cell capture technologies. Our data corroborate previous reports that SG sporozoites, compared to the parasite’s
other life-stages in the mosquito, have increased expression of UIS genes17,34–37.
Scientific Reports | (2021) 11:4127 | https://doi.org/10.1038/s41598-021-82914-w 2
Vol:.(1234567890)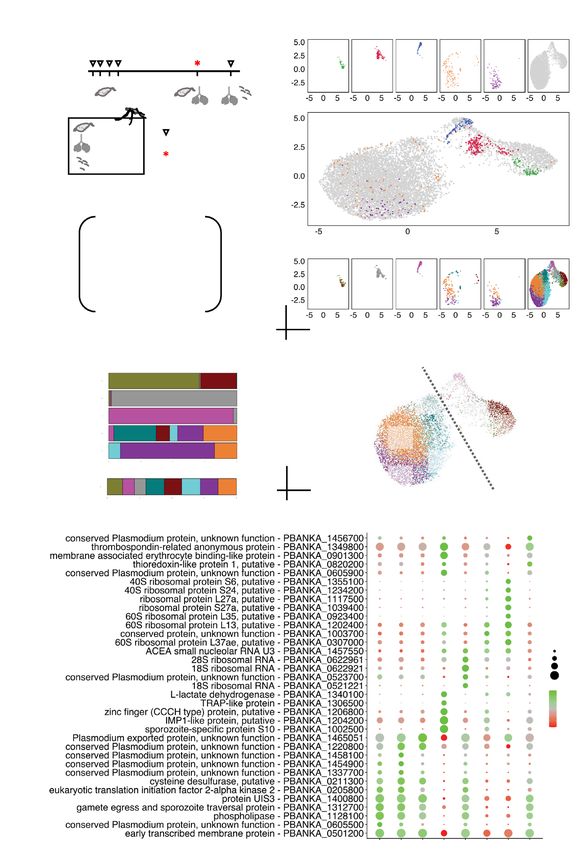
www.nature.com/scientificreports/
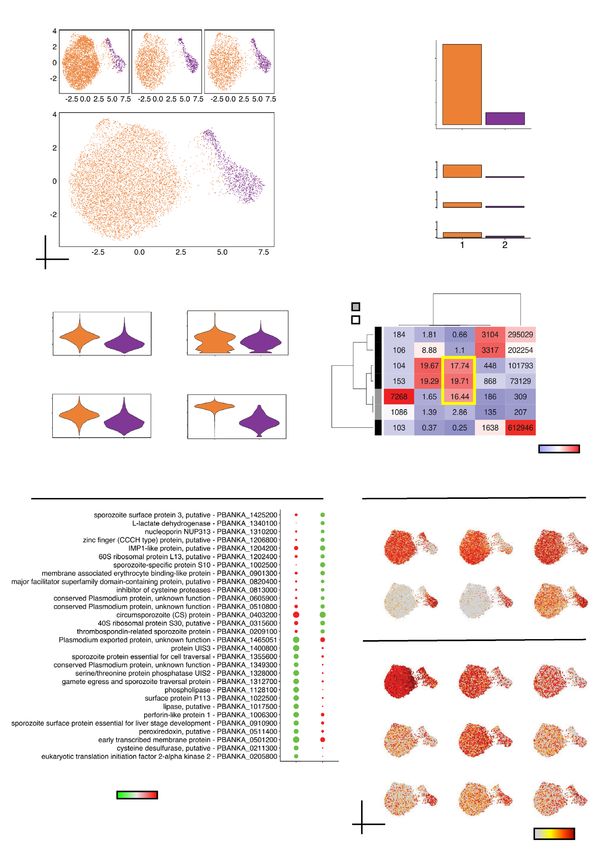
Figure 1. Mapping, quality control, and integration of P. berghei sporozoite 10 × scRNA-seq data. (a) Schematic
illustrating the workflow used for scRNA sequencing of P. berghei sporozoites. (b) Number of P. berghei reads
mapping to the genome (top) and transcriptome (bottom) across the three libraries. (c) Number of sporozoite
transcriptomes analyzed post cell and gene filtering. (d) Number of unique and overlapping transcripts across
the three single-cell library preparations. (e) Violin plots showing the distribution of total UMIs (top) and
unique transcripts (bottom) across each of the three replicates. (f) UMAP representations displaying integrated
scRNA-seq sporozoite datasets individually (top panels) and overlaid (bottom panel). (g) UMAP representations
displaying the expression of UIS markers (left) and MID sporozoite markers (right). See Supplementary Table S1
online for gene descriptions of the first 30 UIS genes.
Scientific Reports | (2021) 11:4127 | https://doi.org/10.1038/s41598-021-82914-w 3
Vol.:(0123456789)
www.nature.com/scientificreports/

          Scientific Reports |   (2021) 11:4127 |   https://doi.org/10.1038/s41598-021-82914-w   4

Vol:.(1234567890)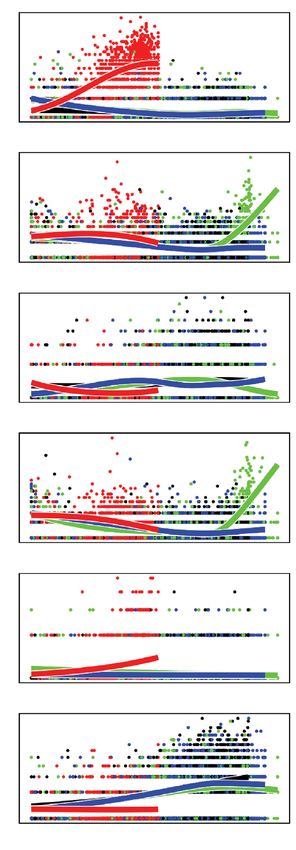
www.nature.com/scientificreports/
◂Figure 2. Unsupervised graph-based clustering of sporozoite 10 × scRNA-seq data. (a) UMAP plots displaying
detected sporozoite populations in individual datasets (top) and overlaid (bottom). Algorithm used to cluster
sporozoites = Leiden; resolution = 0.1. (b) Number of sporozoites in each of the resolved clusters. (c) Violin plots
showing the distribution of total UMIs (top left), unique transcripts (bottom left), percentage rRNA counts
for each sporozoite (top right), and percentage of UIS counts for each sporozoite (bottom right) across each
of the clusters. Percentage was calculated by taking the sum of counts for indicated features belonging to the
cluster divided by the sum for all genes multiplied by 100. (d) Heatmap indicating various metrics associated
with sporozoite populations generated from the current dataset and MCA dataset. Values for cells column
represent the total number of parasites analyzed; for % rRNA, % UIS, genes and expression columns, values
represent median value per cell. (e) Dot plot illustrating top sporozoite markers in clusters 1 and 2. All plotted
genes have an adjusted P value < 0.05; statistical significance was assessed by using Wilcoxon rank-sum test.
See Supplementary Table S2 online for the complete list. (f) UMAP representations displaying top differentially
expressed known (top) and unannotated (bottom) sporozoite markers.
Next, we identified sporozoite markers using the Seurat function findMarkers. We defined a marker as a
transcript detected in greater than 50% of cells, and differentially expressed (adjusted P value < 0.05). Consistent
with its higher percentage of reads encoding for UIS genes, cluster 1 markers included many of the known UIS
genes (Fig. 2e; Supplementary Table S3 online). Other well-described genes encoding for proteins important
for sporozoite functionality, such as PBANKA_1022500 (Surface protein P113), PBANKA_1312700 (Gamete
egress and sporozoite traversal protein) and PBANKA_1355600 (Sporozoite protein essential for cell traversal;
SPECT1), displayed higher expression in this cluster than in cluster 2 (adjusted P value < 0.05; Figs. 2e,f; Sup-
plementary Table S3 online). Of the markers in cluster 2, PBANKA_1002500 (Sporozoite-specific protein S10),
was the most prominent. Previously shown to be upregulated in oocysts38, we detected the transcript in 77%
(836/1,086) of sporozoites in cluster 2, compared to only 13% of sporozoites in cluster 1, in addition to being
differentially expressed (average logFC 3.49; adjusted P value = 1.34 × 10–215) (Figs. 2e,f; Supplementary Table S2
online). Other notable markers identified in cluster 2 were PBANKA_1340100 (L-lactate dehydrogenase) and
PBANKA_1204200 (IMP1-like protein, putative) (Figs. 2e,f; Supplementary Table S3 online). In total, of the 44
differentially expressed genes (DEGs), about 20% (9/44) encoded for genes with unknown function (Figs. 2e,f;
Supplementary Table S3 online), indicating that other markers linked to sporozoite biology may exist.
Integration of mixed sporozoite scRNA‑seq data with Malaria Cell Atlas allows for fine‑tuning
of clusters. Cell annotation in single-cell datasets remains a challenging task, especially for species with
limited or incomplete gene models such as Plasmodium species. A useful strategy for identifying unique cel-
lular states is the integration of data with a single-cell reference atlas. We therefore integrated our sporozoite
scRNA-seq dataset with the MCA’s collection of 650 single-cell transcriptomes of P. berghei parasites harvested
from mosquitoes (Fig. 3a; Supplementary Fig. 3a online). UMAP reduction of the integrated datasets revealed
overlap between the MCA’s day 26 sgSpz and bbSpz and our day 21 SG sporozoites (Fig. 3b, top and middle).
These observed similarities indicate that despite the difference in harvesting time, the transcriptomic profiles of
parasites are similar. A small population of MID sporozoites in our dataset overlapped with the transcriptomic
profiles of ookinetes and oocysts harvested between 18 h and 4 days, but the majority had little in common
with earlier developmental stages of the parasite (Fig. 3b, top and middle). This suggests that MID sporozoites
harvested on day 21 have distinct transcriptional profiles compared to earlier stages of the parasite in this ana-
tomical region of the mosquito.
Next, we used the graph-based clustering approach in Seurat to elucidate gene expression patterns across
the various developmental stages. Unlike our mixed MID-SG sporozoite workflow, where the cellular origin of
each transcriptome needed to be inferred, the plate-based workflow used by Howick and colleagues17 has the
direct advantage of knowing the cellular origin of each transcriptome. Guided by the notion that a cluster should
be composed primarily of parasites from a single-life stage, we used this information to discern a total of eight
clusters present in our P. berghei sporozoite dataset (Figs. 3c,d; Supplementary Fig. S3b online). The majority of
parasites in cluster 3 were day-21 SG sporozoites, while those in cluster 4 were mostly day-21 MID sporozoites
(Figs. 3c,d,e). This suggests that the transcriptomic profiles of parasites at day 21 post-infection (p.i) are distin-
guishable from other developmental time points.
We then identified marker genes using the Seurat function FindAllMarkers, detecting many of the same mark-
ers as found with our aforementioned conservative clustering output (44 genes) (Supplementary Fig. S3c online),
but also an additional 44 markers (Supplementary Fig. S3c online), including PBANKA_1306500 (TRAP-like
protein), PBANKA_0619400 (V-type ATPase V0 subunit e, putative). There was considerable overlap of markers
in clusters 1 and 2 (Fig. 3f; Supplementary Fig. S3d online; Supplementary Table S4 online), as well as modest
changes in gene expression between them (Supplementary Table S5 online), suggesting slight heterogeneity
amongst SG sporozoites at the gene expression level. Our fine-tuning had the largest benefit in resolving clusters
4 and 7, as the majority of their marker genes showed little co-occurrences of marker genes in other clusters
(Supplementary Fig. S3d online).
In sum, the integration of our dataset with the MCA data revealed stage-specific gene expression patterns in
P. berghei parasites as they develop in separate parts of the mosquito. This, in turn, provided us with a unique
opportunity to refine our clustering strategy to resolve sporozoite sub-populations that we were unable to infer
through an unsupervised clustering approach alone.
Scientific Reports | (2021) 11:4127 | https://doi.org/10.1038/s41598-021-82914-w 5
Vol.:(0123456789)www.nature.com/scientificreports/
Figure 3. Redefining sporozoite populations using the Malaria Cell Atlas as a reference. (a) Sampling time points of P. berghei ANKA
parasites at single-cell resolution during its development in the mosquito (top) and schematic illustrating the workflow used to redefine
the clustering resolution for the mixed MID and SG sporozoite scRNA-seq data (bottom). (b) UMAP representations displaying integrated
datasets colored by parasite life-stage individually (top) and overlaid (bottom). (c) UMAP representation displaying integrated datasets
by cluster. (d) Distribution of parasites in each cluster across its different developmental stages. (e) UMAP representation displaying the
redefined clustering of MID and SG sporozoites isolated on day 21 post mosquito infection. Dashed diagonal line represents the predicted
break between SG and MID sporozoites. Algorithm used to cluster: Leiden, resolution = 0.7. (f) Dot plot illustrating top sporozoite markers
in each of the clusters predicted to be composed of sporozoites derived from SGs and MIDs. All plotted genes have adjusted P value < 0.05;
statistical significance was assessed by using Wilcoxon rank-sum test. See Supplementary Table S4 online for the complete list.
Scientific Reports | (2021) 11:4127 | https://doi.org/10.1038/s41598-021-82914-w 6
Vol:.(1234567890)www.nature.com/scientificreports/
Figure 4. Pseudotime analysis of SG and MID sporozoite markers. (a) UMAP representation of SG and
MID sporozoites clusters overlaid with the four principal curves identified using Slingshot to reveal potential
developmental trajectories (lineages). Arrow width represents the relative number of cells in each lineage; length
of arrows represents the length of trajectories for each lineage. (b) Number of DEGs when performing pairwise
tests between each of the lineages. (c) Smoothed expression across the differentiation trajectories in SG and MID
sporozoites for top genes changing across pseudotime. See Supplementary Table S6 for the complete list.
Scientific Reports | (2021) 11:4127 | https://doi.org/10.1038/s41598-021-82914-w 7
Vol.:(0123456789)www.nature.com/scientificreports/
Trajectory analysis reveals gene expression changes associated with sporozoite develop-
ment. One caveat of analyzing a developmental system using a cluster-based classification strategy is that
inclusion thresholds may artificially assign cells to groups when in fact cell transitions may be occurring in a
more continuous manner. The co-occurrence of many marker genes across the eight clusters (Supplementary
Fig. S3d online) suggests that a continuum of sporozoite transcriptional states may exist, as opposed to distinct
states.
To study this further, we sought to identify changes in gene expression across pseudotime. Four developmental
trajectories (lineages) from our MID and SG sporozoites were predicted using Slingshot39 (Fig. 4a). All of them
traversed clusters 7, 6, and 8, suggesting shared gene expression dynamics prior to their divergence. Three out
of the four trajectories terminated in a SG sporozoite population (clusters 2, 3, and 5), with the fourth ending in
cluster 4, previously identified as a MID sporozoite population (Fig. 4a).
Next, we assessed DEGs between the trajectories using t radeSeq40, detecting a total of 661 genes with differen-
tial expression across pseudotime (FDR < 0.05) (Supplementary Table S6 online). The number of DEGs detected
when each of the first three trajectories were compared to the fourth confirmed distinct expression patterns
between SG and MID developmental trajectories (Figs. 4b,c; Supplementary Figs. S4a,b online; Supplementary
Table S6 online). This data reveals variations in gene expression over pseudotime, and indicates that various
developmental trajectories can be detected in sporozoites harvested at a single time point.
Transcriptomic profiles of mature salivary gland and midgut sporozoites encode for different
biological processes. To make sense of the broader landscape of biological functions associated with the
eight sporozoite clusters, we assessed the enrichment of various gene sets from the Gene Ontology (GO) database.
Using the markers identified in each cluster as inputs (Supplementary Table S4 online), we identified 91 gene
sets curated under “biological processes” in the GO database as significantly enriched (adjusted P value < 0.05;
Supplementary Table S7 online). Due to the limited number of marker genes in clusters 5 and 8 (Supplemen-
tary Table S4 online), no enrichment was detected. Clusters 6 and 7 showed enriched pathways associated with
translation (Supplementary Table S7 online). Assessment of gene sets derived from the markers found in clus-
ters 1 and 2 indicated that they were functionally similar (Supplementary Figs. S5a,b online; Supplementary
Table S7 online). They displayed considerable overlap in significantly enriched processes, such as exit from the
host, movement within the host environment, and pathogenesis. Interestingly, cluster 3 exhibited much overlap
with clusters 1 and 2, but was ultimately unique since many processes associated with post-translational modi-
fications were also identified (Supplementary Fig. S5b online; Supplementary Table S7 online). Of the clusters
composed of MID sporozoites, cluster 4 displayed distinct enriched pathways associated with energy production
and locomotion, including ATP hydrolysis-coupled transmembrane transport, cell gliding, and entry into host
(Supplementary Fig. S5b online; Supplementary Table S7 online). While this particular analysis remains limited
due to the high number of uncharacterized genes in the P. berghei ANKA genome; as well as the broad nature
of GO curation of known genes, it further supports heterogeneity amongst SG and MID sporozoites (Fig. 5).
Discussion
To date, scRNA-seq studies on Plasmodium sporozoites have been based on data generated from low-throughput
plate-based methods17,20, and the feasibility and utility of a high-throughput droplet-based scRNA-seq workflow
of Plasmodium sporozoites have not yet been assessed. In this study, we show that 10x Genomics’ droplet-based
scRNA-seq technology can effectively generate libraries for downstream genome-wide transcriptomic analyses
of P. berghei sporozoites. Our analysis corroborates findings from previous transcriptomic studies in P. berghei
sporozoites17,35,37,41 and provides new insights into heterogeneity at this developmental stage of the life-cycle.
Studying sporozoite biology at the molecular level is no easy task: in order to perform -omic analyses,
researchers must obtain sufficiently pure samples to avoid the capture and amplification of mosquito material
during the preparation of sequencing libraries. This requirement holds true for scRNA-seq efforts. We show that
post-mosquito dissection, a discontinuous gradient purification p rocedure30 is effective in meeting the purity
requirements necessary for the generation and sequencing of sporozoite single-cell libraries. Despite using this
protocol and sufficient genome mapping, we found a significant proportion of genome-mapped reads mapping
outside of the P. berghei ANKA transcriptome, particularly in regions adjacent to current gene boundaries. This
is unsurprising, as the 3′ untranslated regions (UTRs) are poorly annotated in the gene models of P. berghei
ANKA. At present, this is one limitation of 3′ poly-A selection single-cell approaches—such as 10x Genomics’
technology—in Plasmodium species (like any other poorly annotated species), as reads mapping to the 3′ UTR
of a transcript may not be assigned and counted. With the increased availability of refined gene models42,43, we
expect these updates to help quantification efforts, which will ultimately provide a clearer picture of gene usage
in Plasmodium parasites.
Droplet-based scRNA-seq studies are often performed in individual replicates (i.e. libraries generated in a
contained workflow), due to both cost and sample limitations, despite the fact that technical variation can affect
preparations. Here, we generated scRNA-seq libraries—the first to benchmark 10x Genomics’ droplet-based
single-cell gene expression technology in Plasmodium sporozoites—from three separate replicates to assess
sensitivity and run-to-run variability of the technology. Overall, we found good reproducibility between the
three sporozoite libraries generated across the two mosquito feeds, with each having similar per-cell metrics. It
is important to keep in mind that the sporozoites assessed in this study were derived from a lab-adapted Plas-
modium parasite model44. Whether these similarities in per-cell metrics can be extrapolated to sporozoites from
field isolates remains to be determined.
In P. berghei, various forms of gene regulatory mechanisms have been shown to occur at key transition stages
of the parasites life c ycle45,46. Here, although its protein levels cannot be inferred, the detection of puf2 transcripts
Scientific Reports | (2021) 11:4127 | https://doi.org/10.1038/s41598-021-82914-w 8
Vol:.(1234567890)www.nature.com/scientificreports/
Figure 5. Enrichment analysis of SG and MID sporozoite markers. GO network analysis of enriched Biological
Processes in sporozoite clusters. For clusters 1 and 2, markers co-occuring in these clusters were used to identify
enriched BPs and the GO network analysis. Markers with an adjusted P value < 0.05 were used for gene set
enrichment analysis. No significant enrichments were detected in cluster 5 and 8 using the current thresholds.
(PBANKA_0719200) and its slightly increased expression in SG populations is consistent with previous reports
highlighting the protein’s role in translational repression of mRNA. Interestingly, recent single-cell transcriptomic
profiling of Plasmodium parasites reveals that relative to other stages of the parasite’s life cycle, the number of
transcripts detected in sporozoites is lower when compared across like t echnologies17,20. The low number of
unique transcripts detected in MID and SG sporozoites in our study is consistent with these reports. Together,
these observations suggest that gene repression may serve as an additional layer of regulation in sporozoites.
Future studies to identify key transcriptional regulators that may be underlying these observations are warranted.
We mixed SG and MID sporozoites within each of our replicates for two reasons: first, so they could be treated
without confounding each other, and second, to test whether data reduction and visualization techniques could
effectively separate sporozoites harvested from two different anatomical sites of a mosquito on the same devel-
opmental day. To distinguish between SG and MID sporozoites, we used previously-reported data indicating a
strong relationship between UIS expression and sporozoite development5,6,34,48. To identify additional markers
linked to sporozoites’ developmental status, we used an unsupervised graph-based clustering approach, assign-
ing sporozoites to a cluster based on their gene expression profiles. One of the major challenges of scRNA-seq
is identifying cell states at a particular level of resolution49. Although unsupervised graph-based clustering does
not rely on a priori information to guide its output, choosing a meaningful resolution remains a challenge. With
this in mind, we started with a conservative clustering resolution that allowed for the comparison of sporozoites
based on the anatomical site that they were harvested from. Differential gene expression analysis between the
two broadly defined MID and SG populations, in turn, allowed for the identification of additional markers linked
to the sporozoites’ anatomical origin. Many of the markers we detected were conserved proteins with unknown
Scientific Reports | (2021) 11:4127 | https://doi.org/10.1038/s41598-021-82914-w 9
Vol.:(0123456789)www.nature.com/scientificreports/
function in P. berghei, suggesting the existence of genes linked to sporozoite infectivity, immunogenicity, and
motility that have yet to be explored.
To fully exploit our single-cell data, and to paint a better picture of the parasites’ development in the mos-
quito, we integrated our dataset with the P. berghei scRNA-seq data from the MCA17. As sporozoites are found
in substantial numbers inside SG of mosquitoes after twelve days post-feeding50, we expected sporozoites har-
vested from the SGs 21 days post-feeding to have somewhat similar transcriptional profiles to those harvested
on day 26. We confirmed this expectation upon observing significant overlap between the two datasets. Parasites
derived from earlier developmental time points (18–48-h ookinetes and day 4 oocysts) were clearly distinguish-
able from our day 21 SG sporozoites. Furthermore, the slight overlap of these earlier stages with our day 21 MID
sporozoites highlights the unique gene usage of sporozoites prior to SG invasion. Interestingly, a portion of the
day-21 SG sporozoites overlapped with the day-26 bbSpz, suggesting that some SG sporozoites have an “activated”
phenotype before their ejection from the mosquito. A similar finding in scRNA-seq data from P. falciparum
SG sporozoites has recently been r eported20. Although the possible activation of parasites during the handling
process cannot be ruled out, these observations may provide clues to the molecular underpinnings associated
with the sporozoite’s location in the S G51 or its capacity to successfully invade its h
ost52,53.
To further assess sporozoite heterogeneity at the transcriptional level, we re-performed the clustering analysis
using the various parasite transcriptomes from the MCA dataset as a guide. Given that the stage of the parasite
was known in the MCA, we reasoned that transcriptomes derived from parasites at the different developmental
time points inside the mosquito should each make up their own cluster. We then re-classified our previously
identified sporozoite clusters, branching out from two clusters to eight, which allowed us to infer subpopulations
of SG and MID sporozoites, as well as to identify additional markers associated with development.
Trajectory analysis is a valuable tool in deciphering genes important in the transition from one cellular state
to the next. Applied to sporozoites, we inferred various developmental paths, and the underlying changes in gene
expression of markers as the sporozoite differentiates. We detected 661 differential expressed genes over pseudo-
time (adjusted P value < 0.05), supporting the notion that sporozoite transitions may occur in a more continuous
manner. Further work is required to better understand the factors that could be involved in shaping these devel-
opmental trajectories, and whether similar patterns exist in sporozoites derived from other Plasmodium species.
To date, only 54% of the genes in P. berghei ANKA are annotated for involvement in a given biological process.
Of the genes that are annotated, many are described using GO terms encoding for broad cellular processes. These
limitations make it difficult to fully appreciate the biological roles of genes, and their interaction in complex
networks in the parasite. Despite these limitations, GO enrichment analysis applied to our dataset allowed for the
identification of functionally related genes in MID and SG sporozoites, and provided a systems-level perspective
of gene regulatory programs across sporozoite populations.
The ability to measure gene expression in thousands of individual sporozoites provides a new means of assess-
ing heterogeneity, and may provide clues to mechanisms underlying mosquito-parasite interactions and parasitic
invasion, whether of the mosquito SG or the mammalian host. Our assessment of day 21 sporozoites from two
anatomical positions in the mosquito provides new insights into the RNA landscapes of mature MID and SG
sporozoites at single-cell resolution. It has been shown previously that as early as day 12, P. berghei sporozoites
begin to enter the SGs of m osquitos50. At day 21, some sporozoites may begin to degenerate. The transcriptomic
signature of a degenerating sporozoite remains unknown and this gap in knowledge may limit the interpretation
of the predicted developmental trajectories presented in this study. Furthermore, given our analysis we cannot
be sure as to why the MID sporozoites still reside in this anatomical location or if they will eventually invade
the SGs. Whether there is a causative link between the transcriptomic states of these MID sporozoites and their
infectivity status is unknown. These uncertainties notwithstanding, our work offers an interesting snapshot of the
transcriptomic states of mature MID sporozoites at day 21 and we hope that our analyses prompt more targeted,
gene-specific studies to better understand the biological significance of these sporozoites.
Future scRNA-seq studies on Plasmodium parasites will benefit from the availability of both high-throughput
droplet-based methods and high-coverage plate-based methods. In addition, as the number of single-cell datasets
grows, researchers will have the opportunity to perform inter-species comparisons to better understand parasite
heterogeneity and gene expression dynamics. We hope that our P. berghei sporozoite scRNA-seq data serves as
a valuable resource for the malaria research community.
Material and methods
Ethics statement. All animal experiments were approved by the Animal Care and Use Committee of Insti-
tut Pasteur (CETEA Institut Pasteur 2013-0093, Ministère de l’Enseignement Supérieur et de la Recherche MESR
01324) and were performed in accordance with European guidelines and regulations (directive 2010/63/EU).
Mice, parasites, mosquitoes, and infections. Female Swiss mice purchased from Javier Labs were
housed under 12 h:12 h light:dark conditions and with ad libitum access to food and water. Mice were inoculated
via intraperitoneal injection with 500µLof rat blood infected with P. berghei ANKA clones expressing GFP, under
the control of the hsp70 regulatory r egions44. On day 3 after infection, parasitemia was determined from the mice
by FACS and blood-smear counting. Anopheles stephensi mosquitoes (SDA500 strain) reared in the Centre for
Production and Infection of Anopheles (CEPIA) at the Institut Pasteur (Paris, France) were fed on infected mice
in the manner described previously54.
Sporozoite isolation. Sporozoites were isolated from MIDs and SGs of An. stephensi 21 days after an infec-
tious blood-meal. Mosquito infectivity was confirmed by the presence of GFP-expressing sporozoites in both
SGs and MIDs (Supplementary Fig. 1a online). MIDs and SGs from infected mosquitoes were dissected under
Scientific Reports | (2021) 11:4127 | https://doi.org/10.1038/s41598-021-82914-w 10
Vol:.(1234567890)www.nature.com/scientificreports/
a stereozoom microscope and placed in separate microcentrifuge tubes containing 50 μL of ice-cold PBS. The
number of dissected mosquitoes was variable depending on the efficiency of sporozoite production. Overall,
between 50 and 80 mosquitoes were dissected for each sample. After the release of sporozoites via manual dis-
ruption, sporozoites were purified using a discontinuous density gradient protocol adapted from Kennedy and
colleagues30. Briefly, 450µL of HBSS containing phenol-red was added to the 50 μL PBS solution containing
sporozoites and mosquito content. Mixtures containing mosquito content and sporozoites were placed on 3 mL
of a 17% Nycodenz (Axis-Shield, Norway) solution and spun at 2500 g for 20 min in a centrifuge pre-chilled to
4 °C with no brake. Next, 300 μL of purified sporozoites were carefully removed from the interface and spun at
top speed in a 4 °C centrifuge for 10 min to pellet the sporozoites. The supernatant was removed to maintain
around 50uL of purified sporozoites. Resuspended sporozoites were then passed through a 20 µm mesh into a
microcentrifuge tube and held on ice until further processing.
Single‑cell library preparation and sequencing. Post purification and counting, SG and MID sporo-
zoites were pooled in either 50:50 or 90:10 SG:MID ratios. From the 50:50 SG:MID sporozoites preparation, we
loaded equal amounts of sporozoites onto two wells of a Chromium Chip B, giving a total of three sporozoite
mixtures derived from two separate mosquito feeds (Supplementary Fig. 1b online). Post gel beads-in-emulsion
(GEM) generation, single-cell libraries were processed according to the 10 × Chromium 3′ v2 User Guide pro-
tocol with some modifications. First, due to the low RNA content of Plasmodium species, following GEM-RT
incubation and cleanup, we used 14 PCR cycles to amplify the full-length cDNA to ensure the generation of
sufficient mass for library construction. Second, during the sample index PCR step, we used 16 cycles. Prepared
single‐cell libraries were sent to Novogene (Hong Kong) or Macrogen (Seoul, South Korea) for sequencing using
an Illumina HiSeq Xten sequencer in stand-alone mode with the following parameters: 26 cycles (read 1), 8
cycles (i7 index), and 98 cycles (read 2).
Alignment, cellular barcode assignment, and gene quantification. Quality of RNA-sequencing
libraries was assessed using FASTQC55. The P. berghei ANKA genome (v46) and its corresponding genomic
features file (GFF) were downloaded from PlasmoDB.org. The GFF was converted to GTF format, then using
the genome and GTF, we generated a genome index in STAR56 (v2.3.7a) using the –runMode genomeGenerate
specifying the following additional parameters: –genomeSAindexNbases 11 –sjdbOverhang 97. Next, we down-
loaded the V2 barcode whitelist from the 10x Genomics’ website. Mapping, demultiplexing and gene quantifica-
tion was performed using STAR’s turnkey solution for analyzing droplet-based scRNA-seq sequencing data by
specifying the following options: –soloType CB_UMI_Simple –soloCBlen 16 –soloUMIlen 12 –soloCBwhitelist
/path/to/10X/V2/whitelist –alignIntronMin 1 –alignIntronMax 2500 –outFilterType BySJout –outFilterIntron-
Motifs RemoveNoncanonical –soloCBmatchWLtype 1MM_multi_pseudocounts –soloUMIfiltering MultiGe-
neUMI –soloUMIdedup 1MM_All –soloFeatures Gene. The alignIntronMin and alignIntronMax parameters
were set based on the minimum and maximum intron lengths of all annotated mRNA transcripts calculated
upon generation of the indexed genome (Supplementary Fig. S5a,b online). The resulting unfiltered (raw)
matrix, features, and barcodes files for each sample were used for further processing in R (version 4.2). A sche-
matic of the workflow and sequencing statistics for each sample is shown in Supplementary Fig. 1c online.
Filtering and normalization. To filter out empty droplets and retain GEMs containing sporozoites, we
used the emptyDrops f unction57 with an FDR cutoff of 0.001. Next, to account for multiple sporozoites captured
in the same droplet, sporozoites with counts greater than 3 deviations from the median (MAD) were removed.
After removing low-quality cells, we removed genes with low detection; keeping genes with greater than two
counts in at least two cells. See Supplementary Table S8 for a full breakdown of loading, alignment, and per-cell
metrics.
Integration of scRNA‑seq libraries. Filtered count matrices from the three replicates (Pb1, Pb2, Pb3)
were transformed into a Seurat (v3.1.0) object and processing was performed using functions coming from the
Seurat package in R. Prior to integration, each dataset was normalized using the LogNormalize function whereby
gene counts for each cell were divided by its total counts and multiplied by a scale factor of 1000. Values were
natural-log transformed using log1p. Highly variable features were identified for each replicate using the Find-
VariableFeatures function with the following parameters provided: selection.method = "vst", nfeatures = (total
transcripts) ✕ 0.2. Next, integration anchors were found using the FindIntegrationAnchors function with the
following parameters: dims = 1:15, anchor.features = 300. Using these anchors, the datasets were integrated using
the IntegrateData function.
Dimension reduction and clustering. Following integration, data was scaled and dimensionality reduc-
tion was performed using principal component analysis (PCA) and UMAP. Next, an unsupervised graph-based
clustering approach was used to identify sporozoite communities. First, k-nearest neighbors were found and a
shared nearest neighbor (SNN) graph was constructed using the Seurat function FindNeighbours with the fol-
lowing parameters: reduction = "pca", dims = 1:15. After the optimization of the SNN modularity, clusters of cells
were identified using Seurat’s FindClusters function with the Leiden a lgorithm33 selected. Clustering outputs
lot58.
were assessed at various resolutions and cluster stability was visualized using a Clustering tree p
Integration of 10x scRNA‑seq data with Malaria Cell Atlas scRNA‑seq data. The MCA’s aligned
and counted dataset was cloned from GitHub (https://github.com/vhowick/MalariaCellAtlas/tree/master/Smart
Scientific Reports | (2021) 11:4127 | https://doi.org/10.1038/s41598-021-82914-w 11
Vol.:(0123456789)www.nature.com/scientificreports/
seq2analysis/PCA_SS2). All 1787 cells across various stages of the P. berghei parasite’s life cycle and associated
gene expression counts were imported into R. We next subsetted the parasites based on their developmental
status, keeping only stages resident in the invertebrate host. Cell and gene filtering were performed in the same
manner described above. The P. berghei sporozoite datasets generated in this study (Pb1, Pb2, Pb3) and subset-
ted MCA dataset were then assembled into an integrated reference using the method described in “Integration
of scRNA-seq libraries”.
Differential gene expression analysis. To detect cluster-specific markers, the Seurat functions FindAll-
Markers or FindMarkers were used. Only transcipts in more than 50% of cells in a cluster were considered. All
logFC values were considered and comparisons with adjusted P values < 0.05 were considered significant.
Trajectory analysis. To resolve sporozoite lineages from the scRNA-seq data, we used the UMAP embed-
dings, clusters (eight), and variable feature counts from our sporozoite dataset after refinement with the MCA, as
input for pseudotime analysis. Lineages and smoothed curves were generated using Slingshot39 with the default
parameters selected. Next, to identify genes with altered expression across pseudotime a negative binomial gen-
eralized additive model (GAM) for each gene was generated using the tradeSeq40 function fitGAM. Based on
the fitted models, we used the tradeSeq function diffEndTest to identify genes that were differentially expressed
between lineages. Briefly, the function performs a global test, with the null hypothesis that the average expres-
sion at the endpoints is equal for all lineages using a multivariate Wald test. In addition to the global testing, we
performed pairwise comparisons between lineages.
Gene set enrichment analysis. Marker genes (adjusted P value < 0.05) predicted from each cluster were
uploaded to PlasmoDB and gene set enrichment analysis was performed using the built-in Gene Ontology tool
with the following parameters indicated: Organism—Plasmodium berghei ANKA; Ontology—Biological Pro-
cess; Evidence—Computed, Curated; Limit to Go Slim terms—No; P-Value cutoff— 0.05. Enriched gene sets
were exported to REVIGO59 to reduce redundant GO terms using the default parameters and with the GO term
database ‘Plasmodium falciparum’ (closest relative to Plasmodium berghei in the database) selected. Resulting
lists were uploaded to Cytoscape60 for graph-based representations of enriched pathways in each cluster.
Data availability
All raw sequencing data have been deposited in the European Nucleotide Archive at European Molecular Biol-
ogy Laboratory European Bioinformatics Institute (www.ebi.ac.uk/ena/) under accession number ERP123892.
Scripts and supporting files are available on GitHub at: https://github.com/AnthonyRuberto/Pb_Spz_singleCell
. Archived scripts and output files as at time of publication are available on Zenodo at https://doi.org/10.5281/
zenodo.4165032
Received: 31 October 2020; Accepted: 27 January 2021
References
1. Organization, W. H. World malaria report 2019. https://www.who.int/publications/i/item/world-malaria-report-2019 (2019).
2. Battle, K. E. et al. Mapping the global endemicity and clinical burden of Plasmodium vivax, 2000–17: a spatial and temporal
modelling study. Lancet 394, 332–343 (2019).
3. Weiss, D. J. et al. Mapping the global prevalence, incidence, and mortality of Plasmodium falciparum, 2000–17: a spatial and
temporal modelling study. Lancet 394, 322–331 (2019).
4. Hillyer, J. F., Barreau, C. & Vernick, K. D. Efficiency of salivary gland invasion by malaria sporozoites is controlled by rapid sporo-
zoite destruction in the mosquito hemocoel. Int. J. Parasitol. 37, 673 (2007).
5. Frischknecht, F. & Matuschewski, K. Plasmodium sporozoite biology. Cold Spring Harb. Perspect. Med. 7, 1–14 (2017).
6. Ghosh, A. K. & Jacobs-Lorena, M. Plasmodium sporozoite invasion of the mosquito salivary gland. Curr. Opin. Microbiol. 12,
394–400 (2009).
7. Kojin, B. B. & Adelman, Z. N. The sporozoite’s journey through the mosquito: a critical examination of host and parasite factors
required for salivary gland invasion. Front. Ecol. Evol. 7, 1–14 (2019).
8. Boonkaew, T. et al. Transcriptome analysis of Anopheles dirus and Plasmodium vivax at ookinete and oocyst stages. Acta Trop.
https://doi.org/10.1016/j.actatropica.2020.105502 (2020).
9. Mueller, I. et al. Transcriptome and histone epigenome of Plasmodium vivax salivary-gland sporozoites point to tight regulatory
control and mechanisms for liver-stage differentiation in relapsing malaria. Int. J. Parasitol. 49, 501–513 (2019).
10. Zanghì, G. et al. A specific PfEMP1 is expressed in P. falciparum sporozoites and plays a role in hepatocyte infection. Cell Rep. 22,
2951–2963 (2018).
11. Gómez-Díaz, E. et al. Epigenetic regulation of Plasmodium falciparum clonally variant gene expression during development in
Anopheles gambiae. Sci. Rep. 7, 1–17 (2017).
12. Lindner, S. E. et al. Total and putative surface proteomics of malaria parasite salivary gland sporozoites. Mol. Cell. Proteom. 12,
1127–1143 (2013).
13. Roth, A. et al. Unraveling the Plasmodium vivax sporozoite transcriptional journey from mosquito vector to human host. Sci. Rep.
8, 12183 (2018).
14. Stark, R., Grzelak, M. & Hadfield, J. RNA sequencing: the teenage years. Nat. Rev. Genet. https: //doi.org/10.1038/s41576 -019-0150-2
(2019).
15. Stuart, T. & Satija, R. Integrative single-cell analysis. Nat. Rev. Genet. 20, 257–272 (2019).
16. Cubi, R. et al. Laser capture microdissection enables transcriptomic analysis of dividing and quiescent liver stages of Plasmodium
relapsing species. Cell. Microbiol. 19, e12735 (2017).
17. Howick, V. M. et al. The Malaria Cell Atlas: single parasite transcriptomes across the complete Plasmodium life cycle. Science 365,
eaaw2619 (2019).
18. Poran, A. et al. Single-cell RNA sequencing reveals a signature of sexual commitment in malaria parasites. Nature 551, 95–99
(2017).
Scientific Reports | (2021) 11:4127 | https://doi.org/10.1038/s41598-021-82914-w 12
Vol:.(1234567890)www.nature.com/scientificreports/
19. Rawat, M., Srivastava, A., Gupta, I. & Karmodiya, K. Single Cell RNA-sequencing reveals cellular heterogeneity, stage transition
and antigenic variation during stress adaptation in synchronized Plasmodium falciparum. bioRxiv https://doi.org/10.1101/75254
3 (2019).
20. Real, E. et al. A single-cell atlas of Plasmodium falciparum transmission through the mosquito. bioRxiv https: //doi.
org/10.1101/2020.10.11.333179 (2020).
21. Reid, A. J. et al. Single-cell RNA-seq reveals hidden transcriptional variation in malaria parasites. Elife 7, e33105 (2018).
22. Sà, J. M., Cannon, M. V., Caleon, R. L., Wellems, T. E. & Serre, D. Single-cell transcription analysis of Plasmodium vivax blood-
stage parasites identifies stage- and species-specific profiles of expression. PLOS Biol. 18, e3000711 (2020).
23. Walzer, K. A., Fradin, H., Emerson, L. Y., Corcoran, D. L. & Chi, J. T. Latent transcriptional variations of individual Plasmodium
falciparum uncovered by single-cell RNA-seq and fluorescence imaging. PLoS Genet. 15, e1008506 (2019).
24. Ding, J. et al. Systematic comparison of single-cell and single-nucleus RNA-sequencing methods. Nat. Biotechnol. 38, 737–746
(2020).
25. Ziegenhain, C. et al. Comparative analysis of single-cell RNA sequencing methods. Mol. Cell 65, 631-643.e4 (2017).
26. Picelli, S. et al. Smart-seq2 for sensitive full-length transcriptome profiling in single cells. Nat. Methods 10, 1096–1100 (2013).
27. Klein, A. M. et al. Droplet barcoding for single-cell transcriptomics applied to embryonic stem cells. Cell 161, 1187–1201 (2015).
28. Macosko, E. Z. et al. Highly parallel genome-wide expression profiling of individual cells using nanoliter droplets. Cell 161,
1202–1214 (2015).
29. Zheng, G. X. Y. et al. Massively parallel digital transcriptional profiling of single cells. Nat. Commun. 8, 14049 (2017).
30. Kennedy, M. et al. A rapid and scalable density gradient purification method for Plasmodium sporozoites. Malar. J. 11, 421 (2012).
31. Butler, A., Hoffman, P., Smibert, P., Papalexi, E. & Satija, R. Integrating single-cell transcriptomic data across different conditions,
technologies, and species. Nat. Biotechnol. 36, 411–420 (2018).
32. Stuart, T. et al. Comprehensive integration of single-cell data. Cell 177, 1888-1902.e21 (2019).
33. Traag, V. A., Waltman, L. & van Eck, N. J. From Louvain to Leiden: guaranteeing well-connected communities. Sci. Rep. 9, 1–12
(2019).
34. Kappe, S. H. et al. Exploring the transcriptome of the malaria sporozoite stage. Proc. Natl. Acad. Sci. USA 98, 9895–9900 (2001).
35. Matuschewski, K. et al. Infectivity-associated changes in the transcriptional repertoire of the malaria parasite sporozoite stage. J.
Biol. Chem. 277, 41948–41953 (2002).
36. Mikolajczak, S. A. et al. Distinct malaria parasite sporozoites reveal transcriptional changes that cause differential tissue infection
competence in the mosquito vector and mammalian host. Mol. Cell. Biol. 28, 6196–6207 (2008).
37. Rosinski-Chupin, I. et al. Serial analysis of gene expression in Plasmodium berghei salivary gland sporozoites. BMC Genom. 8, 466
(2007).
38. Togiri, J. et al. Plasmodium berghei sporozoite specific genes-PbS10 and PbS23/SSP3 are required for the development of exo-
erythrocytic forms. Mol. Biochem. Parasitol. 232, 111198 (2019).
39. Street, K. et al. Slingshot: cell lineage and pseudotime inference for single-cell transcriptomics. BMC Genom. 19, 477 (2018).
40. Van den Berge, K. et al. Trajectory-based differential expression analysis for single-cell sequencing data. Nat. Commun. 11, 1–13
(2020).
41. Caldelari, R. et al. Transcriptome analysis of Plasmodium berghei during exo-erythrocytic development. Malar. J. 18, 330 (2019).
42. Chappell, L. et al. Refining the transcriptome of the human malaria parasite Plasmodium falciparum using amplification-free
RNA-seq. BMC Genom. 21, 395 (2020).
43. Siegel, S. V. et al. Analysis of Plasmodium vivax schizont transcriptomes from field isolates reveals heterogeneity of expression of
genes involved in host-parasite interactions. Sci. Rep. 10, 16667 (2020).
44. Ishino, T., Orito, Y., Chinzei, Y. & Yuda, M. A calcium-dependent protein kinase regulates Plasmodium ookinete access to the
midgut epithelial cell. Mol. Microbiol. 59, 1175–1184 (2006).
45. Zhang, M. et al. The Plasmodium eukaryotic initiation factor-2α kinase IK2 controls the latency of sporozoites in the mosquito
salivary glands. J. Exp. Med. 207, 1465–1474 (2010).
46. Zhang, M. et al. PK4, a eukaryotic initiation factor 2α(eIF2α) kinase, is essential for the development of the erythrocytic cycle of
Plasmodium. Proc. Natl. Acad. Sci. USA 109, 3956–3961 (2012).
47. Yuda, M., Iwanaga, S., Kaneko, I. & Kato, T. Global transcriptional repression: an initial and essential step for Plasmodium sexual
development. Proc. Natl. Acad. Sci. USA 112, 12824–12829 (2015).
48. Aly, A. S. I., Vaughan, A. M. & Kappe, S. H. I. Malaria parasite development in the mosquito and infection of the mammalian host.
Annu. Rev. Microbiol. 63, 195–221 (2009).
49. Lähnemann, D. et al. Eleven grand challenges in single-cell data science. Genome Biol. 21, 53 (2020).
50. Vanderberg, J. P. Development of Infectivity by the Plasmodium berghei sporozoite. J. Parasitol. 61, 43–50 (1975).
51. Wells, M. B. & Andrew, D. J. Anopheles salivary gland architecture shapes Plasmodium sporozoite availability for transmission.
MBio 10, e01238-19 (2019).
52. Prudêncio, M., Rodrigues, C. D., Ataíde, R. & Mota, M. M. Dissecting in vitro host cell infection by Plasmodium sporozoites using
flow cytometry. Cell. Microbiol. 10, 218–224 (2008).
53. Risco-Castillo, V. et al. Malaria sporozoites traverse host cells within transient vacuoles. Cell Host Microbe 18, 593–603 (2015).
54. Amino, R. et al. Imaging malaria sporozoites in the dermis of the mammalian host. Nat. Protoc. 2, 1705–1712 (2007).
55. Andrews, S. FastQC: a quality control tool for high throughput sequence data. http://www.bioinformatics.babraham.ac.uk/proje
cts/fastqc (2010).
56. Dobin, A. et al. STAR: ultrafast universal RNA-seq aligner. Bioinformatics 29, 15–21 (2013).
57. Lun, A. T. L. et al. EmptyDrops: distinguishing cells from empty droplets in droplet-based single-cell RNA sequencing data. Genome
Biol. 20, 63 (2019).
58. Zappia, L. & Oshlack, A. Clustering trees: a visualization for evaluating clusterings at multiple resolutions. Gigascience 7, giy083
(2018).
59. Supek, F., Bošnjak, M., Škunca, N. & Šmuc, T. REVIGO summarizes and visualizes long lists of gene ontology terms. PLoS ONE
6, e21800 (2011).
60. Shannon, P. et al. Cytoscape: a software environment for integrated models of biomolecular interaction networks. Genome Res.
13, 2498–2504 (2003).
Acknowledgements
We thank the team of the CEPIA at the Institut Pasteur for providing mosquitoes and P. berghei ANKA sporozo-
ites, and Soffia Gunnarsdottir for proofreading the manuscript. This work was supported by the Agence Nationale
de la Recherche (ANR-17-CE13-0025 to A.A.R); the National Health and Medical Research Council of Australia
(NHMRC; 1092789 and 1134989 to I.M.); and a NHMRC Principal Research Fellowship (1155075 to I.M).
Scientific Reports | (2021) 11:4127 | https://doi.org/10.1038/s41598-021-82914-w 13
Vol.:(0123456789)www.nature.com/scientificreports/
Author contributions
N.M and I.M conceived and designed the study. A.A.R, C.B. and N.M performed the experiments. A.A.R and
C.B performed the computational analysis of data. A.A.R., C.B, T.O, R.A and I.M analysed the data. A.A.R wrote
the manuscript with contributions from other authors. R.A and I.M acquired funding. All authors reviewed and
approved the final version of the manuscript.
Competing interests
The authors declare no competing interests.
Additional information
Supplementary Information The online version contains supplementary material available at https://doi.
org/10.1038/s41598-021-82914-w.
Correspondence and requests for materials should be addressed to A.A.R. or I.M.
Reprints and permissions information is available at www.nature.com/reprints.
Publisher’s note Springer Nature remains neutral with regard to jurisdictional claims in published maps and
institutional affiliations.
Open Access This article is licensed under a Creative Commons Attribution 4.0 International
License, which permits use, sharing, adaptation, distribution and reproduction in any medium or
format, as long as you give appropriate credit to the original author(s) and the source, provide a link to the
Creative Commons licence, and indicate if changes were made. The images or other third party material in this
article are included in the article’s Creative Commons licence, unless indicated otherwise in a credit line to the
material. If material is not included in the article’s Creative Commons licence and your intended use is not
permitted by statutory regulation or exceeds the permitted use, you will need to obtain permission directly from
the copyright holder. To view a copy of this licence, visit http://creativecommons.org/licenses/by/4.0/.
© The Author(s) 2021
Scientific Reports | (2021) 11:4127 | https://doi.org/10.1038/s41598-021-82914-w 14
Vol:.(1234567890)You can also read