Asynchronous multi decadal time scale series of biotic and abiotic responses to precipitation during the last 1300 years - Nature
←
→
Page content transcription
If your browser does not render page correctly, please read the page content below
www.nature.com/scientificreports
OPEN Asynchronous multi‑decadal
time‑scale series of biotic
and abiotic responses
to precipitation during the last
1300 years
Sangheon Yi1,2*, Chang‑Pyo Jun1*, Kyoung‑nam Jo3, Hoil Lee1, Min‑Seok Kim1,
Sang Deuk Lee4, Xianyong Cao5,6 & Jaesoo Lim1
East Asian summer monsoon (EASM)-driven rapid hydroclimatic variation is a crucial factor with
major socioeconomic impacts. Nevertheless, decadal- to centennial-scale EASM variability over the
last two millennia is still poorly understood. Pollen-based quantitative annual precipitation (PqPann)
and annual precipitation reconstructed by artificial neural networks (ANNs) for the period 650–1940
CE were reconstructed from a paleo-reservoir in South Korea. ANNs reconstruction was performed to
compensate for a hiatus section. On a decadal timescale, 10 high-precipitation periods were identified,
and PqPann and ANNs reconstructions were comparable to local instrumental rainfall and historic
drought records. Biotic lags to rapid climatic changes ranging from 25 to 100 years were recognized
by asynchronous pollen and speleothem responses to precipitation. We suggest that PqPann-based
decadal- to centennial-scale climatic change reconstruction should take biotic lags into account,
although the lags can be ignored on the millennial scale. The position of the EASM rainband influenced
rainfall magnitude.
Abrupt climatic changes, including extreme events, accompanying global warming over the last two millennia
(e.g., Ljungqvist1) are important, as such events directly affect human life. As an area strongly influenced by the
East Asian monsoon system, northeast Asian is characterized by considerable precipitation variability, which
leads to frequent dry and wet periods and severe droughts and floods that have major socioeconomic impacts
due to their effects on agriculture, etc. The position of the rainband of the East Asian summer monsoon (EASM)
is critical to the rapid hydroclimatic variability, which has important effects on society; for example, the collapses
of historical Korean and Chinese dynasties was linked to extreme climate e vents2–8.
As the Korean Peninsula (KP), which is located on the East Eurasian continental margin facing the Western
Pacific Ocean, is simultaneously affected by both terrestrial and oceanic environmental factors, it has a history
of more dynamic climate oscillations than China and J apan9–14. Therefore, the KP is an ideal site for studies of
East Asian monsoon system activity in East Asia. Due to high and continuous sedimentation and climatic sen-
sitivity, lake (reservoir) sediments and speleothems provide a record of multi decadal- to centennial-scale East
Asian monsoon system changes. However, few investigations of lake sediments have dealt with geoecological
environmental responses to rapid climatic changes during the mid- to late Holocene in the K P15–18.
We obtained the GG-19–2-1 sediment core from the Gonggeom-ji paleo-reservoir, which was embanked
during the Unified Silla dynasty (ca. 700 CE) for flood control and to provide irrigation for rice c ultivation19.
Age-controlled lithological analysis assumed that the paleo-reservoir was initially formed as a fluvial floodplain
at around 2230 cal yr BP, subsequently changing to a reservoir with a high sedimentation rate (2–8 mm/yr) at
about 1500 cal yr BP.
1
Korea Institute of Geoscience and Mineral Resources, Daejeon 34132, Korea. 2Korea University of Science and
Technology (UST), Daejeon 34113, Korea. 3Kangwon National University, Chuncheon 24341, Korea. 4Nakdonggang
National Institute of Biological Resources, Sangju 37242, Korea. 5Key Laboratory of Alpine Ecolgoy, Institute of
Tibetan Plateau Research, Beijing, China. 6CAS Center for Excellence in Tibetan Plateau Earth Sciences, Chinese
Academy of Sciences (CAS), Beijing 100101, China. *email: shyi@kigam.re.kr; cpjun@kigam.re.kr
Scientific Reports | (2020) 10:17814 | https://doi.org/10.1038/s41598-020-74994-x 1
Vol.:(0123456789)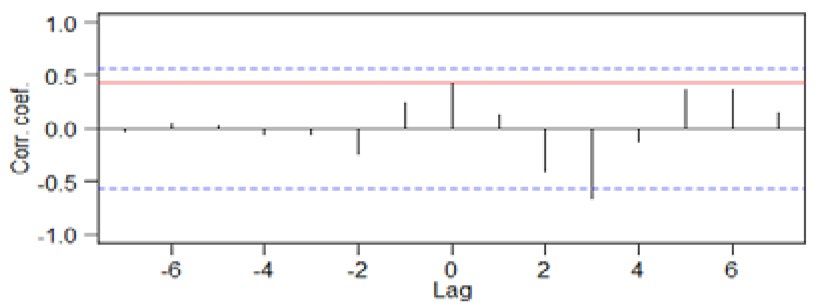
www.nature.com/scientificreports/
Pollen analysis was carried out to estimate pollen-based quantitative annual precipitation (PqPann) over the
last 1300 years (650–1940 CE). However, we found that the GG19-2–1 core has a hiatus, with records missing for
the 660 years from 980 to 1650 CE. Until now, if a hiatus was present in a sediment succession, it was impossible
to reconstruct the paleoenvironment for the corresponding period. To overcome the lack of information, for the
first time, we used a machine-learning method (artificial neural networks, ANNs), and a well-established and age-
controlled high-resolution pollen dataset, to reconstruct the quantitative annual precipitation (Pann) during the
period 980–1650 CE. Changes in precipitation on the KP over the past 1300 years were reconstructed, including
through pollen analysis and covering the hiatus period. When the same statistical technique was applied to the
reconstructed pollen-based precipitation and δ18O of speleothem data, we found time-series lags between biotic
and abiotic responses to rainfall, although they showed similar fluctuation trends. The time-series lags differed
between the Medieval Warm Period (MWP) and Little Ice Age (LIA). As no studies on this topic have been
published, we discuss the new findings from a geoecological viewpoint. Finally, the reconstructed precipitation
data suggested that the magnitude of rainfall differed depending on the location of the EASM rainband over the
past 1300 years in Northeast Asia.
Results
In general, the pollen assemblage over the past 1300 years (Supplementary Figure S2) reflects a mixed forest
of conifers and broadleaf deciduous trees dominated by pine (Pinus), oak (Quercus), and apricot (Prunus) in
a mountainous area with an understory of ferns. In addition, herbs, including grasses (Poaceae) and sedges
(Cyperaceae) associated with riparian willow (Salix), alder (Alnus), and smartweed (Persicaria), grew in lowland
areas and along streams. Mountainous trees and shrubs were predominant over the last 1300 years, although the
relative proportions of dominant taxa changed over time. The concentration (pollen grains per unit of sediment
volume) of the palynoflora increased suddenly at a hiatus depth of 3.5 m, which is the boundary of the local
pollen assemblage zone of GG19-III and GG19-IV.
Comparison of Pann and independent data (calculated with 100-year Butterworth low-pass filtering to match
the time resolution of dry–wet periods), shown in Figs. 1, 2, indicates that the dry–wet periods could provide
a reasonable representation of precipitation change for the calibrated period. The lag times between Pann and
the oxygen isotope data were 17.26 years during the MWP and 94.06 years during the LIA (Supplementary
Figure S3b, c).
PqPann reconstruction was performed for the periods 1940–1666 and 968–658 CE, which are separated by
the hiatus (Supplementary Figure S1). The average PqPann was 1,222 mm/yr (range: 655–1,530 mm/yr) during
the period 1940–1666 CE, and 1304 mm/yr (range: 770–1,454 mm/yr) during the period 968–658 CE (Fig. 2a,
b). The ANNs was used to estimate the Pann for the hiatus period 1650–983 CE, for which pollen data are not
available (Fig. 2c). The reconstructed Pann averaged 1,290 mm/yr (range: 670–1,580 mm/yr). The PqPann- and
ANNs-reconstructed datasets had similar amplitudes, ranging from 655 to 1,580 mm/yr. PqPann data were
verified by comparison with old (Chukwooki; 1777–1910 CE) and modern (1908–1995 CE) rain gauge d ata20,21,
and with the drought frequency in the annals of the Joseon Dynasty (1400–1890 CE)8 (Fig. 2a). The relative sand
contents (%) of KL-2922 were used as input variables to estimate the ANNs data and we found good matches
(Fig. 2b). Subsequently, a 100-year Butterworth low-pass filter was applied for PqPann (Fig. 2c) and was corre-
lated with that of the δ18O (‰) of BN-1 of Baengnyeong Cave9, revealing biotic lag ranging from 25 to 100 years
(Figs. 2d, 3, and Supplementary Figure S3). With Butterworth low-pass filtering, our data were comparable to
those for Lakes Songji18 and Hwajinpo16, with the exception of a few periods (e.g., 1150–990 CE in Fig. 2e and
1290–1190 CE in Fig. 2f).
Discussion and conclusions
PqPann and ANNs reconstruction and influencing factors. Over the last decade, PqPann recon-
struction has been performed for East A sia23–31. The reconstructed dataset suggests that centennial- to millen-
nial-scale dry–wet fluctuations are linked to the variability in the EASM and north–southward migration of the
westerly jet stream (WJ) that was teleconnected to the Atlantic Meridional Overturning Circulation during the
Holocene.
As an area strongly influenced by the East Asian monsoon system, the KP has characteristically high precipi-
tation variability, leading to higher frequencies and amplitudes of dry and wet p eriods20, and severe, persistent
8
droughts and floods, described in historical documents (Fig. 2). PqPann and ANNs reconstruction for the
period 650–1940 CE in South Korea included 10 centennial-scale wet epochs (light gray bars in Fig. 4a), with
multi-decadal dry/wet fluctuations within each epoch (Fig. 4b). The variability and trend of the PqPann and
ANNs reconstruction of South Korea (GG19-2–1 and SOJ-218) are comparable to those of northeast China (Lakes
Jingpo32 and S ilhailongwan27), but the Korean PqPann amplitudes (655–1530 mm/yr) are higher than those in
China (644–949 mm/yr) (Fig. 4a), despite the almost equivalent rainfall duration (Fig. 4b).
The discrepancy in rainfall intensity between the two regions may be due to the difference in distance from
the EASM rainband. According to Herzschuh et al.31, the EASM rainband that influenced the intensity and
amount of precipitation during the late Holocene was located in southeastern China (Fig. 1). Therefore, the KP
is much closer to the EASM rainband than is northeast China, so the KP is highly affected by rainfall forcing of
the EASM rainband. In comparison with BN-19 of South Korea, δ18O of H C33 for southeastern China had small
values, but a higher amplitude (Fig. 4c, d), indicating greater rainfall intensity in southeastern China due to its
location within the EASM rainband area (Fig. 1).
Gradual weakening of EASM intensity was detected from the mid to late H olocene34, corresponding to a
35
decrease in Northern Hemisphere summer insolation and enhanced El Niño–Southern Oscillation (ENSO)
activity14,36–38. However, the solar forcing29 and ENSO-driven hydroclimatic variability18,39 during the late
Scientific Reports | (2020) 10:17814 | https://doi.org/10.1038/s41598-020-74994-x 2
Vol:.(1234567890)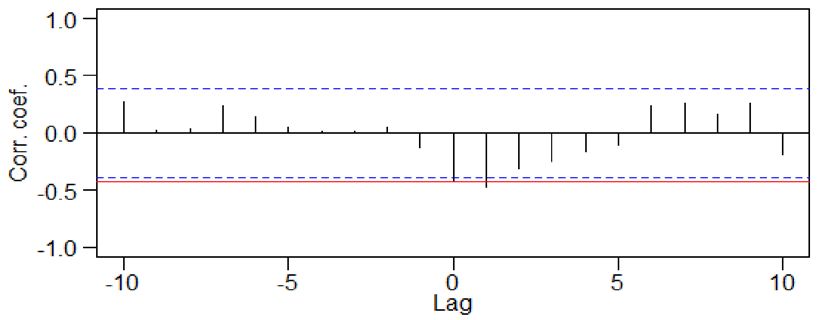
www.nature.com/scientificreports/
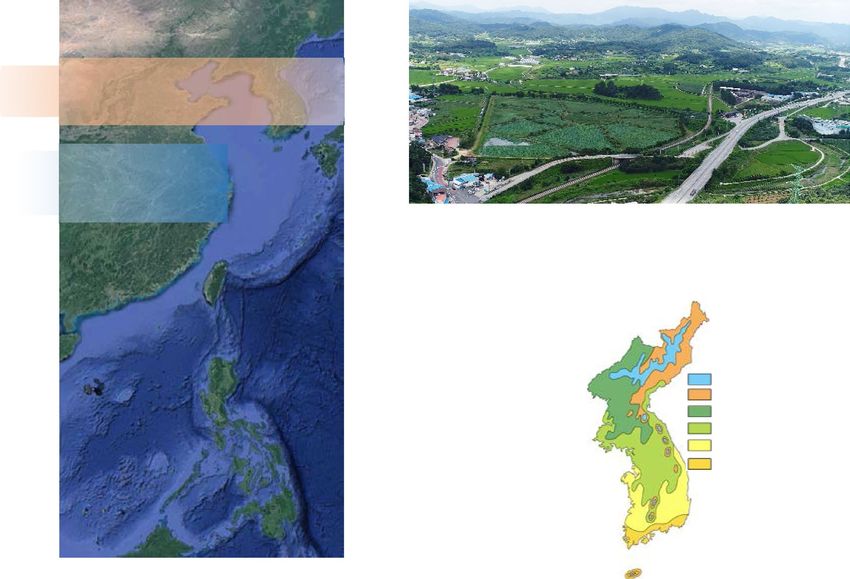
Figure 1. (a) Locations of the GG19-2–1 core site and other sites cited in the text: Hw12-A (Hwajinpo) and
SOJ-2 (Songji) lakes, and BN-2 (Baeg-nyeong) cave, South Korea; SL (Silhailongwan) and JL (Jingpo) lakes,
northeast China, and HE (Heshang) cave, central China; and MD81 in the western tropical Pacific. These maps
were created using Generic Mapping Tools (v.5.4.4, https://www.generic-mapping-tools.org/download/). The
dashed line indicates the northernmost extent of the Asian summer monsoon. Position and orientation of the
rainband and westerly jet (WJ) stream during the Late Holocene are from Herzschuh et al.31 Arrowed grey
parallel lines represent the general direction and width of the WJ stream. (b) Aerial photograph of Gonggeom-ji
showing the location of the GG19-2–1 core site. (c) Seasonal changes (2002–2019 CE) in temperature and
precipitation in the Sangju area, where the Gonggeom-ji paleo-reservoir is located, based on information from
the Korea Meteorological Administration (https://data.kma.go.kr). (d) The study area belongs to the central
temperate zone of the deciduous broadleaf forest based on the modern vegetation map of Korea (modified from
Yim and Kira69) (drawn using CorelDRAW Graphics Suite X7). DBL F., deciduous broadleaved forest.
Holocene increased the precipitation intensity over the KP, which is located on the East Asian coast. The atmos-
pheric (continental setting) and oceanic (East Asian coast) forcings influencing the multi-centennial dry and
wet epochs are recorded in GG19-2–1 (Figs. 4e,f,g).
Biotic lags in response to rapid climate changes. The biotic responses to rapid climate change on a
geological timescale around the North Atlantic have been investigated at an intermediate temporal s cale40–46.
Williams et al.40 reported that vegetation changes took place < 100 years after the climatic oscillation, together
with major climatic changes. Based on pollen and plant macrofossil data plus oxygen isotope data, Yu41 also
provided evidence for replacement of spruce forest by pine within ~ 100 years of the beginning of the Holocene
warming. These studies documented a response of the plant population to climate change on an intermediate
temporal scale that was more gradual than the immediate individual (phenology) response to recent warming47.
Meanwhile, Post40 argued that the responses of plant communities to climate change are as fast as, or even faster
than, the responses predicted by the stochastic forest gap models of Lischke et al.48, and that the plant population
shifts in response to climatic oscillation on the order of decades are equally important in biomes.
The time series of the PqPann GG19-2–1 and δ18O data for BN-19 were compared using 100-year Butterworth
low-pass filtering and cross-correlation analysis. Remarkably, the medians of the most highly significant cross-
correlations between the two datasets revealed similar variability, with lags of 25–50 and 50–100 years during
the MWP and LIA, respectively (Fig. 3).
In general, the PqPann fluctuations matched temperature anomaly fluctuations in northeast China7 (Fig. 4a,
f), whereas the time-series variability data of δ18O for BN-1 was comparable to the time series solar i rradiance49
Scientific Reports | (2020) 10:17814 | https://doi.org/10.1038/s41598-020-74994-x 3
Vol.:(0123456789)www.nature.com/scientificreports/
Figure 2. Pollen-based quantitative annual precipitation (PqPann) and artificial neural networks (ANNs) Pann
reconstruction from 650 to 1950 CE and their verification by comparison with the Korean proxy results of
the relative sand contents (%) of KL-2922, oxygen isotopes (δ18O ‰ VPDB) of Baeg-nyeong Cave (BN-1)9, the
foraminifera index16, old (Chukwooki; 1777–1910) and modern (1908–1995) rain gauge data20,21, and drought
records from the annals of the Joseon Dynasty8. (a) PqPann (light gray line), old rain gauge data (green line),
and frequency of droughts (black dotted line). The red dotted line indicates the average PqPann. (b) PqPann
(mm) and sand contents (%) of KL-29. (c) PqPann (light gray line), Pann of KL-29 (dark blue line), and 100-
year low-pass-filtered (L-P-F) data (dark brown line) of ANNs. The red dotted line indicates the average ANNs.
(d) L-P-F at 100 years ANNs precipitation (mm) of the GG19-2–1 sediment core (dark brown line) and oxygen
isotope (δ18O ‰ VPDB) of BN-1 (blue line) showing a lag time of ca. 25–100 years. (e) L-P-F at 100 years
PqPann comparison between the northeast coast, Songji Lake18, and inland (GG19-2–1, this study) region of the
KP. (f) L-P-F at 100 years ANNs and the foraminifera Trochammina hadai from Hwajinpo Lake (drawn using
CorelDRAW Graphics Suite X7).
Scientific Reports | (2020) 10:17814 | https://doi.org/10.1038/s41598-020-74994-x 4
Vol:.(1234567890)www.nature.com/scientificreports/
Figure 3. Comparison of 100-year L-P-F values between the ANNs (mm) and BN-1 (δ18O ‰ VPDB) during
the period 650–1950 CE. Peaks of BN-1 are about 25–100 years ahead of those of PqPann. Cross-correlation
results show that lag times of LIA (94.06 yr) are longer than those of MWP (17.26 yr). The red lines represent the
correlation coefficient for lag 0. Correlation coefficients outside the dashed blue lines are significant at P = 0.05.
Amplitudes from Pann of ANNs and oxygen isotope of BN-1 during the LIA are generally higher than during
the MWP in the KP. LIA, Little Ice Age; MWP, Medieval Warm Period; DACP, Dark Age Cold Period (drawn
using CorelDRAW Graphics Suite X7).
and sunspot number50 data (Fig. 4e), resulting in BN-1 leads with lags in the variation of PqPann. The 10 peaks
of PqPann (Fig. 4a) always followed those of BN-1 (Fig. 4c) during the period 650–1940 CE in South Korea,
because shifts in plant community responses to abrupt climate changes occurred during multi-decadal dry and
wet epochs40,44. The response times of plant communities are also dependent on temperature, with warmer and
colder periods associated with faster and slower responses, respectively.
We only used pollen data derived from trees and shrubs (arboreal pollen, AP) to reconstruct precipitation,
because trees and shrubs are sensitive to climate change, whereas grasses (non-arboreal pollen, NAP) are gener-
ally climate-tolerant. In Korea, mountain areas have been used for slash-and-burn agriculture to secure fields for
cultivation51,52. In mountain areas, the forests are mainly trees and shrubs, and are influenced by human interfer-
ence, changes in the spectrum of AP, and enhanced surface soil erosion, which all increase the sedimentation
rate53. By contrast, in the study area, riverine herbs and aquatic and cultivated grasses occupied the lowlands
and paleo-reservoir (paleo-wetland). In addition, at the time of the analysis, the study area was mainly used for
rice paddy farming54. Therefore, we inferred that the trees and shrubs used to reconstruct precipitation were
relatively unaffected by human activities; therefore, the trees and shrubs likely responded to changes in the natural
environment. Ammann et al.55 reported that the individual responses of plant species to climatic changes may
reflect processes in individuals (e.g., productivity and phenology) and populations (e.g., population dynamics), as
well as spatial distributions (e.g., migrations). Our pollen data suggested effects of the first two processes only, as
the study area has the geomorphological characteristics of a small basin surrounded by hills and low mountains.
Considering that speleothem δ18O records rapidly reflect water-controlled abiotic processes in the atmosphere
(vadose zone), they can signal hydroclimatic changes with much shorter response times relative to those of veg-
etation. A case study of the modern speleothem geochemistry near our study area implies maximum response
times of a few months to rainfall events during rainy summers56. Therefore, the discovery of lags between biotic
(PqPann data of GG19-2–1) and abiotic (δ18O data of BN-1) responses in this study are strongly supported by
the results of Williams et al.40, who reported a vegetation response time of 60 years in the most highly significant
Scientific Reports | (2020) 10:17814 | https://doi.org/10.1038/s41598-020-74994-x 5
Vol.:(0123456789)www.nature.com/scientificreports/
Scientific Reports | (2020) 10:17814 | https://doi.org/10.1038/s41598-020-74994-x 6
Vol:.(1234567890)www.nature.com/scientificreports/
◂Figure 4. Multi-centennial dry–wet periods and time-series lags of biotic (pollen) and abiotic (speleothem)
responses to rainfall over the past 1300 years in East Asia. (a) PqPann of Korean18 (GG19-2–1 sediment core,
solid blue line) and Chinese27,32 pollen data. SL (solid brown line), Sihailongwan Lake. JL (dashed brown
line), Jingpo Lake; SOJ-2 (dashed blue line), Songji Lake. (b) Detrended fluctuations of PqPann showing the
frequency, amplitude, and duration of Pann at four sites. All colors and lines have the same meaning as in
Fig. 4 (a). (c) δ18O of the Korean Baeg-nyeong C ave9 and Chinese Heshang Cave33. A low δ18O corresponds to
a strong EASM. (d) Detrended fluctuations of the two caves showing the amplitude and duration of the high
precipitation interval. (e) Time series of solar irradiance70, number of s unspots50, and insolation at N30° in
June35 showing synchronous fluctuations. Upper case letters indicate grand solar minima: O, Oort; W, Wolf;
S, Spörer; M, Maunder; D, Dalton; G, Gleissberg. (f) Temperature anomaly (℃) of northeast China7 and sea
surface temperature (℃) of the western tropical Pacific71. (g) ENSO intensity from the Southern H emisphere72
with 100-point moving average values (thick purple line). Light-gray bars indicate the high-precipitation periods
represented by the Korean PqPann (GG19-2–1) and speleothem (BN-1) data. EASM, East Asian Summer
monsoon; ENSO, El Niño-Southern Oscillation. The Korean chronology is plotted at the bottom. Kor, Korea;
KE, Korea Empire; JD, Joseon Dynasty; KD, Koryŏ Dynasty; and USD, Unified Silla Dynasty (drawn using
CorelDRAW Graphics Suite X7).
cross-correlation among lake sediments and a median lag time of 90 years among all significant cross-correlations
between pollen and δ18O and chironomid assemblages.
In an ecological context, changes on a multi-decadal time scale in response to climate oscillations represent
no more than a few population cycles for many arboreal t axa40. However, we suggest that the reconstruction of
decadal- to centennial-scale climatic oscillations should be taken into account in determining biotic lags, even
though they can be ignored in the reconstruction of millennial-scale climatic variability. Our new finding can
be used to predict shifts in vegetation responses to climatic changes such as rapid warming or cooling under
conditions of global warming.
Methods
The Gonggeom-ji paleo-reservoir is located inland in central South Korea (36°30′46"N, 128°09′39"E, elevation
64 m above sea level) (Fig. 1). The 7-m-long GG19-2–1 sediment core obtained from Gonggeom-ji consists
mainly of medium to coarse sand in the lower section, gray to dark-gray laminated clayey silt in the middle
section, and oxidized brown mottled and laminated clayey silt in the upper section (Supplementary Figure S1).
The GG19-2–1 sediment core was dated by accelerator mass spectrometry (AMS) analysis of 14C in eight plant
samples held by the Korea Institute of Geoscience and Mineral Resources, and calendric ages were recalculated
using CalPal-2007Online57 (Supplementary Table S1). The 137Cs activity was measured in eight soil samples
taken at 2.5-cm intervals from the upper Sect. (1.1–1.3 m) of the core, excluding the disturbed soil layer (Sup-
plementary Figure S1). The depth at which 137Cs activity was first detected, 1.225 m, was assigned to the year
1963. An age–depth model was constructed using the R package Clam58 and IntCal13 radiocarbon calibration
curve59 analysis, i.e., AMS analysis of the 14C and 137Cs activity of eight samples.
Fifty-five samples of the GG19-2–1 sediment core were taken for pollen analysis at 10-cm intervals from 1.0 to
6.5 m. Pollen was extracted using a standard palynological m ethod60. Two tablets containing exotic Lycopodium
spores (27,637 per tablet) were added to each dry sample (2–4 g) to calculate the palynological concentration
per gram of sample61. A pollen diagram with local pollen assemblage zones was produced using Tilia software62
(Supplementary Figure S2).
Annual precipitation over the last 1300 years was quantitatively reconstructed based on the subfossil AP
records using CREST s oftware63 and the CREST-formatted GBIF d atabase64. The dataset contains the records of
plants with quarter-degree grid cell resolution; we used 5,123 plant distribution records within 450 grid cells,
which correspond to the geographical range of the KP. To determine the rationality of the PqPann reconstruc-
tion, we compared the instrumental rainfall and historic drought records (Fig. 2a–c) and reconstructed the
precipitation index in the central inland and northeast coast areas from sediment, cave, and microfossil proxy
data (Fig. 2d–f). The sand contents of cores KL-28 and KL-2922,65, which were used as indicators of the Holocene
precipitation intensity, were chosen as input variables (Fig. 2b). Both of these cores, and the GG19-2–1 core,
are located at the same latitude in the central inland region of the KP, and appear to have experienced similar
climate changes during the late Holocene. The sand contents of the two cores were interpolated linearly accord-
ing to the age of the pollen data.
The age-depth m odel58, together with the considered core section showing an uneven irregular erosional
surface and dramatic shifts of grain size (μm) and mean Folk and Ward (Φ), indicated a 660-year hiatus at a depth
of 3.5 m in the core sample (Supplementary Figure S1). An ANNs was used to reconstruct Pann for the hiatus
section of the GG19-2–1 sediment core using Visual Gene Developer 1.9 build 78566 (Fig. 2c). The structure of
the ANNs was designed with two hidden layers. PqPann and ANNs precipitation data were highly correlated
with each other (R2 = 0.955) (Supplementary Figure S3a). The sand contents of core KL-2922, which were used
as indicators of the Holocene precipitation intensity, were chosen as the input variables (Fig. 2b). The neural
network was trained with a back-propagation algorithm using a hyperbolic tangent transfer function.
We used a Butterworth low-pass-filter to determine the periodicity of precipitation variability and performed
cross-correlation analysis to identify the lag time between biotic and abiotic responses to precipitation. We per-
formed power spectral analysis of the ANNs and BN-1 δ18O data to determine the optimal Butterworth low-pass-
filter value. Power spectral analysis of the ANNs and BN-1 δ18O data for the last 1300 years (650–1940 CE) yielded
periodicities of ca. 90–150 years, ranging from 93 to 144 years and from 117 to 144 years (above the 95% con-
fidence level), respectively (Supplementary Figure S4). Based on these results, a 100-year Butterworth low-pass
Scientific Reports | (2020) 10:17814 | https://doi.org/10.1038/s41598-020-74994-x 7
Vol.:(0123456789)www.nature.com/scientificreports/
filter was applied (Fig. 2d,e,f) using the R package signal67. We also performed cross-correlation analysis (Fig. 3
and S3) using B INCOR68, to determine the lag time between the biotic and abiotic responses to precipitation.
Received: 18 May 2020; Accepted: 6 October 2020
References
1. Ljungqvist, F. C. A new reconstruction of temperature variability in the extra‐tropical northern hemisphere during the last two
millennia. Geogr. Ann. Ser. A, Phys. Geogr. 92, 339–351 (2010).
2. Wang, Y. et al. The holocene asian monsoon: links to solar changes and north atlantic climate. Science 80(308), 854–857 (2005).
3. Zhang, P. et al. A test of climate, sun, and culture relationships from an 1810-year Chinese cave record. Science 80(322), 940–942
(2008).
4. Wang, X. et al. Climate, desertification, and the rise and collapse of China’s historical dynasties. Hum. Ecol. 38, 157–172 (2010).
5. Paulsen, D. E., Li, H.-C. & Ku, T.-L. Climate variability in central China over the last 1270 years revealed by high-resolution sta-
lagmite records. Quat. Sci. Rev. 22, 691–701 (2003).
6. Lee, H. & Zhang, D. Space-time integration in geography and GIScience. Space-time integration in geography and giscience:
research frontiers in the US and China (Springer Netherlands, 2015). https://doi.org/10.1007/978-94-017-9205-9.
7. Jia, D., Li, Y. & Fang, X. Complexity of factors influencing the spatiotemporal distribution of archaeological settlements in northeast
China over the past millennium. Quat. Res. 89, 413–424 (2018).
8. Lee, U. The comparative historical study on the weather characteristics in the second half of the 15th century. Korean Stud. 21,
389–415 (2012).
9. Jo, K. et al. 1000-Year quasi-periodicity of weak monsoon events in temperate northeast Asia since the mid-Holocene. Sci. Rep. 7,
15196 (2017).
10. Jo, K. et al. Mid-latitude interhemispheric hydrologic seesaw over the past 550,000 years. Nature 508, 378–382 (2014).
11. Lee, E. et al. Multi-proxy records of Holocene hydroclimatic and environmental changes on the southern coast of South Korea.
Palaeogeogr. Palaeoclimatol. Palaeoecol. 545, 109642 (2020).
12. Park, J. Solar and tropical ocean forcing of late-Holocene climate change in coastal East Asia. Palaeogeogr. Palaeoclimatol. Palaeoecol.
469, 74–83 (2017).
13. Constantine, M., Kim, M. & Park, J. Mid- to late Holocene cooling events in the Korean Peninsula and their possible impact on
ancient societies. Quat. Res. 92, 98–108 (2019).
14. Lim, J. et al. Holocene coastal environmental change and ENSO-driven hydroclimatic variability in East Asia. Quat. Sci. Rev. 220,
75–86 (2019).
15. Yum, J. G., Takemura, K., Tokuoka, T. & Yu, K. M. Holocene environmental changes of the Hwajinpo Lagoon on the eastern coast
of Korea. J. Paleolimnol. 29, 155–166 (2003).
16. Cheung, R. C. W. et al. Decadal- to centennial-scale East Asian summer monsoon variability over the past millennium: An oceanic
perspective. Geophys. Res. Lett. 45, 7711–7718 (2018).
17. Fujiki, T. & Yasuda, Y. Vegetation history during the Holocene from Lake Hyangho, northeastern Korea. Quat. Int. 123–125, 63–69
(2004).
18. Song, B. et al. Pollen record of the mid- to late-Holocene centennial climate change on the East coast of South Korea and its
influential factors. J. Asian Earth Sci. 151, 240–249 (2018).
19. Hwang, S., Kim, J.-Y. & Kim, S. Environmental changes and embankment addition of Reservoir Gonggeomji, Sangju City between
Late Silla- and Early Goryeo dynasty. J. Korean Geomorphol. Assoc. 21, 165–180 (2014).
20. Jhun, J. & Moon, B. Restorations and analyses of rainfall amount observed by Chukwookee. Asia-Pacific J. Atmos. Sci. 33, 691–707
(1997).
21. Yoo, C., Park, M., Kim, H. J. & Jun, C. Comparison of annual maximum rainfall events of modern rain gauge data (1961–2010)
and Chukwooki data (1777–1910) in Seoul Korea. J. Water Clim. Chang. 9, 58–73 (2018).
22. Lim, J., Lee, J.-Y., Hong, S.-S. & Kim, J.-Y. Late Holocene flooding records from the floodplain deposits of the Yugu River South
Korea. Geomorphology 180–181, 109–119 (2013).
23. Li, J. et al. Quantitative Holocene climatic reconstructions for the lower Yangtze region of China. Clim. Dyn. 50, 1101–1113 (2018).
24. Sun, J. et al. Quantitative precipitation reconstruction in the east-central monsoonal China since the late glacial period. Quat. Int.
521, 175–184 (2019).
25. Stebich, M. et al. Holocene vegetation and climate dynamics of NE China based on the pollen record from Sihailongwan Maar
Lake. Quat. Sci. Rev. 124, 275–289 (2015).
26. Li, J. et al. East Asian summer monsoon precipitation variations in China over the last 9500 years: A comparison of pollen-based
reconstructions and model simulations. The Holocene 26, 592–602 (2016).
27. Cao, X. et al. Impacts of the spatial extent of pollen-climate calibration-set on the absolute values, range and trends of reconstructed
Holocene precipitation. Quat. Sci. Rev. 178, 37–53 (2017).
28. Wu, D. et al. Decoupled early Holocene summer temperature and monsoon precipitation in southwest China. Quat. Sci. Rev. 193,
54–67 (2018).
29. Park, J. A modern pollen–temperature calibration data set from Korea and quantitative temperature reconstructions for the
Holocene. The Holocene 21, 1125–1135 (2011).
30. Tian, F. et al. Pollen-climate relationships in time (9 ka, 6 ka, 0 ka) and space (upland vs. lowland) in eastern continental Asia.
Quat. Sci. Rev. 156, 1–11 (2017).
31. Herzschuh, U. et al. Position and orientation of the westerly jet determined Holocene rainfall patterns in China. Nat. Commun.
10, 2376 (2019).
32. Li, C., Wu, Y. & Hou, X. Holocene vegetation and climate in Northeast China revealed from Jingbo Lake sediment. Quat. Int. 229,
67–73 (2011).
33. Hu, C. et al. Quantification of Holocene Asian monsoon rainfall from spatially separated cave records. Earth Planet. Sci. Lett. 266,
221–232 (2008).
34. Wen, R. et al. Holocene precipitation and temperature variations in the East Asian monsoonal margin from pollen data from
Hulun Lake in northeastern Inner Mongolia China. Boreas 39, 262–272 (2010).
35. Berger, A. & Loutre, M. F. Insolation values for the climate of the last 10 million years. Quat. Sci. Rev. 10, 297–317 (1991).
36. Zhao, K. et al. Contribution of ENSO variability to the East Asian summer monsoon in the late Holocene. Palaeogeogr. Palaeocli-
matol. Palaeoecol. 449, 510–519 (2016).
37. Giry, C. et al. Mid- to late Holocene changes in tropical Atlantic temperature seasonality and interannual to multidecadal variability
documented in southern Caribbean corals. Earth Planet. Sci. Lett. 331–332, 187–200 (2012).
38. Viles, H. Interannual, decadal and multidecadal scale climatic variability and geomorphology. Earth-Science Rev. 61, 105–131
(2003).
Scientific Reports | (2020) 10:17814 | https://doi.org/10.1038/s41598-020-74994-x 8
Vol:.(1234567890)www.nature.com/scientificreports/
39. Lim, J. & Fujiki, T. Vegetation and climate variability in East Asia driven by low-latitude oceanic forcing during the middle to late
Holocene. Quat. Sci. Rev. 30, 2487–2497 (2011).
40. Williams, J. W., Post*, D. M., Cwynar, L. C., Lotter, A. F. & Levesque, A. J. Rapid and widespread vegetation responses to past
climate change in the North Atlantic region. Geology 30, 971 (2002).
41. Yu, Z. Late quaternary dynamics of tundra and forest vegetation in the southern niagara escarpment Canada. New Phytol. 157,
365–390 (2003).
42. Yu, Z. Rapid response of forested vegetation to multiple climatic oscillations during the last deglaciation in the northeastern United
States. Quat. Res. 67, 297–303 (2007).
43. Richter, H. & Kituta, S. Ecophysiology of long-distance water transport in trees. in Trees in a Changing Environment- Ecophysiology,
Adaptation, and Future Survival (eds. Tausz, M. & Grulke, N.) (Springer Nature, 2014).
44. Johnson, M. T. & Agrawal, A. A. The ecological play of predator–prey dynamics in an evolutionary theatre. Trends Ecol. Evol. 18,
549–551 (2003).
45. Tobolski, K. & Ammann, B. Macrofossils as records of plant responses to rapid Late Glacial climatic changes at three sites in the
Swiss Alps. Palaeogeogr. Palaeoclimatol. Palaeoecol. 159, 251–259 (2000).
46. Ammann, B. Biotic responses to rapid climatic changes. Palaeogeogr. Palaeoclimatol. Palaeoecol. 159, 191–201 (2000).
47. Walther, G. et al. Ecological responses to recent climate change. Nature 416, 389–395 (2002).
48. Lischke, H., Lotter, A. F. & Fischlin, A. Untangling a Holocene pollen record with forest model simulations and independent
climate data. Ecol. Modell. 150, 1–21 (2002).
49. Steinhilber, F., Beer, J. & Fröhlich, C. Total solar irradiance during the Holocene. Geophys. Res. Lett. 36, L19704 (2009).
50. Solanki, S. K., Usoskin, I. G., Kromer, B., Schüssler, M. & Beer, J. Unusual activity of the Sun during recent decades compared to
the previous 11,000 years. Nature 431, 1084–1087 (2004).
51. Yi, S. & Kim, J.-Y. Pollen analysis at Paju Unjeong, South Korea: Implications of land-use changes since the late Neolithic. The
Holocene 22, 227–234 (2012).
52. Yi, S., Yang, D.-Y. & Jia, H. Pollen record of agricultural cultivation in the west–central Korean Peninsula since the Neolithic Age.
Quat. Int. 254, 49–57 (2012).
53. Yi, S., Saito, Y., Zhao, Q. & Wang, P. Vegetation and climate changes in the Changjiang (Yangtze River) Delta, China, during the
past 13,000 years inferred from pollen records. Quat. Sci. Rev. 22, 1501–1519 (2003).
54. Kim, C. & Cheong, K. Research Report of Antiquities Vol. 204: Gonggeomji. Gyeongsangbukdo Institute of Cultural Properties, 230
p (2013) (in Korean).
55. Ammann, B. et al. Quantification of biotic responses to rapid climatic changes around the Younger Dryas- a synthesis. Palaeogeogr.
Palaeoclimatol. Palaeoecol. 159, 313–347 (2000).
56. Jo, K., Woo, K. S., Hong, G. H., Kim, S. H. & Suk, B. C. Rainfall and hydrological controls on speleothem geochemistry during
climatic events (droughts and typhoons): an example from Seopdong Cave, Republic of Korea. Earth Planet. Sci. Lett. 295, 441–450
(2010).
57. Danzeglocke, U., Joris, O. & Weninger, B. CalPal-2007online. Available at: https://www.calpal-online.de.
58. Blaauw, M. Methods and code for ‘classical’ age-modelling of radiocarbon sequences. Quat. Geochronol. 5, 512–518 (2010).
59. Reimer, P. J. et al. IntCal13 and Marine13 radiocarbon age calibration curves 0–50,000 years cal BP. Radiocarbon 55, 1869–1887
(2013).
60. Moore, P. D., Webb, J. A. & Collison, M. E. Pollen Analysis 2nd edn. (Blackwell Scientific Publications, Oxford, 1991).
61. Stockmarr, J. Tablets with spores used in absolute pollen analysis. Pollen Spores 13, 615–621 (1971).
62. Grimm, E. Tilia 1.7.16 Software. Illinois State Museum, Research and Collection Center, Springfield, II. (2011).
63. Chevalier, M., Cheddadi, R. & Chase, B. M. CREST (Climate REconstruction SofTware): a probability density function (PDF)-
based quantitative climate reconstruction method. Clim. Past 10, 2081–2098 (2014).
64. Chevalier, M. Enabling possibilities to quantify past climate from fossil assemblages at a global scale. Glob. Planet. Change 175,
27–35 (2019).
65. Lim, J., Yi, S., Nahm, W.-H. & Kim, J.-Y. Holocene millennial-scale vegetation changes in the Yugu floodplain, Kongju area, central
South Korea. Quat. Int. 254, 92–98 (2012).
66. Jung, S.-K. & McDonald, K. Visual gene developer: a fully programmable bioinformatics software for synthetic gene optimization.
BMC Bioinformatics 12, 340 (2011).
67. Singal developer. Signal: Signal processing. (2013).
68. Polanco-Martinez, Josue, M., Medina-Elizalde, Martin, A., Goni, Maria, Fernanda, S. & Mudelsee, M. BINCOR: An R package for
Estimating the Correlation between Two Unevenly Spaced Time Series. R J. 11, 170 (2019).
69. Yim, T. & Kira, T. Distribution forest vegetation and climate in the Korea Peninsula. I. Distribution of some indices of thermal
climate. Japanese J. Ecol. 25, 77–88 (1975).
70. Steinhilber, F. et al. 9,400 years of cosmic radiation and solar activity from ice cores and tree rings. Proc. Natl. Acad. Sci. 109,
5967–5971 (2012).
71. Stott, L. et al. Decline of surface temperature and salinity in the western tropical Pacific Ocean in the Holocene epoch. Nature 431,
56–59 (2004).
72. Moy, C. M., Seltzer, G. O., Rodbell, D. T. & Anderson, D. M. Variability of El Niño/Southern Oscillation activity at millennial
timescales during the Holocene epoch. Nature 420, 162–165 (2002).
Acknowledgements
This research was supported by a Basic Research Project (GP2020-003) of the Korea Institute of Geoscience
and Mineral Resources funded by the Ministry of Science and ICT, Korea, and was performed as part of the
“Paleoenvironmental reconstruction based on biological analysis from Korean wetland sediments” project
(NNIBR202001104). We thank the two anonymous reviewers for their constructive comments. We thank C. Li
for providing the Lake Jingpo pollen data and Prof. M. Yasuhara for providing the Hwajinpo Lake foraminifera
data. The data used in this study are available in the supporting information, and from the NOAA Paleoclimatol-
ogy database (https://www.ncdc.noaa.gov/data-access/paleoclimatology-data).
Author contributions
S. Y. designed the study, drafted the manuscript, and analyzed palynomorphs. C.-P. J., K. J., M.-S. K., and X. C.
contributed to the statistical analyses and discussion. H. L., S. D. L., and J. L. contributed to the dating, grain
size analysis, and discussion.
Competing interests
The authors declare no competing interests.
Scientific Reports | (2020) 10:17814 | https://doi.org/10.1038/s41598-020-74994-x 9
Vol.:(0123456789)www.nature.com/scientificreports/
Additional information
Supplementary information is available for this paper at https://doi.org/10.1038/s41598-020-74994-x.
Correspondence and requests for materials should be addressed to S.Y. or C.-P.J.
Reprints and permissions information is available at www.nature.com/reprints.
Publisher’s note Springer Nature remains neutral with regard to jurisdictional claims in published maps and
institutional affiliations.
Open Access This article is licensed under a Creative Commons Attribution 4.0 International
License, which permits use, sharing, adaptation, distribution and reproduction in any medium or
format, as long as you give appropriate credit to the original author(s) and the source, provide a link to the
Creative Commons licence, and indicate if changes were made. The images or other third party material in this
article are included in the article’s Creative Commons licence, unless indicated otherwise in a credit line to the
material. If material is not included in the article’s Creative Commons licence and your intended use is not
permitted by statutory regulation or exceeds the permitted use, you will need to obtain permission directly from
the copyright holder. To view a copy of this licence, visit http://creativecommons.org/licenses/by/4.0/.
© The Author(s) 2020
Scientific Reports | (2020) 10:17814 | https://doi.org/10.1038/s41598-020-74994-x 10
Vol:.(1234567890)You can also read