Escalating incidence of infective endocarditis in Europe in the 21st century
←
→
Page content transcription
If your browser does not render page correctly, please read the page content below
Open access Valvular heart disease
Open Heart: first published as 10.1136/openhrt-2021-001846 on 20 October 2021. Downloaded from http://openheart.bmj.com/ on November 9, 2021 by guest. Protected by copyright.
Escalating incidence of infective
endocarditis in Europe in the
21st century
Khawaja M Talha ,1 Larry M Baddour,1,2 Martin H Thornhill,3 Verda Arshad,1
Wajeeha Tariq,1 Imad M Tleyjeh,4,5 Christopher G Scott ,6 Meredith C Hyun,6
Kent R Bailey,6 Nandan S Anavekar,2 Raj Palraj,1 M Rizwan Sohail,1,7
Daniel C DeSimone,1,2 Mark J Dayer8
►► Additional supplemental ABSTRACT
material is published online only. Key questions
Aim To provide a contemporary analysis of incidence
To view, please visit the journal
trends of infective endocarditis (IE) with its changing
online (http://dx.d oi.org/10. What is already known about this subject?
epidemiology over the past two decades in Europe.
1136/o penhrt-2021-0 01846). ►► Infective endocarditis (IE) is an uncommon life-
Methods A systematic review was conducted at the
threatening infection that, despite aggressive med-
To cite: Talha KM, Baddour LM, Mayo Clinic, Rochester. Ovid EBM Reviews, Ovid Embase,
ical and surgical interventions, remains associated
Thornhill MH, et al. Escalating Ovid Medline, Scopus and Web of Science were searched
with high morbidity and mortality. Recent studies,
incidence of infective for studies published between 1 January 2000 and 30
however, have reported mixed results regarding
endocarditis in Europe in the November 2020. All studies were independently reviewed
21st century. Open Heart temporal changes in trends of IE incidence.
by four referees and those that included a population-
2021;8:e001846. doi:10.1136/ based incidence of IE in patients, irrespective of age, in What does this study add?
openhrt-2021-001846 Europe were included. Least squares regression was used ►► This study pooled data from all nationwide
to estimate pooled temporal trends in IE incidence. population-based registries in Europe and demon-
Received 19 September 2021 Results Of 9138 articles screened, 18 studies were strated an alarming increase in IE incidence over the
Accepted 1 October 2021 included in the review. Elderly men predominated in all past two decades.
studies. IE incidence increased 4.1% per year (95% CI
1.8% to 6.4%) in the pooled regression analysis of eight How might this impact on clinical practice?
studies that included comprehensive and consistent ►► Our findings alert clinicians as to the increasing inci-
trends data. When trends data were weighted according dence of IE and the need to include it in the differen-
to population size of individual countries, an increase tial diagnosis of patients who present with systemic
in yearly incidence of 0.27 cases per 100 000 people complaints of infection. The study also highlights the
was observed. Staphylococci and streptococci were the inefficiency in coding practices, which can compro-
most common pathogens identified. The rate of surgical mise accurate IE incidence trends determinations.
intervention ranged from 10.2% to 60.0%, and the rate
of inpatient mortality ranged from 14.3% to 17.5%. In six
studies that examined the rate of injection drug use, five of delayed, and treatment may be suboptimal
them reported a rate of less than 10%. resulting in worse outcomes. For the latter,
Conclusion Based on findings from our systematic generation of clinical trial data with adequate
review, IE incidence in Europe has doubled over the enrolment of patients can be challenging.
past two decades in Europe. Multiple factors are likely Fortunately, multiple European countries
responsible for this striking increase. systematically record nationwide hospital
Trial registeration number CRD42020191196. admissions data and code the reasons for
those admissions, which permit population-
based investigations of the epidemiology
INTRODUCTION of diseases.2–4 Incidence trends, in partic-
© Author(s) (or their Infective endocarditis (IE) is one of the most ular, have been of keen interest and have
employer(s)) 2021. Re-use lethal infection syndromes. Despite almost been prompted, in part, by changes in the
permitted under CC BY-NC. No 2008 National Institute for Health and Care
commercial re-use. See rights universal hospitalisation for initial treat-
and permissions. Published ment and the availability of multiple recent Excellence (NICE) guidelines5 and the 2009
by BMJ. advances in diagnosis and management, European Society of Cardiology (ESC) guide-
For numbered affiliations see it is characterised by a 1-year mortality rate lines,6 that either called for a total elimina-
end of article. that exceeds 30%.1 Due to the rarity of the tion of antibiotic prophylaxis (AP) use in
syndrome, both the management of, and the dental and other settings (NICE) or a
Correspondence to
Dr Khawaja M Talha; talha. investigation into the disease can be diffi- marked reduction in this practice (ESC).
kh10@gmail.com cult. For the former, an IE diagnosis may be As a result, concerns that an increase in IE
Talha KM, et al. Open Heart 2021;8:e001846. doi:10.1136/openhrt-2021-001846 1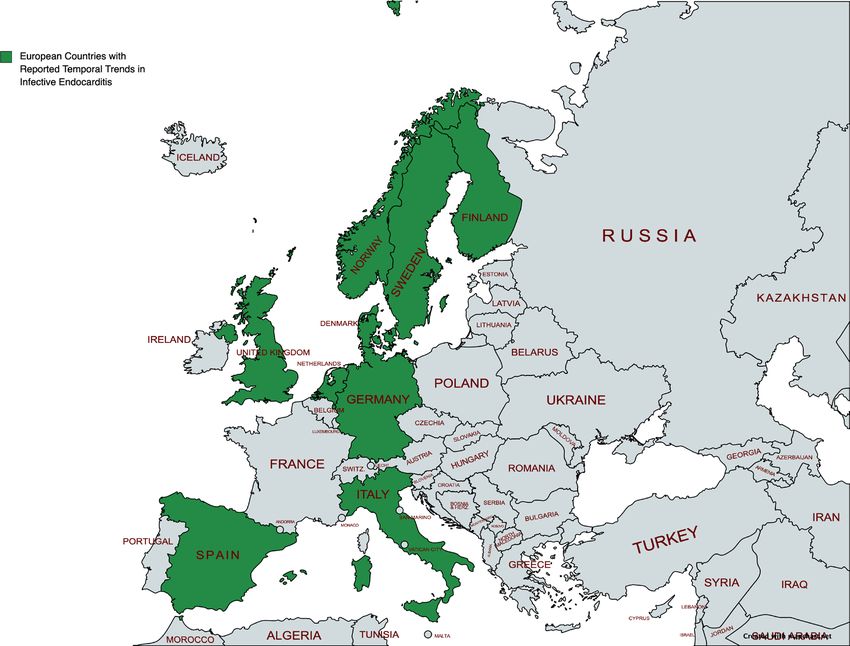
Open Heart
Open Heart: first published as 10.1136/openhrt-2021-001846 on 20 October 2021. Downloaded from http://openheart.bmj.com/ on November 9, 2021 by guest. Protected by copyright.
Figure 1 Schematic representation of study selection using PRISMA checklist. PRISMA, Preferred Reporting Items for
Systematic Reviews and Meta-Analyses.
incidence due to viridans group streptococci (VGS) All results were exported to Endnote where duplicates
would occur following publication of these recommenda- were deleted. Two authors (KMT and LMB) performed
tions prompted investigations of nationwide data. the literature review and any disagreements were solved
There are several other factors including ageing popu- by discussion with two authors (MJD and DCD). Corre-
lations, increased comorbid conditions, increased place- sponding authors of studies were contacted via email in
ment of medical devices and injection drug use (IDU) cases where queries existed.
that impact IE incidence trends and epidemiology. These
factors have been addressed, to some degree, in most of Inclusion and exclusion criteria
the European national investigations. All publications that provided information on population-
Based on the availability of trend data of IE incidence based trends of IE in European populations from the year
and epidemiology from several countries in Europe, we 2000 onwards were included in the review. Single-centre
conducted a contemporary systematic review of Euro- and multicentre studies, clinical trials, case reports,
pean population-based investigations of IE during the abstracts, systematic reviews and animal studies were
21st century. excluded. Investigations that examined IE incidence
specific to infecting pathogens or unique patient popula-
tions (eg, HIV, congenital heart disease) were excluded.
METHODS Studies that included data from the COVID-19 pandemic
A literature search was performed in December 2020 period (January 2020 onwards) and those that reported
with a focus on the incidence and epidemiology of IE data for less than 6 months each year for two or more
using Ovid EBM Reviews, Ovid Embase, Ovid Medline, years were excluded.
Scopus and Web of Science to identify articles published
between 1 January 2000 and 30 November 2020. The Data extraction
search was limited to the English language and search Data that described authors, publication year, study
strategies are outlined in online supplemental material. location, population covered, mean/median age, sex
2 Talha KM, et al. Open Heart 2021;8:e001846. doi:10.1136/openhrt-2021-001846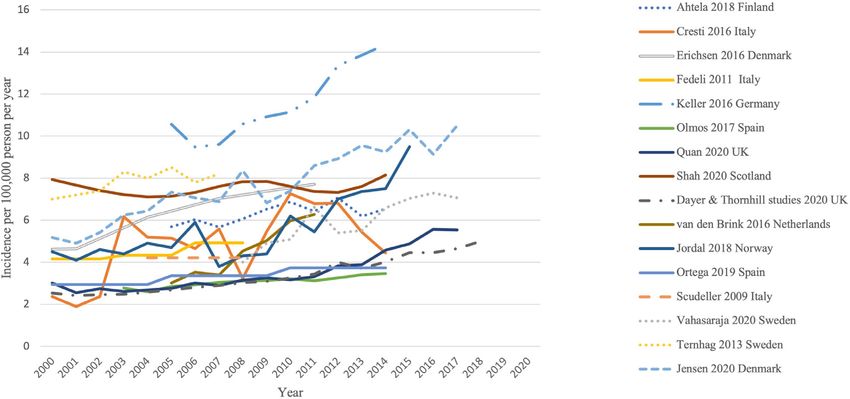
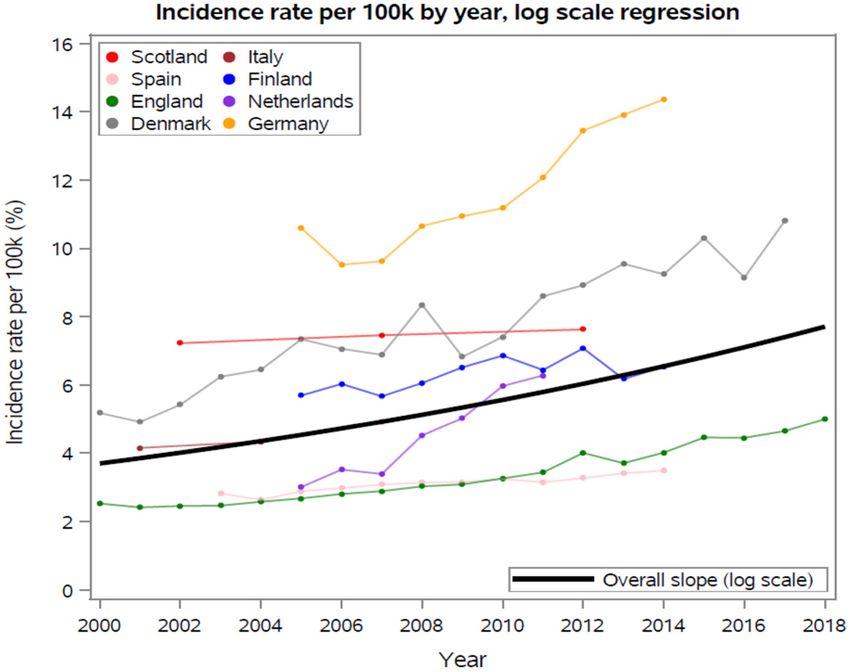
Valvular heart disease
Open Heart: first published as 10.1136/openhrt-2021-001846 on 20 October 2021. Downloaded from http://openheart.bmj.com/ on November 9, 2021 by guest. Protected by copyright.
Figure 2 Visual representation of European countries included in the systematic review.
distribution, incidence, microbiology, mortality, IDU and procedures, inclusion of postmortem diagnoses and
rates of surgical valvular intervention were extracted from number of hospitals serving the population under study
all studies. Four authors (MD, KMT, VA and WT) worked that participated in the study. Author statements about
independently to extract data from studies and contacted shortfall in case ascertainment were also considered an
study investigators if additional data was required. indication of inadequate case ascertainment. Based on
these criteria, studies were excluded that had consid-
Study definition and outcomes erable shortfalls in case ascertainment and/or lacked a
The primary outcome was the trend of IE incidence; case definition. Reviewer disagreements were resolved by
secondary outcomes included temporal trends of path- consensus after rereview of the article.
ogen prevalence, age, sex, prosthetic valve placement, The study was registered with the International
IDU and mortality (in- patient, 30 days, 6 months and Prospective Register of Systematic Reviews, which is an
1 year). international database of prospectively registered system-
Risk of bias atic reviews in health and social care (Registration ID:
Two reviewers (KMT and WT) independently rated the CRD42020191196).8
methodological quality of each study. The quality of each
population-based survey was assessed, based on four key Statistical analysis
features: adequacy of population definition, sampling Studies included in the trend analysis had cases from
techniques, disease definition and completeness of case more than two time points, at least 100 observed cases
ascertainment (online supplemental table 1).7 A popu- in each time period, and estimates of population size
lation definition was deemed to be inadequate if the from which cases were observed. For each time point
residency status of all IE patients was not ascertained. within a study, the incidence per 100 000 population was
Since all studies used population data from national or calculated by taking the observed cases divided by the
regional registries, the population definition was deemed population estimate multiplied by 100 000. Least squares
adequate for all studies. Optimal sampling techniques regression was done on both the incidence per 100 000
included complete enumeration or random sampling and the log transformed incidence per 100 000. Inter-
techniques. Disease definition was defined as adequate if pretation of the regression results for the untransformed
studies used Duke/modified Duke criteria for a diagnosis incidence yields an annual increase in cases per 100 000
of IE. Adequacy of case ascertainment to include all cases while interpretation of the log transformed incidence per
in a given country was assessed based on case-finding 100 000 resulted in an estimate of yearly percent increase
Talha KM, et al. Open Heart 2021;8:e001846. doi:10.1136/openhrt-2021-001846 34
Table 1 Clinical features of patient populations in included studies
Total Male sex Prosthetic Cardiovascular INJECTION Required
# Author cases (N) Years included Country AGE % Microbiology (%) valve % device % DRUG USE % Mortality % surgery %
1 Scudeller 200918 254 2004–2008 Italy Mean: 67.0 (SD 14.0) 66.5 Enterococci 21.6 32.3 NP 2.0 3 months 20.5 40.2
S. aureus 17.5
Open Heart
VGS 14.0
2 Fedeli 201126 1863 2000–2008 Italy Median 68.0 (IQR: 63.0 Blood culture data 6.2 NP NP Overall 14.3 In-patient 37.0
57.0–77.0) S. aureus 29.5 1 year 38.0
CoNS 6.7
Enterococcus faecalis
12.4
Streptococci 28.6
Secondary code data
Streptococci 36.7
S. aureus 17.4
CoNS 6.0
E. faecalis 5.3
3 Thornhill 201114 2000–2010 England NP NP NP NP NP NP NP NP
4 Ternhag 201316 7609 1997–2007 Sweden Mean 65.7 (IQR: 59.2 NP 11.7 NP 4.7 30 days—33.7 5 years follow-up
55–79) 5 years—14.7 13.0
5 Dayer 20152 19 804 2000–2013 England Mean 59.1 68.5 NP NP NP NP NP NP
59.0 (SD: 20.3)
before 2008, 59.3
(SD 20.8) after 2008
6 Cresti 20161 170 1998–2014 Italy Mean 65.7(SD: 16.0) 60.9 S. aureus 25.0 30.0 NP 4.0 1 year 31.8 In-patient 1 year 46.5;
CoNS 22.0 24.0 Urgent/emergent
Streptococcus viridans 31.8;
15.0 Operated within
Enterococci 14.0 10 days 29.0
7 Erichsen 201624 5486 1994–2011 Denmark Mean: 62.7 (no SD 64.4 NP NP NP NP NP NP
provided)
8 Keller 20163 94 364 2005–2014 Germany NP NP Streptococci 20.8 NP NP NP Overall 17.0 NP
Staphylococci 21.9
9 van den Brink 201631 5213 2005–2011 The Netherlands Mean 67.5 (range: 69.9. Staphylococci 36.1 30.1 7.9 NP All-cause 36.1% 38.9
22.0–97.0) S. aureus 30.1 (Median follow-up 4.2
Streptococci 37.4 years)
10 Olmos 201717 16 867 2003–2014 Spain Mean 63.8 (SD: 17.5) 66.3 Streptococci 20.4 18.0 1.1 2.6 In-patient 20.4 23.0
S. aureus 17.1
Enterococci 13.1
CoNS 12.2
11 Ahtela 201811 2611 2005–2014 Finland Mean 60.0 (SD: 18.3) 68.2 NP 5.5 1.5 NP 30 days 11.3 NP
12
12 Jordal 2018 706 1996–2015 Norway Mean 59.2 (need to 69.1 S. aureus 31.1 29.9 NP 20.7 30 days 12.7 34.1
calculate combined VGS 23.1 1 year 21.4
SD) CoNS 11.5
Enterococci 9.5
13 Ortega 201923 25 952 1997–2014 Spain Overall mean: 62.2 65.9 Staphylococci 32.7 9.6 6.5; CIED related IE 6.8 90 days 26.2 NP
(18.6) S. aureus 19.6 21.2
Streptococci 2.5
14 Jensen 20204 7669 1997–2017 Denmark Median 70.2 (IQR: 65.2 NP 15.9 10.9 NP NP NP
58.3–78.8)
Continued
Talha KM, et al. Open Heart 2021;8:e001846. doi:10.1136/openhrt-2021-001846
Open Heart: first published as 10.1136/openhrt-2021-001846 on 20 October 2021. Downloaded from http://openheart.bmj.com/ on November 9, 2021 by guest. Protected by copyright.Valvular heart disease
Open Heart: first published as 10.1136/openhrt-2021-001846 on 20 October 2021. Downloaded from http://openheart.bmj.com/ on November 9, 2021 by guest. Protected by copyright.
in incidence rates. SEs and 95% confidence limits were
calculated.
In-patient 10.2
surgery %
30 days 4.8
Required
1 year 10.6
The pooled regression estimate from the primary anal-
ysis to the simple unweighted average of the individual
NP
NP
regression estimates were compared and were similar.
This suggested that the pooled regression was a reason-
able estimate of the overall trend.
30 days 14.7%
Mortality %
1 year 32.0
Patient and public involvement
No patients or public were involved at any stage of the
NP
NP
NP
synthesis of this study.
DRUG USE %
*The genus and species of the pathogens have been listed as presented in the individual studies. Since the pathogens were grouped differently in each study, it was not possible for us to standardise them.
INJECTION
RESULTS
Study selection
NP
NP
NP
NP
A total of 9138 studies were identified from the search
Cardiovascular
engines after deduplication. The study abstracts were
screened, and 91 were identified for full text review.
device %
Eighteen studies met our inclusion criteria. A sche-
matic representation of studies included using Preferred
NP
NP
NP
NP
Reporting Items for Systematic Reviews and Meta-Analyses
CIED, cardiac implantable electronic device; CoNS, coagulase-negative staphylococci; IE, infective endocarditis; NP, not provided; VGS, viridans group streptococci.
guidelines9 is included in figure 1. England had the
Prosthetic
highest number of studies included (4); the remainder of
valve %
geographical distribution of included studies is illustrated
NP
NP
NP
NP
in figure 2. A detailed profile of studies is presented in
table 1. A total of 15 studies defined IE using a primary
Microbiology (%)
Staphylococci 43.0
Staphylococci 42.4
or secondary diagnosis that was based on International
Streptococci 49.0
Streptococci 35.5
Enterococci 8.9
S. aureus 31.7
S. aureus 37.0
Classification of Diseases (ICD), ninth revision (ICD 9)
VGS 24.7%
and tenth revision (ICD 10) (table 2).
NP
Patient demographics
Male sex
IE was predominately seen in older patients with the
lowest mean age (59.1 years) recorded by Dayer2 and the
Mean 65.0 (SD: 17.0) 49.0
68.0
NP
NP
%
highest median age (70.2) recorded by Jensen.4 Fourteen
Mean 64.9 (range:
studies included investigations included all patient age
groups. Vähäsarja et al10 included patients aged ≥17 years,
17.0–100.0)
Ahtela et al11 and Jordal et al12 included patients aged ≥18
AGE
years and Shah13 included patients aged ≥20 years. IE
NP
NP
predominantly affected men, as reported in all but one
study.13
Country
Overall incidence
Scotland
England
England
Sweden
All studies reported temporal trends in IE incidence
as illustrated in figure 3. Results of three studies from
Years included
England2 14 15 were combined into one line graph since
there was duplication of data owing to similar method-
1998–2017
1990–2014
1998–2018
2008–2017
ology and overlapping time periods. Overall, an appre-
ciable increase in the incidence of IE was demonstrated.
Figure 4 displays estimates from each country with
cases (N)
the pooled regression slope overlaid on individually
7638
4647
Total
observed data. Table 3 shows the least squares regres-
sion slopes for each study included in pooled log scale
Continued
regression analysis for temporal trends of IE incidence
Thornhill 202015
and the average of individual studies. The pooled regres-
Quan 202025
Shah 202013
Vähäsarja10
sion estimate was 4.1%±1.2% per year increase in IE inci-
Author
dence, amounting to a compound increase in incidence
of 106% over 18 years. The two Swedish studies10 16 used
Table 1
different databases and differed in methodology; hence,
15
16
17
18
they were excluded from the primary analysis. They were
#
Talha KM, et al. Open Heart 2021;8:e001846. doi:10.1136/openhrt-2021-001846 5Open Heart
Open Heart: first published as 10.1136/openhrt-2021-001846 on 20 October 2021. Downloaded from http://openheart.bmj.com/ on November 9, 2021 by guest. Protected by copyright.
Table 2 List of ICD codes used in included studies
Study ICD codes Primary/secondary/tertiary
18
Scudeller 2009 No ICD code data available in study –
Fedeli 201126 ICD 9: 421, 98.84 or 112.81 P+S
Thornhill 201114 ICD 10: I33 P+S
Ternhag 201316 ICD 10: I33, I38 or I39 Unspecified
2
Dayer 2015 ICD 10: I33 P+S
Cresti 20161 ICD 9: 421 .x P+S
24
Erichsen 2016 ICD 10: I33 or I38.9 Unspecified (first-time code of incident IE recorded)
3
Keller 2016 ICD 10: I33 Unspecified
van den Brink 201631 Insurance-based codes used for case extraction –
17
Olmos 2017 ICD 9: 421.0, 421.1, 421.9 or 424.99 P+S
Ahtela 201811 ICD 10: I33, I38 or I39 (specificity 96.8%) P (66.3%)+S (24.1%)+T (9.6%)
12
Jordal 2018 ICD 10: I33.0, I38, or I39.0 (after year 1999) Unspecified
28
Ortega 2019 ICD 9: 421.0, 421.1, 421.9, 112.81, 115.04, 115.14, or 115.94 P+S
Jensen 20204 ICD 10: I33.x, I38.x or I39.8 P+S
ICD 8: 421
Quan 202025 ICD 10: I33.0, I33.9, I39.0, I39.8, I01.1, B37.6, or T82.6 P+S
Shah 202013 ICD 10: I33, I38 or I39 Unspecified
ICD 9: 421.1, 424.91, 424.90 or 424.99
Thornhill 202015 ICD 10: I33 P+S
Vähäsarja 202010 No ICD code data available in study –
ICD, International Classification of Diseases.
included in online supplemental table 2 and figure 1, based on the underlying country populations. This was
which demonstrated an overall estimated percent annual done on original scale, incidence per 100 000. Because all
increase of 2.8%±1.0%. The Norway study by Jordal et studies had estimates from 2008, the population in 2008
al. was also excluded as it only provided two data points was used as the weight in this calculation. As shown in
of decade-wise estimates of IE cases and did not include table 3, the estimated yearly increase in IE incidence per
yearly population estimates used to calculate annual 100 000 was 0.24 IE cases per 100 000 per annum without
incidence. weighting. When weights were applied this increased to
Finally, we investigated the degree to which the pooled 0.27 IE cases per 100 000 per annum. This is likely due
trend might be altered if we weighted regression estimates to the German study3 having the highest estimated yearly
Figure 3 Temporal trends of crude incidence of IE across all studies from 2000 to 2020. The y-axis denotes number of cases
per 100 000 people while the x-axis denotes years 2000–2020. IE, infective endocarditis.
6 Talha KM, et al. Open Heart 2021;8:e001846. doi:10.1136/openhrt-2021-001846Valvular heart disease
Open Heart: first published as 10.1136/openhrt-2021-001846 on 20 October 2021. Downloaded from http://openheart.bmj.com/ on November 9, 2021 by guest. Protected by copyright.
Figure 4 Individual and pooled incidence rate per 100 000 /year, log scale regression. The y-axis denotes incidence rate per
100 000 (%), while the x-axis denotes years 2000–2018.
increase as well as the highest population. If Germany to 2015. In contrast, Olmos et al17 reported an overall
data were excluded, the unweighted average was 0.20 IE decrease from 4.4% to 1.1% from 2003 to 2014 in Spain.
cases per 100 000 per annum and the weighted average
was 0.16 IE cases per 100 000 per annum. Microbiology
Details of microbiological data were provided in 11
Injection drug use studies (table 1). Seven studies reported staphylococcal
Six studies reported percentages of patients with IDU species as the most common pathogens, of which three
and IE (table 1). Trends in IDU over study periods were specified Staphylococcus aureus as the most common
reported by two other studies. Jordal et al12 reported an organism. Streptococcal species were identified as the
overall increase in IDU from 16.5% to 23.5% from 1996 most common pathogens in three studies. Scudeller et
Table 3 Least squares regression slopes for each study included in the pooled log scale regression analysis for temporal
trends of IE incidence and the average of individual studies
Incidence per 100 k Log incidence
Estimated annual Estimated annual
Studies included Country increase (per 100 k) 95% CI increase (%) 95% CI
Shah 202013 Scotland 0.040 0.033 to 0.047 0.54 0.44 to 0.64
Olmos 201717 Spain 0.064 0.050 to 0.078 2.09 1.61 to 2.57
Dayer and Thornhill England 0.144 0.126 to 0.162 4.23 3.82 to 4.64
2011–20202
Jensen 20204 Denmark 0.312 0.263 to 0.361 4.17 3.50 to 4.84
Fedeli 201126 Italy 0.128 0.052 to 0.204 2.83 1.58 to 4.08
11
Ahtela 2019 Finland 0.103 0.024 to 0.182 1.66 0.42 to 2.89
31
van den Brink 2016 Netherlands 0.583 0.470 to 0.696 13.05 10.59 to 15.51
Keller 20163 Germany 0.535 0.387 to 0.683 4.52 1.77 to 6.39
Average of individual studies 0.239 0.060 to 0.418 4.14 0.90 to 7.37
Pooled regression 0.238 0.096 to 0.380 4.08 1.77 to 6.39
IE, infective endocarditis.
Talha KM, et al. Open Heart 2021;8:e001846. doi:10.1136/openhrt-2021-001846 7Open Heart
Open Heart: first published as 10.1136/openhrt-2021-001846 on 20 October 2021. Downloaded from http://openheart.bmj.com/ on November 9, 2021 by guest. Protected by copyright.
al18 reported enterococci as the most common causa- also key in the diagnosis of IE using the modified Duke
tive pathogens. Olmos et al17 demonstrated a significant criteria.22
rise in yearly percentage prevalence of enterococci from Studies included in this review did not provide an anal-
10.4% in 2003 to 16.6% in 2014. ysis of factors that could have accounted for the increase
in IE incidence and a temporal sequence of prevalence
Outcomes of epidemiological variables. It is, however, intuitive that
Details of the proportion who underwent surgery are contemporary aspects of healthcare that include inva-
listed in table 1 (range, 10.2%– 60.0%). Follow-up dura- sive procedures and placement of indwelling cardiovas-
tion among these patients was highly variable (inpatient cular devices have increased over the past two decades
to 5 year post-IE diagnosis). Other outcomes examined and likely impacted both IE incidence and its clinical
included inpatient, 30 days, 3 months and 1-year mortality features. Nevertheless, four investigations documented
rates (table 1). an increase in prosthetic valve placement.4 17 23 24
Although some studies have reported increasing IE
incidence after guideline changes,23 this was not found
universally. It would be premature to link a rise in IE
DISCUSSION incidence in Europe to restriction of AP use. Quan et al
This is the first systematic review that has included reported, for example, increasing trends of IE in England
pooled trends of incidence of IE across multiple nation- which neither correlated with the change in recommen-
wide population-based studies in Europe. The current dations by NICE in 2008, nor to a rise in prevalence of
investigation has highlighted a 4% per year rise in inci- VGS as a causative pathogen.25 Moreover, most of the
dence of IE which, when compounded, is an alarming included studies in this systematic review identified staph-
doubling in incidence between 2000 and 2018. Based on ylococci and streptococci as the most common patho-
findings of our extensive systematic review that involved gens of IE over the past two decades (table 1). Hence,
multiple countries with nationwide databases, support an increase in IE incidence cannot be explained simply
the notion that the IE incidence escalation seen is valid by trends in pathogen prevalence, which has its own
and is likely due to multiple factors operative in the 21st array of pitfalls. This includes the fact that not all patient
century. Factors that need to be considered include (1) records included secondary designated microbiology
improvements in diagnosis; (2) changes in epidemiology codes, which provides a partial profile of microbiology.
and associated risk factors; (3) restrictions in AP use Fedeli et al noted a shockingly low percentage (~21%) of
promulgated by updated versions of guidelines and (4) secondary code designations of IE-related pathogens in
improvements in coding practice. Italy.26 Dayer et al reported that ~50% of cases in England
Diagnostic advances in IE have characterised the were designated secondary codes for microbiology, which
past two decades and, while not examined specifically increased towards the end of the study period in 2013.2
in our review, these advances likely contributed to the Similarly, Quan et al reported that only 67% of the total
increasing incidence of IE. Li et al19 modified the Duke cases were designated codes for microbiology.25 Perhaps
criteria that included echocardiography as a pivotal tool the most important inherent limitation in all studies was
in establishing an IE diagnosis in patients who do not the absence of a specific ICD-10 code for VGS. This has
undergo valve surgery or autopsy for diagnosis confir- greatly hampered accuracy of reporting microbiological
mation. Inpatient data available through the Nationwide data as we strive to define the impact, if any, of changes in
Inpatient Sample for the first decade of this century in AP use in the prevention of IE.
the USA supports the notion that echocardiography use The impact of ICD coding on IE incidence is often
has indeed increased among hospitalised patients20 21 underappreciated and it is critical to emphasise because
and anecdotally the use of echocardiography is far more many of the investigations included in our review were
widespread in Europe too. Echocardiography, both trans- dependent on ICD coding to identify IE admissions
thoracic and transoesophageal has become a ‘mainstay’ (table 2). Cresti et al, for example, found that 28% of IE
of cardiovascular evaluation in suspect cases of IE and its cases extracted using ICD-9 codes were false positive and
complications. The increase in use of echocardiography, failed to pick up 14% of confirmed cases, which raised
particularly the transoesophageal approach is expected questions on the validity of current code designations.1
to continue which is a potential factor in the increase in The potential impact of coding was also highlighted by
IE incidence due to enhanced diagnostic features. Fawcett et al27 who reported a sensitivity of IE of 76%
Additional tools, in particular multislice CT, 18fluoro- for specific codes in ICD-10 with more than half of cases
deoxyglucose positron emission tomography/CT, and coded by using ICD-10 as IE were not confirmed cases.
single-
photon emission CT, have also been helpful in The code I33 had a positive predictive value (PPV)
securing an IE diagnosis when transoesophageal echo- of 82%–85%; in contrast, and the code I38 had a PPV
cardiography has been insufficient or unavailable. Such ofValvular heart disease
Open Heart: first published as 10.1136/openhrt-2021-001846 on 20 October 2021. Downloaded from http://openheart.bmj.com/ on November 9, 2021 by guest. Protected by copyright.
prevalent diseases, for IE, an uncommon malady, consis- data are reported across studies and inadequacy in coding of
tent coding practices to accurately estimate temporal microbiological data.
trends is essential. Because 12 of 23 studies that were
included in our systematic review used ICD-10 coding Author affiliations
1
Division of Infectious Diseases, Department of Medicine, Mayo Clinic, Rochester,
and all included I33, the most specific code for IE, signif-
Minnesota, USA
icant trend variation in IE incidence across investigations 2
Department of Cardiovascular Diseases, Mayo Clinic, Rochester, Minnesota, USA
was not observed (figure 2). 3
School of Clinical Dentistry, The University of Sheffield Faculty of Medicine
The two Spanish investigations17 23 included in the system- Dentistry and Health, Sheffield, UK
4
atic review reported incidence data for a similar time period. Infectious Diseases Section, Department of Medical Specialties, King Fahad
Medical City, Riyadh, Saudi Arabia
Ortega-Loubon et al included a larger sample size and a 5
Division of Epidemiology, Mayo Clinic, Rochester, Minnesota, USA
higher annual incidence but reported a similar trend to 6
Department of Biomedical Statistics and Informatics, Mayo Clinic, Rochester,
the Olmos study. However, Ortega-Loubon et al reported a Minnesota, USA
higher prevalence (16%) of Gram-negative rods as compared 7
Section of Infectious Diseases, Baylor College of Medicine, Houston, Texas, USA
8
with streptococcal species (2.5%), while Olmos et al identi- Taunton and Somerset NHS Foundation Trust, Taunton, UK
fied streptococcal species as the most common causative
Contributors We confirm that all authors of this study contributed significantly to
pathogen of IE (20.4%). Two similar contemporary studies
the synthesis of the manuscript, meet the authorship criteria and have agreed to
with the same methodology from the authors of the Ortega report all potential conflicts of interest in the manuscript. The authors also agree
study reported that causative pathogens were ‘unspecified’ to release the copyright should the manuscript be accepted for publication. KMT is
in ~86% of cases,28 29 while the 2019 study reported microbio- the guarantor of the manuscript.
logical findings in 52.2% of cases. This suggests that microbi- Funding The authors are extremely grateful for the philanthropic support provided
ological data from the Ortega study may not be reliable and by a gift from Eva and Gene Lane (LMB), which was paramount in our work to
advance the science of cardiovascular infections and has been an ongoing focus
Olmos et al likely provided a more accurate representation of of investigation at Mayo Clinic for over 60 years. We also recognise the unique
the pathogen distribution in Spain. expertise of Danielle J. Gerberi, M.L.S., AHIP for conducting the literature search of
Williams et al recently published a systematic review detailing the systematic review and Barbara A. Abbott for data retrieval from the Rochester
contemporary epidemiological changes in IE following Epidemiology Project (REP).
major guideline changes.30 They included studies from Map disclaimer The inclusion of any map (including the depiction of any
North America and Europe and concluded that although boundaries therein), or of any geographic or locational reference, does not imply
the expression of any opinion whatsoever on the part of BMJ concerning the legal
there was no appreciable increase in IE incidence in North status of any country, territory, jurisdiction or area or of its authorities. Any such
America following pertinent guideline changes, there was a expression remains solely that of the relevant source and is not endorsed by BMJ.
potential rise in incidence in Europe. They included just five Maps are provided without any warranty of any kind, either express or implied.
European studies in their review, whereas our current inves- Competing interests LMB, M.D. reports Boston Scientific, consultant duties;
tigation includes 18 studies, where the incidence trends were UpToDate, royalty payments (authorship duties); Botanix Pharmaceuticals,
consulting duties; Roivant Sciences, consultant duties. MRS, M.D. reports
examined statistically over 18 years. Furthermore, Williams et
receiving funds from TYRX and Medtronic for prior research unrelated to this study
al specifically studied the impact of guideline changes for AP administered according to a sponsored research agreement between Mayo Clinic
use on the incidence of IE, while we focused on trends, irre- and study sponsor that prospectively defined the scope of the research effort and
spective of AP guideline changes, to assess all factors respon- corresponding budget; and honoraria/consulting fees from Medtronic, Philips and
Aziyo Biologics. Research Grant: Medtronic. MJD, M.B.B.S. reports payments from
sible for increasing IE trends.
Biotronik unrelated to this study. IMT, M.D. reports UpToDate, royalty payments
Despite the thoroughness of this review, there were some (authorship duties). The remaining authors have nothing to disclose.
limitations to the current study. Data for patient demo- Patient consent for publication Not applicable.
graphics, microbiology, mortality and surgery were provided
Provenance and peer review Not commissioned; externally peer reviewed.
for most studies as a single percentage over the study period,
Data availability statement All data relevant to the study are included in the
and not as yearly trends. Hence, a risk factor meta-regression article or uploaded as online supplemental information.
analysis could not be performed, which would have helped
Open access This is an open access article distributed in accordance with the
quantify the contribution of specific risk factors associated Creative Commons Attribution Non Commercial (CC BY-NC 4.0) license, which
with the rising trends of IE. Furthermore, these studies are permits others to distribute, remix, adapt, build upon this work non-commercially,
only observational and by design, unable to determine aetio- and license their derivative works on different terms, provided the original work is
logical factors associated increasing incidence. properly cited, appropriate credit is given, any changes made indicated, and the use
is non-commercial. See: http://creativecommons.org/licenses/by-nc/4.0/.
ORCID iDs
CONCLUSION Khawaja M Talha http://orcid.org/0000-0003-0351-4464
Christopher G Scott http://orcid.org/0000-0003-1340-0647
This study highlights a greater than twofold increase in inci-
dence of IE in Europe between 2000 and 2018. This is likely
due to a combination of factors including an increasingly
elderly population, a rise in cardiovascular device implanta- REFERENCES
1 Cresti A, Chiavarelli M, Scalese M, et al. Epidemiological and
tion procedures, increased use of multiple imaging modali- mortality trends in infective endocarditis, a 17-year population-based
ties for diagnosis, improved coding and possibly a restriction prospective study. Cardiovasc Diagn Ther 2017;7:27–35.
2 Dayer MJ, Jones S, Prendergast B, et al. Incidence of infective
of AP use. However, it is difficult to ascertain a single factor endocarditis in England, 2000-13: a secular trend, interrupted time-
for this change, since there is great heterogeneity in how series analysis. Lancet 2015;385:1219–28.
Talha KM, et al. Open Heart 2021;8:e001846. doi:10.1136/openhrt-2021-001846 9Open Heart
Open Heart: first published as 10.1136/openhrt-2021-001846 on 20 October 2021. Downloaded from http://openheart.bmj.com/ on November 9, 2021 by guest. Protected by copyright.
3 Keller K, von Bardeleben RS, Ostad MA, et al. Temporal trends in the 18 Scudeller L, Badano L, Crapis M, et al. Population-based
prevalence of infective endocarditis in Germany between 2005 and surveillance of infectious endocarditis in an Italian region. Arch Intern
2014. Am J Cardiol 2017;119:317–22. Med 2009;169:1718–3.
4 Jensen AD, Bundgaard H, Butt JH, et al. Temporal changes in 19 Li JS, Sexton DJ, Mick N, et al. Proposed modifications to the Duke
the incidence of infective endocarditis in Denmark 1997-2017: a criteria for the diagnosis of infective endocarditis. Clin Infect Dis
nationwide study. Int J Cardiol 2021;326:145–52. 2000;30:633–8.
5 Richey R, Wray D, Stokes T, et al. Prophylaxis against infective 20 Papolos A, Narula J, Bavishi C, et al. U.S hospital use of
endocarditis: summary of NICE guidance. BMJ 2008;336:770–1. echocardiography: insights from the nationwide inpatient sample. J
6 Habib G, Lancellotti P, Antunes MJ, et al. 2015 ESC guidelines for Am Coll Cardiol 2016;67:502–11.
the management of infective endocarditis: the task force for the 21 Virnig BA, Shippee ND, O'Donnell B. Trends in the use of
management of infective endocarditis of the European Society of echocardiography, 2007 to 2011: Data Points #20.
Cardiology (ESC). endorsed by: European Association for Cardio- 22 Liesman RM, Pritt BS, Maleszewski JJ, et al. Laboratory diagnosis of
Thoracic Surgery (EACTS), the European Association of Nuclear infective endocarditis. J Clin Microbiol 2017;55:2599–608.
Medicine (EANM). Eur Heart J 2015;36:3075–128. 23 Ortega-Loubon C, Muñoz-Moreno MF, Andrés-García I, et al.
7 Tleyjeh IM, Abdel-Latif A, Rahbi H, et al. A systematic review Nosocomial vs. community-acquired infective endocarditis in Spain:
of population-based studies of infective endocarditis. Chest location, trends, clinical presentation, etiology, and survival in the
2007;132:1025–35. 21st century. J Clin Med 2019;8. doi:10.3390/jcm8101755. [Epub
8 Page MJ, Shamseer L, Tricco AC. Registration of systematic ahead of print: 22 10 2019].
reviews in PROSPERO: 30,000 records and counting. Syst Rev 24 Erichsen P, Gislason GH, Bruun NE. The increasing incidence of
2018;7:018–699. infective endocarditis in Denmark, 1994-2011. Eur J Intern Med
9 Page MJ, McKenzie JE, Bossuyt PM. The PRISMA 2020 statement: 2016;35:95–9.
an updated guideline for reporting systematic reviews. Bmj 2021;29. 25 Quan TP, Muller-Pebody B, Fawcett N, et al. Investigation of the
10 Vähäsarja N, Lund B, Ternhag A, et al. Incidence of infective impact of the NICE guidelines regarding antibiotic prophylaxis
endocarditis caused by viridans group streptococci in Sweden during invasive dental procedures on the incidence of infective
- effect of cessation of antibiotic prophylaxis in dentistry for risk endocarditis in England: an electronic health records study. BMC
individuals. J Oral Microbiol 2020;12:1768342. Med 2020;18:020–1531.
11 Ahtela E, Oksi J, Porela P, et al. Trends in occurrence and 30-day 26 Fedeli U, Schievano E, Buonfrate D, et al. Increasing incidence
mortality of infective endocarditis in adults: population-based and mortality of infective endocarditis: a population-based
registry study in Finland. BMJ Open 2019;9:e026811. study through a record-linkage system. BMC Infect Dis
12 Jordal S, Kittang BR, Salminen P-R, et al. Infective endocarditis 2011;11:1471–2334.
in Western Norway: a 20-year retrospective survey. Infect Dis 27 Fawcett N, Young B, Peto L, et al. 'Caveat emptor': the cautionary
2018;50:757–63. tale of endocarditis and the potential pitfalls of clinical coding data-
13 Shah ASV, McAllister DA, Gallacher P, et al. Incidence, microbiology, an electronic health records study. BMC Med 2019;17:019–1390.
and outcomes in patients hospitalized with infective endocarditis. 28 Ortega-Loubon C. Ruiz López del Prado G, Muñoz-Moreno MF, et al.
Circulation 2020;141:2067–77. impact of the economic crisis on endocarditis mortality in Spain: a
14 Thornhill MH, Dayer MJ, Forde JM, et al. Impact of the NICE nationwide study. Int J Health Serv 2021;29:00207314211012357.
guideline recommending cessation of antibiotic prophylaxis for 29 Heredia-Rodríguez M, Hernández A, Bustamante-Munguira J,
prevention of infective endocarditis: before and after study. BMJ et al. Evolution of the incidence, mortality, and cost of infective
2011;342:d2392. endocarditis in Spain between 1997 and 2014. J Gen Intern Med
15 Thornhill MH, Dayer MJ, Nicholl J, et al. An alarming rise in incidence 2018;33:1610–3.
of infective endocarditis in England since 2009: why? Lancet 30 Williams ML, Doyle MP, McNamara N, et al. Epidemiology of
2020;395:1325–7. infective endocarditis before versus after change of international
16 Ternhag A, Cederström A, Törner A, et al. A nationwide cohort study guidelines: a systematic review. Ther Adv Cardiovasc Dis
of mortality risk and long-term prognosis in infective endocarditis in 2021;15:17539447211002687.
Sweden. PLoS One 2013;8:e67519. 31 van den Brink FS, Swaans MJ, Hoogendijk MG, et al. Increased
17 Olmos C, Vilacosta I, Fernández-Pérez C, et al. The Evolving Nature incidence of infective endocarditis after the 2009 European
of Infective Endocarditis in Spain: A Population-Based Study Society of Cardiology guideline update: a nationwide study in the
(2003 to 2014). J Am Coll Cardiol 2017;70:2795–804. Netherlands. Eur Heart J Qual Care Clin Outcomes 2017;3:141–7.
10 Talha KM, et al. Open Heart 2021;8:e001846. doi:10.1136/openhrt-2021-001846You can also read