A Representation Learning Approach to Animal Biodiversity Conservation
←
→
Page content transcription
If your browser does not render page correctly, please read the page content below
A Representation Learning Approach to Animal Biodiversity
                                   Conservation
                    Meet Mukadam*            Mandhara Jayaram*
                 Dept. of Computer Science  Dept. of Computer Science
                    Rutgers University         Rutgers University
                 New Brunswick, NJ, USA     New Brunswick, NJ, USA
              meet.mukadam@rutgers.edu mandhara.jayaram@rutgers.edu

                                             Yongfeng Zhang
                                         Dept. of Computer Science
                                            Rutgers University
                                         New Brunswick, NJ, USA
                                     yongfeng.zhang@rutgers.edu

                                                         Abstract
        Generating knowledge from natural language data has aided in solving many artificial intelligence
        problems. Vector representations of words have been the driving force behind the majority of
        natural language processing tasks. This paper develops a novel approach for predicting the
        conservation status of animal species using custom generated scientific name embeddings. We
        use two different vector embeddings generated using representation learning on Wikipedia text
        and animal taxonomy data. We generate name embeddings for all species in the animal kingdom
        using unsupervised learning and build a model on the IUCN Red List dataset to classify species
        into endangered or least-concern. To our knowledge, this is the first work that makes use of
        learnt features instead of handcrafted features for this task and achieves competitive results. Based
        on the high confidence results of our model, we also predict the conservation status of data
        deficient species whose conservation status is still unknown, steering more focus towards them for
        protection. These embeddings have also been made publicly available here1 . We believe this will
        greatly help in solving various downstream tasks and further advance research in the cross-domain
        involving natural language processing, conservation biology, and life sciences.

1       Introduction
Today, we are losing biodiversity at an unprecedented rate. Animal species or “Animalia” form one of the
vital components of biodiversity and ensure the balance in our ecological system. Hence, conservation of
animals becomes an inherent part of biodiversity conservation and maintaining a functional ecological
system. In this work, we try to address a particular aspect of global animal conservation that tries to
identify species as endangered or least-concern. Out of millions of different animal species on earth, only
a few thousand have been studied and identified as endangered or not, to date. This points out at the time
and resource constraints involved in studying each species individually and manually. International Union
for Conservation of Nature (IUCN) maintains a list of all species2 with their corresponding Red List status.
We base our work on two causes of extinction in animal species – because of either the habitat of the
species being impacted due to various reasons or the loss of genetic variation. We present a data-driven
tool that aims to steer the focus of researchers towards correct and possibly unexplored directions within
animal conservation that helps prioritize species under study. We use reliable data sources for correctness
and build a machine learning classification model to identify species as endangered or not. We use
    ∗
      The first two authors have made equal contributions to this work.
    1
      https://github.com/mukadam-jayaram/representation learning animal species
    2
      https://www.iucnredlist.org/
      This work is licensed under a Creative Commons Attribution 4.0 International Licence. Licence details:
      http://creativecommons.org/licenses/by/4.0/.

                                                             294
                Proceedings of the 28th International Conference on Computational Linguistics, pages 294–305
                                       Barcelona, Spain (Online), December 8-13, 2020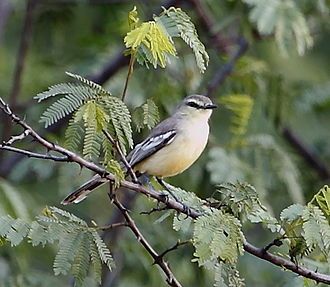
two sources of information to build our machine learning-based framework to predict animal species’
Red List status – Wikipedia text of each species and the complete animal taxonomy structure. The
labeled dataset provided by IUCN for Red List classification contains Red List status of more than 38,000
species. We generate a hierarchical graph using the animal taxonomy data from which we generate node
embeddings for each node in the graph representing a particular animal species and we also generate
document embeddings from the Wikipedia text. Our work proposes the use of a non-linear combination
of these embeddings learnt using a machine learning model to classify the species into endangered or
least-concern. We believe that the information related to habitat is captured through Wikipedia text as it
contains descriptive details of the species’ geography, traits, and other characteristic information. Also,
it is intuitive to use a graph representation learning method to capture the structural information of the
taxonomy graph that depicts how different species are related to one another. We also train a probabilistic
model to obtain a confidence score for our predictions since it is crucial to associate our predictions with
a level of belief for this particular task. Our results indicate that our method not only performs well on
the binary classification task but is also able to classify more than half of the test data with a confidence
c of 75 percent or more, with an accuracy of 87 percent. These promising results are highly motivating
to propose the use of this model in a research or industrial setting as well as spark great research in this
avenue. We demonstrate one such application by using the trained model on Data-Deficient species whose
conservation status is unknown. We uncovered 1,040 out of 7,170 species as endangered showing how
focus can be steered towards such species for more study to aid their conservation.
2   Related Works
There have been works related to the prediction of extinction status of animal and plant species where
spatial and morphological traits data have been used with a number of Machine Learning classifiers like
Bland et al. (2015), Eimear Nic Lughadha and Rivers (2018), Bolam (2018) and Pelletier et al. (2018). In
all these works, the latitude and longitude of where the species are found along with characteristic traits of
these species like body mass, litter size, habitat breadth, trophic level have been explicitly used as features
to build classifiers. Also, these works have focused on global as well as specific regions and habitats
where some of these species dwell. Eimear Nic Lughadha and Rivers (2018) is a review of several of such
approaches to solving the same problem.
   Yijia et al. (2019) proposed an approach to combine Fasttext and Node2vec to generate word embeddings
for scientific names of drugs. They formulated a reasoning to encode morphology and hierarchical data
in the vector representations of these drugs and evaluated their model on two bench-marking tasks for
similarity measuring and two biomedical relation extraction tasks and have achieved competitive results
on both. Cui et al. (2014) proposed a method to generate word embeddings for rare or unseen words by
restricting morphologically similar words to have similar embeddings. Gensim, proposed by Řehůřek
and Sojka (2010), has an implementation of Le and Mikolov (2014)’s Doc2Vec that learns paragraph and
document embeddings via the distributed CBOW and skip-gram models. This work has been successfully
applied to various tasks such as sentiment classification, text classification, and language understanding.
   Several methods have been proposed for generating vector representations using graph neural networks
for graphical data like social networks, communication networks, and word co-occurrence networks.
Grover and Leskovec (2016) proposed a method based on random walks to encode graphical represen-
tations of social networks and protein sequences and achieved state-of-the-art results on benchmark
multi-class classification tasks for both. Further, they also assessed the quality of vector embeddings
generated using Node2vec on a POS-tagger task on a large Wikipedia corpus.
   Pelletier et al. (2018) show the performance of various machine learning methods on predicting the
conservation status of over 150,000 plant species using open-source geographic, environmental, and
morphological trait data. Another similar work in this area is done by Bland et al. (2015). They show
the performance of six statistical machine learning models on predicting the Red List status of mammals
achieving classification accuracy up to 92%. They also reported that the Area Under ROC for their best
models ranged between 0.873 and 0.961. This work is the closest to ours, however, it uses handcrafted
features as opposed to our learned features and only works with the mammal subset of Animalia. We
consider this as a benchmark for our work, although it is not a completely fair comparison since the

                                                     295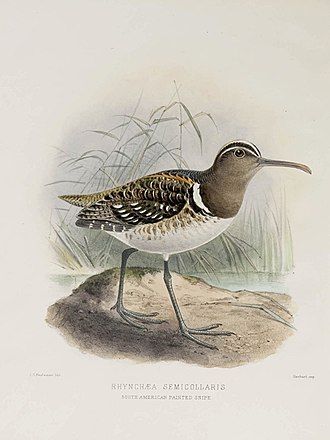
dataset is not the same. Also, our work revolves exactly around the limitations of their work.
  To the best of our knowledge, our work is the first to predict the conservation status using contextual
data in the form of Wikipedia text coupled with taxonomic information using learned features on the
entire animal kingdom.
3     Main Contribution
Some of the works we have seen carefully collate a dataset of species information that includes various
parameters related to geographical information and physical characteristics. Our work mainly focuses on
potentially eliminating the need for manually building handcrafted features by providing implicit features
to our model through learned vector representations. The contribution of this paper is as follows -

    • Learned feature engineering that works on par with state-of-the-art results that use handcrafted
      features.

    • Classifying all animal species with a corresponding confidence score which helps to prioritize
      research while studying various animal species.

    • We generate task-independent distributed vector embeddings for all animal species which can be
      used for many downstream tasks.

3.1     Unsupervised Pre-training
This component is one of the unique things about our framework. We intentionally isolate the embedding
learning phase from the network training phase, hence the name ‘pre-training’. The intuition behind
this is to generate task-independent vector representations for each species describing the animal in a
more generalized manner that can be used for different tasks and not just the one we tackle in this paper.
Arguably, we might achieve better performance if we jointly trained these embeddings along with the
network parameters to minimize the cross-entropy loss on classification, however, our goal is also to
generate a set of distributed embeddings that represent each animal species as a meaningful entity in
vector space.
3.1.1    Document Embeddings
We encode Wikipedia text for each animal species into a fixed d-dimensional vector that learns to capture
the semantics of the text as well as the information it contains. This is largely inspired by Le and Mikolov
(2014). Document or paragraph embedding can be thought of as an extension to word embedding models.
Formally, given a sequence of words w1 , w2 , w3 , ..., wT , the objective of the model is to maximize the
average log probability of predicting the next word

                                        T −k
                                      1 X
                                             log p(wt |wt−k , ..., wt+k )                               (1)
                                      T
                                         t=k

where prediction is done via softmax

                                                                   eywt
                                    log p(wt |wt−k , ..., wt+k ) = P y                                  (2)
                                                                    ie
                                                                        i

and where yi is the un-normalized log probability for each word wi which is computed as

                                    y = U + bh(D, wt−k , ..., wt+k ; W )                                (3)

Usually, the function h is just concatenating or averaging the individual word vectors. The only difference
with document embeddings is that there is an additional column vector D that represents the entire
paragraph or document and is added into the function h.

                                                     296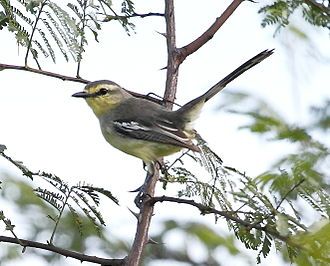
3.1.2       Graph Embeddings
We generate a hierarchical graph from the animal taxonomy data3 . Each node of the graph is associated
with a scientific name and represents a level in the animal hierarchy. So, this relationship starting from
kingdom, sub-kingdom, class, genus, and up to species was generated by retrieving the entire taxonomy
and adding an edge for each new scientific name we encounter. To generate embeddings for the animal
species, we use a random walk procedure to generate multiple sequences that learn to encode the structure
of the node with respect to the graph in a d-dimensional vector. This is highly inspired by Grover and
Leskovec (2016). Here, they seek to maximize the log probability of observing a neighborhood NS (u)
for node u conditioned on its feature vector f
                                           X
                                      max       log p(NS (u)|f (u))                                     (4)
                                        f
                                            u∈V

To make the function tractable, we assume conditional independence of observing a particular neighbor-
hood from any other neighborhood. Mathematically,
                                                    Y
                                 p(NS (u)|f (u)) =        p(ni |f (u))                             (5)
                                                      ni ∈NS

which can be further simplified to

                                                    exp(f (ni ).f (u))
                                  p(ni |f (u)) = P                                                      (6)
                                                    v∈V exp(f (v).f (u))

and optimized using gradient ascent. For a detailed explanation of the random walk procedure, we refer
the reader to Grover and Leskovec (2016).

We concatenate these two embeddings and obtain a vector embedding for each animal species.
This is one of the contributions of this work. Current open-source pre-trained embeddings like Word2Vec,
GloVe, and BERT do not contain embeddings for such words and thus we feel that building meaningful
vector representations that can capture both habitat, as well as genetic information, can be considered
an open research area. We also validate the extent of the correctness and usability of these learned
representations in the following section. Next, they are provided as input features to a neural network to
classify species as endangered or least-concern.
4       Experiment
Figure 1 shows the entire experiment pipeline starting with data collection and preprocessing to generating
embeddings for animal species and finally using this as input for models used for classification of Red List
status of animal species. We discuss three different classifiers because there is not much prior research
in this field, especially using automated feature engineering and machine learning. We explore various
models that attempt to capture different patterns in the data and try to gain various insights from them.
The dataset we have is relatively small, so we chose a Random Forest model since it generally performs
well on smaller datasets. The nature of this problem demands a degree of belief against the predictions we
are making, in the sense that we would like to know if the system predicts a particular animal species to
be endangered, how confidently it makes that prediction. So we implemented a Bayesian neural network
model as well, using a multi-layer perceptron model as a baseline, which gives us a confidence score
associated with the prediction it makes. This is highly intuitive and it can be directly used in correlation
with prioritizing research.
4.1       Data Collection and generating embeddings
The text corpus for training the document embeddings was generated by extracting Wikipedia articles
for every animal species in the animal taxonomy. This corpus was cleaned by retaining only relevant
    3
        https://www.itis.gov/

                                                   297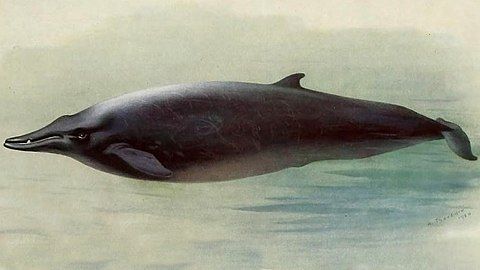
Figure 1: The experiment pipeline

sections and removing unwanted sections like References, See Also, Cited and External Links. The
data was further cleaned by removing the stop words and tokenizing the text into words. The data was
available and collected for 38,000 animal species corresponding to the latest version of the IUCN Red
List available at the time of performing this experiment. Other related statistics of the data have been
summarized in Table 1. We used the Doc2vec model to generate 200-dimensional document embeddings
for each Wikipedia document. We trained the algorithm for 100 epochs with a learning rate of 0.025 and
learning rate decay of 0.002. As mentioned above, using the animal taxonomy a graph was built with
nodes as every taxonomic rank and the edges depicting the relations. We used the Node2Vec model to
generate 200-dimensional node embeddings as explained in section 3.1.2, on this graph. For Node2vec,
the skip-gram model was used with a window size of 3 and trained for 10 epochs.
   All hyper-parameters in both Doc2Vec and Node2Vec algorithms were adjusted to achieve an optimum
trade-off between training time and performance. We perform K-Means clustering to assess the quality of
these embeddings and results show that similar species are indeed being grouped together. Figure 2 shows
scatter plots of randomly chosen 5 out of 3800 clusters after the dimensionality of the embeddings was
reduced from 200 to 2 using the TSNE algorithm. More information on the analysis of clusters of animal
species is provided in Appendix A.

                Metric                                                           Value
                Total animal species                                            45,170
                Endangered animal species                                       10,947
                Least-concern animal species                                    27,053
                Data-Deficient species                                           7,170
                Average length of Wikipedia documents                              146
                in training corpus (number of words)
                Documents with length more than average length                  13,970
                Documents with length less than average length                  31,200
                Documents that explicitly contain Red List status information   14,253
                BNN training data points                                        14,083
                BNN test data points (c ≥ 0.75)                                  3,521

                                       Table 1: Dataset statistics

                                                  298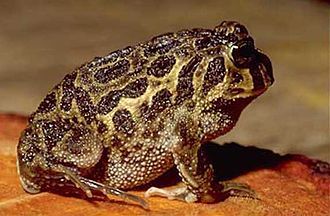
(b) The above figure shows a subset of clusters for docu-
                                                           ment embeddings. The red cluster, among many others,
(a) The above figure shows a subset of clusters for graph
                                                           includes species such as Alice’s Night Frog, Tanzanian
embeddings. The red cluster contains species like False
                                                           Shrew considering similar habitat, the green one includes
Flower Coral, Briar Coral, the Green cluster includes Pa-
                                                           Zebra Dove, Blackstripe Topminnow taking into account
palo Minute Salamander, Golden Thorius, the Blue cluster
                                                           the similar characteristic trait of black bars/stripes, Cyan
has Lightning Man Triplefin, Kermadec Triplefin, the Pink
                                                           cluster includes species such as Yellowpatch Razorfish,
cluster includes Bellmouth Rams-horn, Rough Rams-horn
                                                           Pink-snout Wrasse with similar habitat, Blue cluster has
and, the Cyan cluster has species like the River Night
                                                           Yunnanilus discoloris, Nannobrachium wisneri having
Frog, Bombay night frog, showing similar embeddings
                                                           similar habitat and no English common name and the
for species that belong to the same umbrella in the animal
                                                           Pink cluster includes species like Bubble-nest Frog and
taxonomy.
                                                           Uganda Grassland Frog corresponding to similar habitat
                                                           as well as Order in the animal taxonomy.

              Figure 2: Validation of embeddings using K-means clustering with 3800 clusters.

4.2    Classification
The dataset contains 10 Red List status for the animal species - ‘Critically Endangered’, ‘Endangered’,
‘Extinct’, ‘Extinct in the Wild’, ‘Least-Concern’, ‘Lower Risk/conservation dependent’, ‘Lower Risk/least-
 concern’, ‘Lower Risk/near threatened’, ‘Near Threatened’ and ‘Vulnerable’ Due to lack of data for some,
we merged these statuses to form two classes namely ‘Endangered’ and ‘Least-Concern’. Seven binary
 classifiers were built in total based on Multilayer Perceptron (MLP) and Random Forest. For both MLP
 and Random Forest, the first model took the 200-dimensional graph embedding as input, the second
 one took the 200-dimensional document embedding as input and the third model took the concatenated
400-dimensional embeddings as feature input. The third model performed the best among all. Next, we
 used a Bayesian neural network (BNN) model to improve accuracy for classifications made with high
 confidence and to quantify the confidence. The input was the 400-dimensional embeddings including
 both the document as well as graph embeddings as this input performed the best with MLP. We used
 undersampling to obtain balanced training data as BNN was sensitive to class imbalance.
    IUCN Red List also has Data Deficient species for which there is inadequate information. We perform
 binary classification using the trained models on this dataset as well to show how beneficial our approach
 of representation learning can be in this domain. All the hyperparameters for all the machine learning
 models were chosen using sequential optimization on the ROC-AUC metric using Gaussian processes run
 for 200 epochs with 5-fold cross-validation and 80-20 train-test split.
5     Results
As described above, seven different classifiers were run on the dataset. The results are summarized in
Table 2. Along with document embeddings and graph embeddings performing very well in separate
scenarios with both MLP and Random Forest models, we see that the concatenated 400-dimensional
feature input overall performed the best across the seven classifiers with a high ROC-AUC as well as
F1 and Matthews Correlation Coefficient (MCC) scores. We observed a standard deviation of 0.045
for the random forest model and 0.041 for the neural network model across the trials performed during
hyperparameter optimization.
  The BNN model, along with predicting the class, also outputs a confidence score corresponding to

                                                               299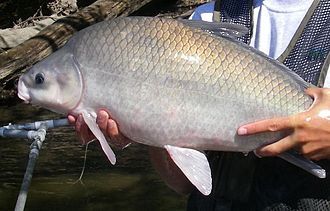
the classification. Our model was run with two confidence thresholds (c), 0.75 and 0.9 as shown in the
table on the same test data of 3,521 animal species. For c ≥ 0.75, the model predicted for 52% of the test
species and for c ≥ 0.9, it predicted for 20% of the test species. The corresponding performance metrics
are shown in Table 2. We see that when the model is confident and chooses to classify the dataset, it gets a
very high F1 Score, MCC and ROC-AUC making its classifications highly reliable. This enables steering
focus towards those animal species that are classified as endangered with high confidence by the BNN
model.
   The MLP and BNN models were run for data-deficient species using the same 400-dimensional input
and out of 7,170 species, 1,040 species were classified as endangered by the model and Figure 3 shows
two of them. The embeddings for all these 7,170 data deficient animal species along with the training and
test embeddings for the scientific names used in this work have been made publicly available for further
research in this domain.

                               (a) Brachycephalus pernix4                  (b) Mesoplodon biden

               Figure 3: Examples of data deficient species classified as endangered by the model5 .

                    Model                                               F1 Score      MCC       ROC-AUC
                    RF w/ node2vec                                         0.862      0.421         0.784
                    RF w/ doc2vec                                          0.869      0.440         0.820
                    RF w/ node2vec + doc2vec                               0.860      0.378         0.827
                    MLP w/ node2vec                                        0.843      0.331         0.729
                    MLP w/ doc2vec                                         0.886      0.568         0.864
                    MLP w/ node2vec + doc2vec                              0.885      0.583         0.873
                    BNN w/ node2vec + doc2vec + c ≥ 0.75                   0.856      0.736         0.868
                    BNN w/ node2vec + doc2vec + c ≥ 0.9                    0.889      0.845         0.911

                                Table 2: MLP and RF models with performance scores

6       Conclusions and Future Work
This work presents a novel approach of using custom embeddings for predicting Red List status with an
intuition of capturing geographical as well as genetic information for all species of the animal kingdom
using a contextual training corpus and hierarchical taxonomy graph data. We propose to use a combination
of document embeddings and graph vector representations that enables the classification of animal species
as being endangered or not with a definite sense of belief. We show that our model performs well with
significant confidence levels which makes it useful in real-world settings. In the future, we plan to obtain
a more scientific text corpus to enhance the quality of the document embeddings, along with using a
hybrid model of learnt features and explicit species metadata. We also plan to implement attention-based
models for both text and graph inputs for better representations and to capture parts of inputs that are of
more importance, making the system more explainable (Zhang and Chen, 2020). We believe that our
framework can assist environmental researchers to further advance the study of animal conservation in the
right direction. This work brings a different approach to research in the cross-domain of natural language
and biology and opens up new paths to involve machine learning in the most interesting and impactful
tasks.
    4
        https://peerj.com/articles/3603/
    5
        All images of animals that are used in this paper have been taken from Wikipedia unless otherwise mentioned

                                                               300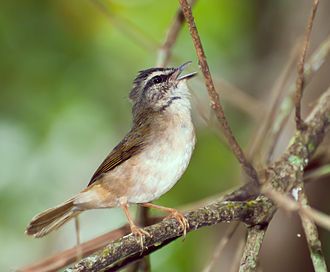
References
Lucie M. Bland, Ben Collen, C. David L. Orme, and Jon Bielby. 2015. Predicting the conservation status of
data-deficient species. Conservation Biology, 29(1):250–259.
Friederike Charlotte Bolam. 2018. Addressing uncertainty and limited data in conservation decision-making.
Qing Cui, Bin Gao, Jiang Bian, Siyu Qiu, and Tie-Yan Liu. 2014. Learning effective word embedding using
morphological word similarity. CoRR, abs/1407.1687.
Walker B. E. Canteiro C. Chadburn H. Davis A. P. Hargreaves S. Lucas E. J. Schuiteman A. Williams E. Bachman
S. P. Baines D. Barker A. Budden A. P. Carretero J. Clarkson J. J. Roberts A. Eimear Nic Lughadha, E. N.
and M. C. Rivers. 2018. The use and misuse of herbarium specimens in evaluating plant extinction risks.
Philosophical Transactions of The Royal Society Biological Sciences, page 374.
Aditya Grover and Jure Leskovec. 2016. node2vec: Scalable feature learning for networks. CoRR,
abs/1607.00653.
Quoc V. Le and Tomas Mikolov. 2014. Distributed representations of sentences and documents. CoRR,
abs/1405.4053.
Tara A. Pelletier, Bryan C. Carstens, David C. Tank, Jack Sullivan, and Anahı́ Espı́ndola. 2018. Predicting plant
conservation priorities on a global scale. Proceedings of the National Academy of Sciences, 115(51):13027–
13032.
Zhang Yijia, Qingyu Chen, Zhihao Yang, Hongfei Lin, and Zhiyong lu. 2019. Biowordvec, improving biomedical
word embeddings with subword information and mesh. Scientific Data, 6, 12.
Yongfeng Zhang and Xu Chen. 2020. Explainable recommendation: A survey and new perspectives. Foundations
and Trends R in Information Retrieval, 14(1):1–101.
Radim Řehůřek and Petr Sojka. 2010. Software framework for topic modelling with large corpora. pages 45–50,
05.
7 Appendix A. Dataset and Analysis
7.1 Document Embeddings
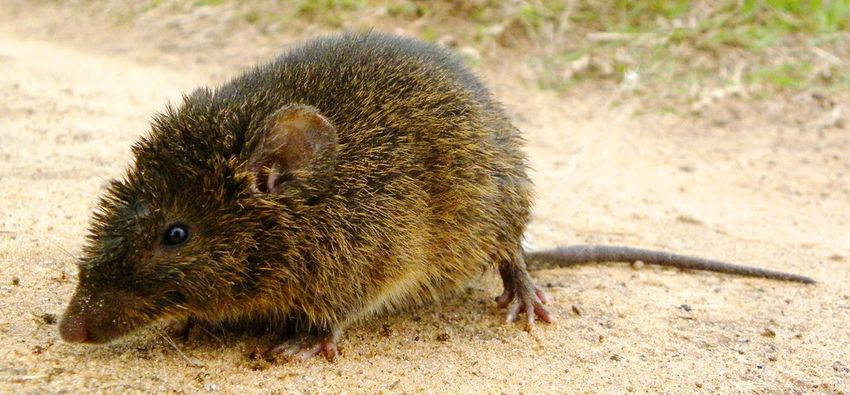
We discuss one cluster in detail to show the analysis and the intuition behind using document embeddings
to generate implicit features. As we see in Figure 4, one of the clusters formed using K-Means has majorly
birds, a reptile, an amphibian, and a rodent. A deep dive into the input can help explain the reason behind
these species being grouped together in the same cluster.
7.1.1 Dataset
We show below, using 1 out of 3,800 clusters, some examples of the input used for generating the
document embeddings.
• Nycticryphes semicollaris - The South American painted-snipe (Nycticryphes semicollaris), or
lesser painted-snipe, is a shorebird in the family Rostratulidae. There are two other species in its
family, the Australian painted-snipe and the greater painted-snipe. Description: Head and neck
dark red-brown with a yellow stripe on the crown; upperparts dark grey-brown, spotted white;
underparts white . Although the female may be slightly larger and brighter, in contrast to the two
other species in the family, the South American painted-snipe is not strongly sexually dimorphic.
It has a relatively long, decurved, bill. It has webbed feet, also a difference from the other painted
snipe. Measurements: 19–23 cm in length; 65–86 g in weight. Vocalizations: A hoarse, hissing
“wee-oo” has been recorded from birds in captivity. Distribution and habitat: The species is found
in the southern third of South America, from southern Brazil, Paraguay, and Uruguay to Chile and
Argentina. It inhabits lowland freshwater wetlands, including wet grasslands. Breeding: South
American painted-snipes are monogamous and breed semi-colonially. The nest is a shallow cup
6
https://focusingonwildlife.com/news/wildfocus/featured/xx-yvyjau-dsc 0335/
7
https://www.flickr.com/photos/tags/oxymycterus/
301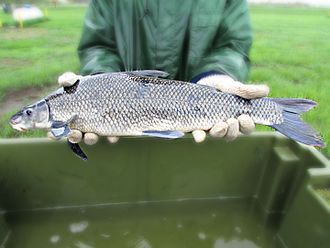
(a) Amazilia chionogaster           (b) Phylloscartes ventralis           (c) Erinaceus concolor

     (d) Setopagis parvula6            (e) Pteroglossus inscriptus          (f) Oxymycterus rufus7

  (g) Nycticryphes semicollaris      (h) Odontophrynus americanus          (i) Stigmatura budytoides

    (j) Myiothlypis rivularis          (k) Charadrius falklandicus          (l) Stigmatura napensis

  (m) Tympanocryptis centralis      (n) Pseudocolopteryx flaviventris

             Figure 4: Example cluster from document embeddings K-means clustering.

  on the ground in a wetland, with a clutch of 2-3 eggs. Breeding has been recorded mainly from
  July to February. Feeding: The South American painted-snipe is omnivorous, feeding by probing
  in mud and shallow water for small animals and seeds, often at dusk. Status: The South American
  painted-snipe has traditionally been regarded as a desirable game-bird in Chile and Argentina and
  has been regularly hunted. It is an uncommon species in its wide range and may be threatened
  by drainage of wetlands and other habitat degradation. However, there has been no documented
  significant decline in population and the species’ conservation status remains at one of Least Concern.

• Oxymycterus rufus - The red hocicudo (Oxymycterus rufus) is a rodent species from
   South America. It is found in Argentina, Brazil and Uruguay . Ecology: The red hocicudo has been
  found to be one of the most heavily ectoparasite-infested rodents in a village studied in the Paraná

                                                  302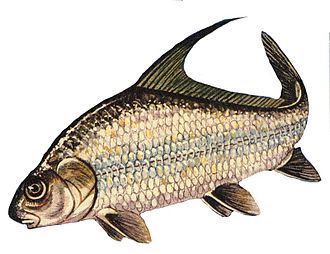
Delta area. Of the species of rodent caught, it ranked top alongside the Azara’s grass mouse (Akodon
        azarae). In the tests, 585 fleas were found, 2404 ticks in the family Ixodidae, 2603 mites in the order
        Mesostigmata and 3745 lice. In another study in a marshy area of Buenos Aires Province, 93 percent
        of the red hocicudos studied had parasites, with eight species of parasitic arthropod being detected.
  • Odontophrynus americanus- Odontophrynus americanus (common names: common lesser escuercito,
    American ground frog) is a species of frog in the family Odontophrynidae. It is found in central
    and northern Argentina, Uruguay, southern Brazil, and southern Paraguay . It is tetraploid; diploid
    populations have been described as a new species, Odontophrynus cordobae.Odontophrynus ameri-
    canus is common throughout much of its range. It occurs in open grasslands and savannas. It is a
    fossorial species, but during the breeding season, these frogs are found at shallow, temporary ponds
    and flooded areas. Males can be heard calling at night from the edge of, or from within the water.
    The species tolerates substantial habitat disturbance and no significant threats have been identified.
  • Erinaceus concolor - The southern white-breasted hedgehog (Erinaceus concolor), sometimes
        referred to as white-bellied hedgehog or white-chested hedgehog , is a hedgehog of Southwestern
        Asia. It is very similar in lifestyle and appearance to the European hedgehog, but the former has a
        white spot on its chest. For a long time these two species were considered to be one. The northern
        white-breasted hedgehog of Eastern Europe and Russia was formerly recognized as a subspecies of
        the southern white-breasted hedgehog but newer investigations see both as different species. The
        southern white-breasted hedgehog and European hedgehog can hybridize. Unlike its European
        counterpart, the southern white-breasted hedgehog never digs dens. It prefers building grass nests in
        secluded places.
  • Tympanocryptis centralis - Tympanocryptis centralis, also known as central Australian earless dragon,
    is one of 15 documented species of a relatively small dragon belonging to the genus Tympanocryptis.
    This is a common species, with an apparently stable population. Habitat: This species utilizes a
    variety of desert habitats, but is most often found in association with stony ranges. Often takes shelter
    in spinifex, but can also be found in Eucalypt shrubland.It is found in the Northern Territory, South
    Australia, and Western Australia. Etymology: Tympanocryptis: ‘hidden ear’. Centralis: ‘centralian’,
    referring to the central distribution.
  • Amazilia chionogaster - The white-bellied hummingbird (Amazilia chionogaster) is a species of
    hummingbird in the family Trochilidae. It is found at forest edge, woodland, scrub and gardens in
    the Andes, ranging from northern Peru south through Bolivia to north-western Argentina . There
        are also lowland populations in Santa Cruz, Bolivia, and Mato Grosso, Brazil . It is generally fairly
        common. Description: Its upper parts are green and its underparts are white . Unlike other similar
        hummingbirds in its range (for example the green-and-white hummingbird), the basal half of the
        inner webs of the rectrices are white, but this is typically only visible from below.
7.1.2      Analysis
We see that characteristic traits like a white underbelly (highlighted in orange) contribute to similar
document embeddings for species such as Amazilia chionogaster, Erinaceus concolor and Nycticryphes
semicollaris. Also, most of the species from the example inputs share South American habitat (highlighted
in yellow) along with the type of habitat. These are some of the keywords related to habitat and traits we
wanted to bring out to aid classification and document embeddings seem to work really well for the same.
7.2      Graph Embeddings
We discuss one cluster in detail to show the analysis and the intuition behind using graph embeddings to
generate implicit features. As we see in Figure 5, this example cluster consists mostly of different fishes
belonging to different genus.
   8
       https://www.fishbase.de/summary/Carpiodes-velifer.html
   9
       https://tnacifin.com/fish/southeastern-blue-sucker-cycleptus-meridonalis

                                                              303
(a) Carpiodes velifer8 (b) Ictiobus bubalus (c) Cycleptus elongatus
(d) Ictiobus niger (e) Ictiobus cyprinellus (f) Cycleptus meridionalis9
(g) Carpiodes carpio (h) Carpiodes cyprinus
Figure 5: Sample cluster from graph embeddings K-means clustering
7.2.1 Dataset
We show below a subgraph to visualize a part of the input used for generating the graph embeddings
choosing 1 out of 3,800 clusters randomly.
Figure 6: An example for the input used for graph representation learning.
7.2.2 Analysis
Along with encoding the hierarchical relationship information as seen from the example cluster, the
intuition behind concatenating these with the document embeddings is brought out in this same example.
Ictiobus bubalus and Ictiobus niger belong to the same cluster for their corresponding document embed-
dings sharing the cluster with no other species and thus giving no further information related to other
similar animal species. With graph embeddings concatenated with document embeddings, we get a whole
304new chain of similar species and thus adding more dimensionality to the features.
305You can also read