Towards the reestablishment of community equilibrium of native and non-native landbird species in response to pest control on islands in the ...
←
→
Page content transcription
If your browser does not render page correctly, please read the page content below
437

Notornis, 2020, Vol. 67: 437-450
0029-4470 © The Ornithological Society of New Zealand Inc.

Towards the reestablishment of community equilibrium of
native and non-native landbird species in response to pest
control on islands in the Eastern Bay of Islands, New Zealand

C. JOHN RALPH*
Moturoa Island, Private Bag, Paihia, New Zealand
U.S. Forest Service, Redwood Sciences Laboratory, Arcata, California 95521, USA

CAROL P. RALPH
7000 Lanphere Road, Arcata, California 95521, USA

LINDA L. LONG
U.S. Forest Service, Redwood Sciences Laboratory, Arcata, California 95521, USA

Abstract: Disequilibrium of bird communities, due to introduced pests and human-caused habitat changes, is a
fundamental property to be understood in restoration of island biota. In this paper, we suggest that the reestablishment
of native forests and food webs favour long-established and native species, and is less favourable to more recently
introduced species. To test this hypothesis, we compared population trends of native and non-native birds on five islands
in the Ipipiri Group in the north of New Zealand. We used over 900 station counts starting in 2008 when habitat recovery
and pest (rat [Rattus], mouse [Mus musculus], and stoat [Mustela erminea]) removal began, as well as comparing to a set
of earlier counts. In general, we found that detection rates of most long-established endemic native species significantly
increased, while non-native species mostly decreased, suggesting population increases and decreases, respectively. Of
the native species, six are relatively recent natural immigrants to New Zealand, and most of these declined or remained
unchanged. We suggest that the increase in long-established natives is likely due to increased size and quality of native
bush areas making habitat more favourable to these natives, as well as reduced predation and competition from the pest
mammals.
Ralph, C.J.; Ralph, C.P.; Long, L.L. 2020. Towards the reestablishment of community equilibrium of native and non-native
landbird species in response to pest control on islands in the Eastern Bay of Islands, New Zealand. Notornis 67(2): 437-450.
Keywords: bird, island, New Zealand, community equilibrium, introduced species, pest eradication, restoration, Bay of
Islands

INTRODUCTION                                                    form of equilibrium is perhaps analogous to the
Efforts to reestablish native bird populations in New           “ecological integrity” of Lee et al. (2004) which
Zealand attempt to shift the present community                  they define as “the full potential of indigenous
structure by removing predators, improving                      biotic and abiotic factors, and natural processes,
vegetation, and reintroducing bird species. This                functioning in sustainable communities, habitats,
process would, at least partially, return community             and landscapes.”
composition to more stable, earlier, stages. This                   The reestablishment of bird species that
                                                                have become locally extinct is a central theme of
Received 12 October 2019; accepted 28 November 2019             conservation ecology in New Zealand, especially
*Correspondence: cjralph@xtra.co.nz                             on islands (Parker 2013). These islands have been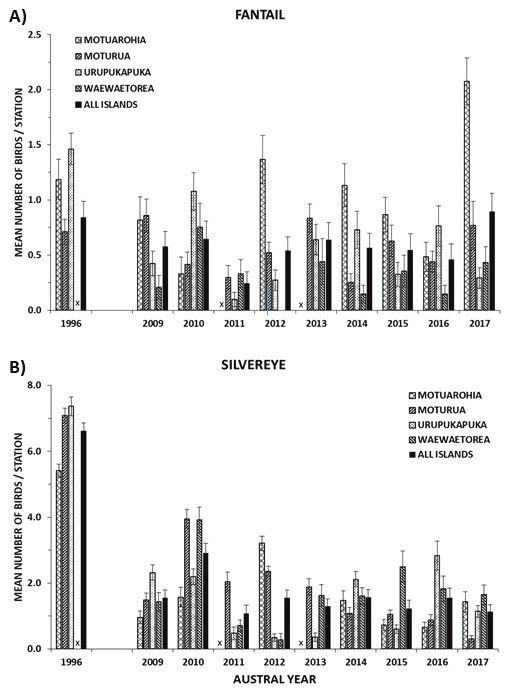
438     Ralph et al.

actual islands, or areas of habitat surrounded by a       to Moturua in June 2017. North Island brown
predator-proof fence. When pests are removed from         kiwi (Apteryx mantelli) are not sampled by diurnal
an island, and native trees and shrubs are planted        counts, and have been introduced on Moturua and
and regeneration occurs, it is envisaged that             Motuarohia.
native ecosystems will be restored and previous               We refer to three groups of birds as: (1) the
niches for birds recreated. In this event, we would       “non-native” species, introduced from outside of
predict that: (1) most native birds (especially forest    New Zealand in the past 150 years; (2) the endemic
species) would increase; (2) translocated species,        “native” species that have evolved in New Zealand;
reintroduced onto the islands, would also increase:       and (3) the “recent immigrants,” species that have
and (3) exotic, non-native (introduced in the last 150    relatively recently colonized New Zealand, and
years) species would decrease. These predictions          have diverged only slightly from their Australian
are basic tenets of restoration ecology, with tests of    relatives.
these recorded on few occasions in New Zealand,
by following pest control actions with monitoring,
in order to assay the efficacy of the actions and to      Objectives
guide management (Towns 1991; Girardet et al.             It is a basic requirement of introduction science that
2001; Innes et al. 2010; Green et al. 2011; Graham et     the species will be monitored after introduction,
al. 2013; Miskelly 2018).                                 to make adaptive management possible. Bird
                                                          monitoring is also a primary objective of Project
                                                          Island Song to determine long-term responses
Background                                                of fauna and flora to pest eradication in the Bay
The seven islands and many smaller islets that            of Islands. From this monitoring, we expected to
make up the Ipipiri Group (Fig. 1) in the eastern Bay     find an increase in both bird numbers and species
of Islands, northeast of Russell, have importance         as predation and competition from rats, mice, and
historically and now increasingly, biologically.          stoats are suddenly absent. This study contributes
After settlement and grazing for more than 100            to the testing of this hypothesis.
years, the past 50 years have seen a gradual change
with decreased grazing and increased planting
of native trees and shrubs. Grazing ended and             MATERIALS AND METHODS
planting began on most of the islands about 2000          Common and scientific names of birds follow the
(for details see Project Island Song 2014). Grazing       Ornithological Society of New Zealand (Te Papa;
continues today only in a fenced area of about            Birds New Zealand; New Zealand Department of
one-third of Urupukapuka Island. Birds are an             Conservation 2013) Checklist of New Zealand birds –
important part of the biota, for which counts were        http://www.nzbirdsonline.org.nz.
conducted on several of these islands for 18 months
in 1995–96 by David Tindall (Tindall 1996). The           Study area and pest control treatment
islands experienced a major ecological shift in June      We counted birds in eight routes on five of the
2009 with a concentrated pest control programme           islands in the Ipipiri group (Fig. 1). They have
(Towns et al. 2013), under the aegis of “Project Island   differing land uses, conservation status, and
Song,” a collaboration between organizations and          vegetation.
individuals to restore the native birds and habitats          Urupukapuka Island (229 ha) is in predominately
(Project Island Song 2014). Thus, began one of the        public conservation status. The main vegetation
more ambitious conservation experiments in the            type is regenerating manuka (Leptospermum
country. To monitor its effects, we report here on        scoparium) and kanuka (Kunzea ericoides)
bird counts started in November and December              shrubland, extensive grasslands of the introduced
2008 before the eradication, and continued on for         kikuyu (Pennisetum clandestinum), and a forest of
nine years through January 2017.                          pohutukawa (Metrosideros excelsa) that occupies the
    Between 2012 and 2016, five species have been         coastal fringe. Extensive planting of native shrubs
reintroduced to various islands of Ipipiri: brown teal    and trees has occurred. Livestock grazing occurs
(Anas chlorotis) to Urupukapuka in September 2012;        on approximately a third of the island to maintain
North Island robin (Petroica longipes) to Moturua         open space. There is some wetland habitat created
in 2014 (to augment 16 released in 1986, from the         in the 1980s.
Mamaku Plateau) and to Urupukapuka in July                    Moturua Island (166 ha) is largely a scenic
2016; whitehead (Mohoua albicilla) to Motuarohia          reserve. The vegetation is dominated by manuka/
in May 2015 and to Urupukapuka and Moturua in             kanuka shrubland with pohutukawa along the
April 2016; North Island saddleback (Philesturnus         coast. It is more advanced in succession than the
rufusater) to Moturua and Urupukapuka in March            other islands and is developing a more diverse
2015 (from Lady Alice Island) and May 2015 (from          understory of coastal broadleaf forest augmented
Tiritiri Matangi Island); and since our study, red-       by planting of native shrubs and trees.
crowned parakeet (Cyanoramphus novaezelandiae)
Island landbird community after pest control 439
Motuarohia/Roberton Island (63 ha) is mostly (2006). This protocol covers most landbird species
private with about 30% public conservation land. and involved a ten-minute count, consisting of
Vegetation consists of kikuyu grass flats, kanuka two consecutive 5-minute standardised morning
native shrub hardwood forest, and extensive stands counts at each station, usually about 100 m apart on
of maritime pine (Pinus pinaster) with a regenerating eight established routes, during fine weather. Birds
understorey of native shrub hardwoods that are flying overhead were counted if they were judged
mainly hangehange (Geniostoma ligustrifolium) and to be using the habitat of the count circle of 100 m.
Coprosma spp. Additional species of waterbirds were tallied but
Waewaetorea Island (55 ha) is uninhabited and not included in most analyses unless their principal
managed as a Scenic Reserve. Grasslands are the habitat was on land. Most routes consisted of 15
dominant feature with kikuyu as well as native stations (Table 1): Motuarohia (Roberton) (2 routes,
grasses. The remaining habitat is composed of one added in 2015); Moturua (2 routes); Okahu (1
stands of regenerating manuka/kanuka forest route of 6–9 stations – infrequently counted and
situated mainly on the south western face and not included in the “all islands” totals below);
coastal pohutukawa. Urupukapuka (2 routes); and Waewaetorea (1
Okahu Island (27 ha) is uninhabited and has route). In some years, a few stations were repeated,
grassland, some regenerating manuka/kanuka, missed, or added, such as on Waewaetorea and
and coastal pohutukawa. Okahu to better sample bush and wetter areas.
In June 2009, the New Zealand Department Many of the stations were those originally surveyed
of Conservation performed an aerial drop of the by David Tindall in 1995–1996 (Tindall 1996; Tindall
poison bait Brodifacoum by helicopter with the et al. 2007), and those data (referred to as the 1996
goal of removing pests, namely stoats (Mustela data) are included for the three islands counted in
erminea), mice (Mus musculus), and three species of both periods (Table 1). Over the nine years (2009–
rats (Rattus spp.) from the islands. They targeted 2017) of continuous pest monitoring and control,
seven islands and numerous islets, including the the bird counts were done mostly by volunteers
five islands which we subsequently monitored for from the Ornithological Society of New Zealand
changes in bird populations. In the subsequent eight (Birds New Zealand), Guardians of the Bay, staff
years, through 2017, they conducted continuous from the Department of Conservation (DOC), and
monitoring for reinvasions, followed immediately others, working together to inform Project Island
by focused eradication programmes if a pest was Song and DOC.
detected. During the first three years after treatment,
they detected and removed a total of 16 incursions
of rats, mice, stoats, and cats (Towns et al. 2013). Data limitations
As was the case with Miskelly’s (2018) work, in
our study a team of volunteers conducted the
Point Counts counts, each with varying levels of ability to
More than 900 station counts (Table 1) were detect and recognise bird calls. This necessitated
conducted on five islands. We followed the protocols adjustments in study methods and design. The
in Vestena (2009) and the specifics in Spurr & Ralph first was to use the basic fixed-radius (of 100 m)
Figure 1. The islands of the Ipipiri group with count transects routes shown in lines on the aerial photograph from
Google Earth.440 Ralph et al.
Table 1. Number of station-mornings of the monitoring stations by island-route and austral year. In some years some
routes had stations that were counted more than once.
Island-route 1996 2009 2010 2011 2012 2013 2014 2015 2016 2017 Total
Motuarohia East 0 15 15 0 15 0 15 11 16 0 87
Motuarohia West 15 0 0 0 0 0 0 15 13 30 73
Moturua East 15 15 15 15 15 15 15 15 21 29 170
Moturua West 15 15 15 4 15 14 15 13 18 30 154
Okahu 0 6 0 6 10 0 0 11 11 0 44
Urupukapuka East 15 15 14 15 15 15 16 13 15 33 166
Urupukapuka West 15 15 19 0 15 15 15 15 15 28 152
Waewaetorea 0 11 15 15 11 12 15 14 15 30 138
TOTAL 75 92 93 55 96 71 91 107 124 180 984
bird count technique (Dawson & Bull 1975) where one station on one morning) and dividing by the
all detections are used, rather than a more complex number of stations counted to calculate the mean
distance-sampling methodology that may have number (± standard error) of birds per station-
allowed calculation of absolute density estimates morning per austral year. This mean was calculated
for a smaller subset of focal species (e.g. Greene & for all islands combined as well as by individual
Pryde 2013). Such bird counts as ours do not provide island, combining routes if two routes were
a measure of absolute or relative abundance, but surveyed on an island. For the analysis below, we
do provide a readily collected index of abundance primarily used this latter metric which we termed
and conspicuousness (or ‘encounter rate’) suitable an “island-species combination.” If a species was
for comparisons within the same species over time present on all islands with an analysis involving
or between habitats (Dawson & Bull 1975; Verner five islands, it would have five such combinations.
1985; Koskimies & Väisänen 1991; Ralph et al. 1995). All calculations were done on log-transformed
This survey methodology was chosen as the most values. We calculated r2 values, regression slope
practical way to survey the diverse bird community estimates, and regression significance levels for
present on the islands (see also Johnson 2008). each island-species combination using Proc Reg in
Most often, to ensure good coverage two SAS (SAS Institute 2012).
people counted each station together with one
primarily recording and the other listening and
looking. Of the two people, one was usually RESULTS
highly experienced. If this was not possible, two Of the more than 20,000 birds counted (Table
moderately experienced observers were paired 2), tui (Prosthemadera novaeseelandiae) was the
together. We found that, as they interacted, the most common, with more than 4,800 individuals
strengths of each observer complemented the other. recorded. Three native species (i.e. silvereye
Further, as we examined the data, we found a high [Zosterops lateralis], grey warbler [Gerygone igata],
degree of similarity between experienced observers and welcome swallow [Hirundo neoxena]), and the
and less experienced counters when comparing introduced common myna (Acridotheres tristis) and
numbers of individuals and species on an island house sparrow (Passer domesticus), all tallied more
between years. than 1,000 individuals each. The native New Zealand
fantail (Rhipidura fuliginosa) and two introduced
species each had more than 500 individuals. Overall,
Statistical analysis 47 species were tallied (including 35 landbirds),
For this analysis, we used data collected in the austral many of them with multiple individuals seen, and
summer months of December and January. Data many species observed in most years.
were divided into “Austral Years” in order to define During the nine years of pest control, of 122
the summer breeding season more conveniently for possible island-species combinations for the most
analyses; for example, counts in December 2008 and abundant 27 landbird species (those with 50 or more
January 2009 would be considered to be in Austral total birds observed, Table 2), 51 (42%) significantly
Year 2009. Thus, the counts in austral year 2009 increased or decreased (“Individual Islands”
were conducted prior to pest control treatment in columns in Table 3) as community equilibrium was
June 2009. being established. By chance alone, one would have
The mean values for species were calculated expected fewer than seven to have significantly
by summing the number of birds recorded each changed (5% of 122 = 6.1).
station-morning (the number of individuals atTable 2. Mean number of individuals recorded per 10-minute count per station in each Austral Year from 1996, and 2009–2017 in order of total abundance. Landbird
species with more than a grand total of 50 individuals observed during the study were included in our analysis. Status of landbirds in study: E = endemic, R = recent
immigrant, N = non-native.
Austral year Mean/ Total
Common name Scientific name Status 1996 2009 2010 2011 2012 2013 2014 2015 2016 2017 station indiv.
Tui Prosthemadera novaeseelandiae E 1.07 2.29 3.41 3.65 4.03 4.35 5.92 7.21 6.98 6.32 4.90 4,818
Silvereye Zosterops lateralis R 7.48 2.15 3.86 1.65 2.14 1.73 2.15 1.71 3.60 1.64 2.70 2,657
Grey warbler Gerygone igata R 2.19 2.37 1.77 2.29 2.23 2.34 1.64 1.49 1.74 2.07 1.81 1,785
Common myna Acridotheres tristis N 4.87 1.52 2.98 3.27 1.79 0.92 1.99 1.08 1.73 0.98 1.92 1,888
Welcome swallow Hirundo neoxena R 0.93 1.13 0.83 1.05 0.79 0.93 1.41 1.17 1.89 1.68 1.19 1,171
House sparrow Passer domesticus N 1.32 0.92 1.56 0.25 0.55 0.14 1.73 1.36 1.19 1.06 1.06 1,045
New Zealand fantail Rhipidura fuliginosa R 1.33 0.79 1.05 0.33 0.69 0.96 0.81 0.87 0.87 1.36 0.96 942
Eurasian blackbird Turdus merula N 2.49 1.74 0.54 0.47 1.04 1.07 0.62 0.89 0.70 0.41 0.92 910
Chaffinch Fringilla coelebs N 1.04 1.09 0.27 0.93 1.26 1.10 0.51 0.91 0.35 0.32 0.71 697
Sacred kingfisher Todiramphus sanctus R 0.35 0.60 0.46 0.55 0.56 0.30 0.57 0.41 0.22 0.25 0.38 371
Yellowhammer Emberiza citrinella N 0.28 0.58 0.42 1.07 0.61 0.52 0.27 0.23 0.20 0.07 0.36 355
Tomtit Petroica macrocephala E 0.00 0.04 0.03 0.49 0.31 0.70 0.78 0.56 0.31 0.37 0.36 350
European goldfinch Carduelis carduelis N 0.63 0.28 1.02 0.33 0.30 0.17 0.58 0.16 0.06 0.15 0.34 331
Pukeko Porphyrio melanotus R 0.61 0.45 0.24 0.09 0.23 0.28 0.52 0.26 0.15 0.45 0.34 330
Red-billed gull Chroicocephalus scopulinus E 0.00 0.16 1.98 0.02 0.08 0.04 0.22 0.10 0.11 0.22 0.30 296
Eastern rosella Platycercus eximius N 0.07 0.08 0.38 0.05 0.15 0.21 0.16 0.37 0.58 0.35 0.27 269
Song thrush Turdus philomelos N 0.79 0.34 0.34 0.18 0.43 0.11 0.14 0.28 0.06 0.11 0.25 250
Eurasian skylark Alauda arvensis N 0.65 0.30 0.12 0.15 0.21 0.14 0.22 0.19 0.03 0.19 0.21 205
Southern black-backed gull Larus dominicanus R 0.00 0.16 0.41 0.18 0.17 0.24 0.21 0.10 0.23 0.26 0.20 200
Dunnock Prunella modularis N 0.84 0.28 0.13 0.16 0.17 0.35 0.09 0.09 0.15 0.02 0.19 191
Pied shag Phalacorcroax varius R 0.00 0.08 0.02 0.02 0.42 0.31 0.44 0.21 0.26 0.12 0.19 189
North Island saddleback Philesturnus rufusater E 0.00 0.00 0.00 0.00 0.00 0.00 0.00 0.00 0.32 0.69 0.17 164
Variable oystercatcher Haematopus unicolor E 0.00 0.16 0.40 0.04 0.22 0.04 0.20 0.23 0.12 0.09 0.16 153
European greenfinch Carduelis chloris N 0.24 0.05 0.45 0.00 0.23 0.08 0.15 0.03 0.06 0.12 0.14 139
European starling Sturnus vulgaris N 0.13 0.24 0.12 0.29 0.11 0.21 0.12 0.07 0.03 0.06 0.12 117
Whitehead Mohoua albicilla E 0.00 0.00 0.00 0.00 0.00 0.00 0.00 0.00 0.17 0.50 0.11 111
Shining cuckoo Chrysococcyx lucidus R 0.01 0.10 0.00 0.40 0.19 0.37 0.03 0.10 0.01 0.07 0.10 103
Island landbird community after pest control
Brown quail Coturnix ypsilophora N 0.36 0.11 0.00 0.00 0.19 0.00 0.10 0.10 0.03 0.07 0.09 91
North Island robin Petroica longipes E 0.05 0.03 0.02 0.07 0.00 0.04 0.00 0.21 0.06 0.15 0.07 73
441Table 2. cont.
442
Austral year Mean/ Total
Common name Scientific name Status 1996 2009 2010 2011 2012 2013 2014 2015 2016 2017 station indiv.
New Zealand pipit Anthus novaeseelandiae E 0.01 0.03 0.00 0.02 0.02 0.10 0.03 0.06 0.15 0.13 0.07 64
New Zealand dotterel Charadrius obscurus E 0.00 0.03 0.04 0.02 0.13 0.03 0.14 0.11 0.07 0.03 0.06 62
Ralph et al.
Swamp harrier Circus approximans R 0.03 0.05 0.00 0.04 0.05 0.03 0.08 0.16 0.06 0.06 0.06 57
Ring-necked pheasant Phasianus colchicus N 0.00 0.10 0.04 0.11 0.04 0.06 0.05 0.04 0.01 0.01 0.04 38
Australasian gannet Morus serrator R 0.00 0.01 0.03 0.00 0.00 0.01 0.01 0.02 0.01 0.10 0.03 27
Spur-winged plover Vanellus miles R 0.00 0.00 0.01 0.00 0.00 0.01 0.08 0.07 0.05 0.00 0.02 23
Little shag Phalacrocorax melanoleucos R 0.00 0.02 0.08 0.00 0.00 0.00 0.00 0.00 0.01 0.03 0.02 15
Brown teal Anas chlorotis E 0.03 0.00 0.01 0.00 0.00 0.00 0.00 0.00 0.02 0.03 0.01 11
Australian magpie Gymnorhina tibicen N 0.00 0.00 0.00 0.05 0.05 0.00 0.00 0.00 0.01 0.01 0.01 10
White-fronted tern Sterna striata E 0.00 0.01 0.04 0.02 0.00 0.03 0.00 0.01 0.00 0.01 0.01 10
New Zealand pigeon Hemiphaga novaeseelandiae E 0.00 0.02 0.06 0.00 0.00 0.00 0.00 0.01 0.00 0.01 0.01 10
California quail Callipepla californica N 0.04 0.03 0.00 0.04 0.01 0.00 0.00 0.00 0.00 0.01 0.01 10
Banded rail Gallirallus phillipensis R 0.00 0.00 0.00 0.00 0.00 0.00 0.02 0.01 0.02 0.02 0.01 8
Common redpoll Acanthis flammea N 0.00 0.00 0.05 0.02 0.01 0.00 0.00 0.00 0.00 0.00 0.01 7
Paradise shelduck Tadorna variegata E 0.00 0.02 0.00 0.00 0.02 0.03 0.00 0.00 0.00 0.00 0.01 6
Caspian tern Hydroprogne caspia R 0.00 0.01 0.00 0.00 0.00 0.01 0.01 0.00 0.00 0.00 0.00 3
Morepork Ninox novaeseelandiae R 0.00 0.00 0.00 0.02 0.00 0.00 0.00 0.00 0.00 0.01 0.00 3
Black-billed gull Larus bulleri E 0.00 0.00 0.00 0.00 0.00 0.00 0.00 0.00 0.01 0.00 0.00 1
TOTAL INDIVIDUALS 2,088 1,693 2,262 1,049 1,880 1,282 2,006 2,238 2,815 3,721 21,034Table 3. Population trends of native and non-native landbird species, for all islands combined and for individual islands. Trends are shown by two time periods: 2000s
(2009–2017) for 5 islands, and 1996 & 2000s (1996, 2009–2017) for three islands. If two routes occurred on an island, the data were combined. Codes after native species
names: E = endemic, R = recent immigrant.
2000s 1996 & 2000s
All islands1 Individual islands2 All islands Individual islands
Common name (n=5) Decreasing Increasing (n=3) Decreasing Increasing
Native Species
Shining cuckoo R -- Xxxx ns x xx
Pukeko R ns Xx xxx -- Xxx
Swamp harrier R + XXxxx ns x xx
Sacred kingfisher R --- XXxxx ns x xx
Tui E +++ XXXXX +++ XXX
Grey warbler R --- XXxxx --- XXx
North Island saddleback E +++ XX +++ XX
Whitehead E +++ XX +++ Xx
New Zealand fantail R ns xxx xx --- Xxx
Tomtit E +++ x XXx +++ XXX
North Island robin E ++ XXx ns xxx
New Zealand pipit E +++ XXxxx ++ x Xx
Welcome swallow R ++ Xxxxx ns Xxx
Silvereye R --- Xxx xx --- XXX
Non-native Species
Brown quail ns xxx --- XXx
Eastern rosella +++ XXXxx +++ XXx
Dunnock -- Xxx xx --- XXx
House sparrow ++ Xx XXX ns Xx X
Chaffinch --- XXXx x --- XX x
European greenfinch -- Xxx xx -- X xx
European goldfinch --- XXXxx --- XXx
Yellowhammer --- XXXxx - Xx x
Eurasian skylark -- Xxx x --- XX
European starling --- XXxxx ns xx x
Island landbird community after pest control
Common myna --- Xxxx x --- XXX
Song thrush --- Xxxx --- XXX
Eurasian blackbird --- XXXx x --- XXX
443
1
Significance of increasing (+) or decreasing (-) trends for all islands combined are indicated by: P < 0.05: + or - ; P < 0.01: + + or - - ; P < 0.001: + + + or - - -; non-significant trend: ns.
2
Each island where the species was found is represented with an “x” under either Decreasing or Increasing trend. Significant trends (P < 0.05) were indicated by a capital “X”.444 Ralph et al.
Native species
Of the 14 native landbird species, eight increased
significantly during the pest control period
in the all islands combined analysis (Table 3).
Four native species (i.e. grey warbler, shining
cuckoo [Chrysococcyx lucidus], sacred kingfisher
[Todiramphus sanctus]), and silvereye, decreased
significantly. Fantail and pukeko (Porphyrio
melanotus) showed no trends. The latter six species
were classified as recent immigrants. Comparing
the 1996 counts with the pest control period on
all islands produced a mixed result as five species
increased, four decreased, and five showed no
change on the three islands monitored in all years
(Table 3).
Species that Increased.
Of the eight increasing species, saddleback and
whitehead were introduced after the pest control
period, and, as expected, had significant increases
(Table 3). The other six increasing natives – tui,
tomtit (Petroica macrocephala), North Island robin,
swamp harrier (Circus approximans), New Zealand
pipit (Anthus novaeseelandiae), and welcome swallow
– are detailed below.
Tui was the most-frequently observed species
and it increased considerably for all islands and
routes combined (Fig. 2A). This increase was highly
significant (P < 0.001; Table 3). During the period
since pest control began, this conspicuous and
aggressive bird has nearly tripled in numbers; over
the 20-year period, it has increased even more.
Tomtit (Fig. 2B) has had remarkable and
significant (P < 0.001; Table 3) increases as it self-
introduced into the islands. This native species had
not been detected in the 1996 counts, before pest
control. It was confirmed to be breeding on Moturua
in December 2008 (Ralph et al. 2008). Since then, it has
rapidly increased on Moturua, spreading on its own
to Urupukapuka, and most recently to Motuarohia
(Fig. 2B). It was even detected occasionally on
small Okahu Island (in 2011 and 2012). The species
initially had a population increase on Moturua and, Figure 2. The mean number (± se) of birds seen or heard on
as is typical of species recently introduced, they the 10-minute station counts on four islands of the Ipipiri
have since apparently stabilized at a lower level. group and the overall mean (All Islands). “X” = island was
North Island robin on Moturua Island had not counted in that year; A) tui, B) tomtit, C) North Island
maintained a very small population (Fig. 2C), robin.
since an introduction of this native in February
1986 (Project Island Song 2014). It was missed by its own as has the tomtit, but it seems relatively
counts in two years during the last nine years of sedentary, as its many decades solely on Moturua
pest control. However, the introduction of new Island show.
birds in the winter of 2014 on Moturua resulted in Swamp harrier and welcome swallow both
an immediate increase in the 2015 count, followed increased during the pest control project (Table
by fewer the next year, and increases in 2017. An 3; Appendix 1). When including the earlier 1996
introduction in 2016 on Urupukapuka resulted counts, however, they showed no significant
in birds detected in 2017. Birds are now thinly increase. New Zealand pipit increased markedly
scattered in good bush habitat throughout the two (Table 3; Appendix 1), in both comparisons.
islands. The robin might be expected to spread onIsland landbird community after pest control 445
Species that were Unchanged or Declined. and also when including the 1996 counts over the
New Zealand fantail was a common bird (Fig. 3A), 20-year study period for all islands combined (P <
and, with its confiding nature, we probably have 0.001; Table 3), and at all three individual islands.
excellent detection rates with few birds missed Pukeko showed mixed results, with a significant
by observers. Overall, with all islands combined, decrease from 1996 through the 2000s (P < 0.01;
abundance was unchanged through the 2000s after Table 3; Appendix 1), but no significant change
pest removal (P > 0.05; Table 3), counts usually, on during the 2000s.
average, between 0.5 and 1.0 birds per station (Fig. The other decreasing native species (Table
3A). Looking at each of four of the islands during 3; Appendix 1) were sacred kingfisher, shining
this time period (Fig. 3A), the population had no cuckoo, and grey warbler, all declined during the
consistent pattern between islands or years. Only pest control period, depending upon the analysis.
in 2011 was there a consistently lower count on the
three islands. The fantail’s abundance significantly
decreased from 1996 on all islands combined (P Non-native species
< 0.001; Table 3) and decreased on all three of the In a very different pattern from most of the native
islands sampled in 1996; significantly so on one of species, of the 13 common, non-native landbird
the islands. species, ten species declined (Table 3) on all islands
combined during the pest control period, including
Eurasian blackbird (Turdus merula), chaffinch
The recent immigrant silvereye was the second (Fringilla coelebs), European starling (Sturnus
most common bird detected. It declined (Fig. 3B) vulgaris), European goldfinch (Carduelis carduelis),
significantly during the 9-year period (P < 0.001), European greenfinch (Carduelis chloris), dunnock
(Prunella modularis), common myna, Eurasian
skylark, song thrush (Turdus philomelos), and
yellowhammer (Emberiza citrinella). Just two species
increased – eastern rosella (Platycercus eximius)
and house sparrow. Only brown quail (Coturnix
ypsilophora) remained unchanged. Comparing the
1996 counts with the pest control period, ten species
declined significantly, only eastern rosella increased
and two species (house sparrow and European
starling) were unchanged. We detail two non-
native species below, common myna and Eurasian
blackbird. The other species of non-native birds are
shown in Appendix 2.
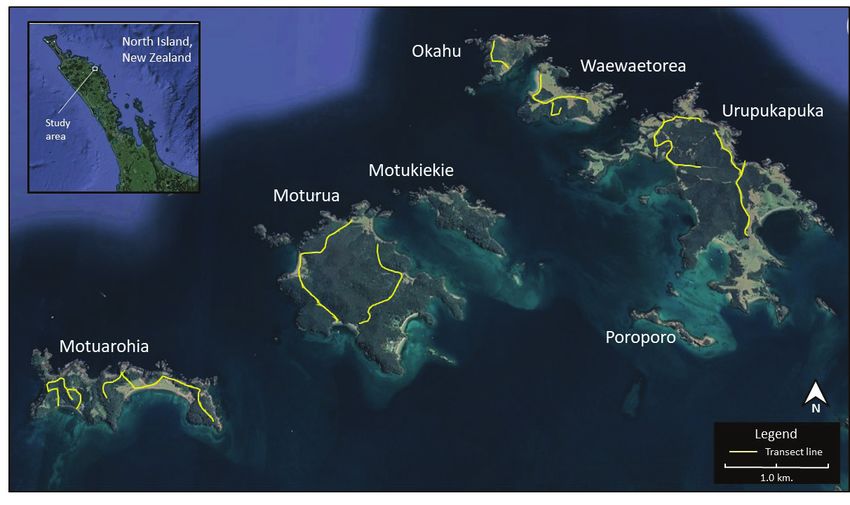
Common myna showed a great deal of variation
between years on the different islands, with
especially low numbers in 2012, 2013, and 2015 on
all islands (Fig. 4A). This could well be due in part
to flocks of non-breeding individuals being detected
irregularly. Overall, it declined significantly on all
islands combined, most notably when 1996 data are
included in the regression (P < 0.001; Table 3).
Eurasian blackbird had low numbers during
2010 and 2011, just after the pest control that began
in June 2009 (Fig. 4B). The species declined overall
during both the entire 20-year period as well as
the last nine years of pest control. It appeared to
rebound in 2012, with a continued steady decline
thereafter.
DISCUSSION
We had expected the total eradication of
Figure 3. The mean number (± se) of birds seen or heard on mammalian predators to result in an increasing
the 10-minute station counts on four islands of the Ipipiri trend broadly across bird species, both native and
group and the overall mean (All Islands). “X” = island non-native, with the presumption that reduction
was not counted in that year; A) New Zealand fantail, B) in predation and competition would be widely
silvereye. felt as community equilibrium was established.446 Ralph et al.
a marked difference between long-established
endemic natives and the relatively recent natural
immigrants. That is, of the native species, the
exceptions to the general rule of increases after pest
control were the six species that are more recent
arrivals in New Zealand which declined –pukeko,
sacred kingfisher, shining cuckoo, grey warbler,
New Zealand fantail, and silvereye. These recent
immigrants might be considered analogues to the
non-native species.
In New Zealand, some other studies have
looked at the prediction that native birds would
outperform non-native species when mammalian
pests are eliminated. Providing indirect evidence,
Diamond and Veitch (1981) observed, in a largely
intact avifauna and native forest on 2,800 ha Little
Barrier, far more individuals of native species
than non-natives. A direct test was provided on
the smaller (220 ha) and nearby Tiritiri Matangi
Island where, in a detailed 24-year study, Graham
et al. (2013) found that of the native species, 5
significantly increased, 3 decreased, and 8 had
no significant change. Of native species that
were reintroduced onto the island, 4 significantly
increased, 2 decreased, and 3 had no change. By
contrast, of the non-native species, none increased,
3 decreased, and 11 had no change. Similarly, at
Zealandia in Wellington, Miskelly (2018) found
that the proportion of non-native species declined
during a 25-year period from 30% (in 1995–1998)
Figure 4. The mean number (± se) of birds seen or heard on to 22% (2002–2005), and 9% (2013–2016). Overall,
the 10-minute station counts on three islands of the Ipipiri the number of birds over that period increased
group and the overall mean (All Islands). “X” = island was 52%, mostly of reintroduced native species. They
not counted in that year; A) common myna, B) Eurasian reintroduced 10 species, eight successfully. Counts
blackbird. for all six of the most frequently recorded resident
non-native species declined markedly after the
2002–2005 period.
Rats in particular are a significant competitor with Two meta-analyses have examined this question.
native avian species for fruits and flowers, and both In one, Bombaci et al. (2018) found that “densities
rats and mice also have an important impact in of nine endemic species were higher in sanctuaries
preventing forest regeneration by eating seeds and compared to unprotected sites (0.27–9.00 more
seedlings (e.g. Shiels et al. 2014; Rankin et al. 2018). birds/ha)”, but “…found no significant difference
We suggest that rat removal had the major role in in mean population densities for introduced and
the trends we report. Other limiting factors besides biogeographically-recent native species”. In the
predation and competition from mammals could, other, Fea (2018) found that the “larger endemic
of course, be involved in these trends, including species” (i.e. kaka [Nestor meridionalis], North
disease, variable environmental conditions, and Island kokako [Callaeas wilsoni], New Zealand
weather patterns. The changing habitat from the pigeon [Hemiphaga novaeseelandiae], red-crowned
planting of native trees and shrubs, and naturally parakeet [Cyanoramphus novaezelandiae], and tui),
occurring succession and maturing of the forest, consistently showed positive population-level
may both interact in an unpredictable fashion to responses to both high and low-intensity mammal
increase or decrease certain species. control whereas populations of smaller, “deep
Our central finding was a striking difference endemic species” (i.e. stitchbird [Notiomystis cincta],
in the response between native and non-native rifleman [Acanthisitta chloris], and whitehead)
birds. Of the 27 landbird species with reasonable “responded positively only within sites receiving
sample sizes, many more native species increased high intensity management.” She also “identified
(eight) than non-native species (two; Table 3). In three small, native bird species of shallow or zero
addition, within the native species, there was also endemism” (i.e. “recent immigrants”, New ZealandIsland landbird community after pest control 447
fantail, grey warbler, and silvereye) and three non- Dawson, D.G.; Bull, P.C. 1975. Counting birds in
native species (Eurasian blackbird, chaffinch, and New Zealand forests. Notornis 22: 101–109.
dunnock) “that routinely decline in detections after Diamond, J.M.; Veitch, C.R. 1981. Extinctions and
mammal control.” introductions in the New Zealand avifauna:
The apparent effects of the increases or decreases cause and effect? Science 211: 499–501.
of bird populations over the pest control period in Fea, N. 2018. The responses of New Zealand’s
our study is perhaps predictable. However, with arboreal forest birds to invasive mammal control.
some species, the effects apparently began much Unpubl. Ph.D. thesis, Victoria University of
before the pest control period, and in a few species Wellington.
was a continuation of the increase or decline since Girardet, S.A.B.; Veitch, C.R.; Craig, J.L. 2001. Bird
1996, when the first count was undertaken. For and rat numbers on Little Barrier Island, New
instance, silvereye and tui showed a decrease and Zealand, over the period of cat eradication 1976–
increase respectively between 1996 and the period 80. New Zealand Journal of Zoology 28: 13–29.
of pest control. A possible explanation is that before Graham, M.F.; Veitch, C.R.; Aguilar, G.; Galbraith,
pest control a modest amount of planting was taking M. 2013. Monitoring terrestrial bird populations
place, grazing had been largely removed, and some on Tiritiri Matangi Island, Hauraki Gulf, New
form of succession was underway, heading the Zealand, 1987–2010. New Zealand Journal of
islands towards a more natural state of the forests. Ecology 37: 359–369.
Green, C.J., Gibbs, G.W. and Barnett, P.A. 2011.
Wetapunga (Deinacrida heteracantha) population
ACKNOWLEDGEMENTS changes following Pacific rat (Rattus exulans)
Transportation to the islands was provided by Tim eradication on Little Barrier Island. pp. 305–308
Roffey, Michaela and Dusty Miller at Dive Ops In: Veitch, C.R.; Clout, M.N.; Towns, D. (eds)
(Paihia), and Dennis Corbett. Richard Robbins Island Invasives: Eradication and Management.
and Project Island Song provided much advice Auckland, CBB and Gland, IUCN.
and guidance, as well as the organization of some Greene, T.C.; Pryde, M.A. 2013. Three population
counts. We are also very grateful to the folks that estimation methods compared for a known
have participated so far in counting, including South Island robin population in Fiordland,
Laureen Alston, Lindsay Alexander, Paul Asquith, New Zealand. New Zealand Journal of Ecology 36:
Gay Blunden, Peggy Burbank, Bruce Collett, Lisette 340–352.
Collins, Bruce Cottier, Jim Cottier, Teri Cottier, Carol Innes, J.; Kelly, D.; Overton, J.McC.; Gilles, C. 2010.
Davies, Detlef Davies, Gary Drain, Les Feasey, Predation and other factors currently limiting
Morag Fordham, Simon Fordham, Dorrie Godbert, New Zealand forest birds. New Zealand Journal
Anthea Goodwin, Eion Harwood, Amanda Hunt, of Ecology 34: 86–114.
Jung Kyu Lee, Steve McManus, Cynthia Matthews, Johnson, D.H. 2008. In defense of indices: the case
Angela Newport, Paul Padfield, Richard Robbins, of bird surveys. Journal of Wildlife Management
Sandra Scowen, Judit Szabo, Mike Szabo, Cinzia 72: 857–868.
Vestena, Adrian Walker, Keith Woodley, and Ian Koskimies, P.; Väisänen, R.A. 1991 (eds). Monitoring
Wilson. David Tindell took much of the 1996 data bird populations: a manual of methods applied in
and his cheerful presence and meticulous work on Finland. Zoological Museum, Finnish Museum
Moturoa Island and Ipipiri contributed a great deal. of Natural History, University of Helsinki.
Our thanks for helpful comments on this paper to Lee, W.; McGlone, M; Wright, E. 2004. Biodiversity
Rachelle Binny, Fleur Corbett, John Innes, Kevin Inventory and Monitoring: A review of national and
Parker, Eric Spurr, Dick Veitch, and an anonymous international systems and a proposed framework for
reviewer. Project Island Song is a collaboration future biodiversity monitoring by the Department
between Patukeha and Ngati Kuta (hapu from of Conservation. Report number: LC0405/014.
Rawhiti in the eastern Bay of Islands), Guardians of Wellington, Department of Conservation.
the Bay of Islands (a local community group), and Miskelly, C.M. 2018. Changes in the forest bird
the Department of Conservation’s Bay of Islands community of an urban sanctuary in response
Area Office. We are very grateful to this dynamic to pest mammal eradications and endemic bird
and positive partnership. reintroductions. Notornis 65: 132–151.
Parker, K.A. 2013. Restoring Richard Henry’s
LITERATURE CITED dream: the evolution of translocation in New
Bombaci, S.; Pejchar, L.; Innes, J. 2018. Fenced Zealand. Notornis 60: 1–2.
sanctuaries deliver conservation benefits for Project Island Song. 2014. Project Island Song
most common and threatened native island Translocation Feasibility and Action Plan. Guardians
birds in New Zealand. Ecosphere 9(11): e02497. of the Bay of Islands. November. Available at:
doi: 10.1002/ecs2.2497 https://www.projectislandsong.co.nz/index.
php/the-project/species-reintroductions.html448 Ralph et al.
Ralph, C.J.; Droege, S.; Sauer, J.R. 1995. Managing Science Series No. 32. Lincoln, Canterbury, New
and monitoring birds using point count: Zealand, Manaaki Whenua Press. 25 pp.
standards and applications. pp. 161–169 In: Te Papa; Birds New Zealand; New Zealand
Ralph, C.J.; Sauer, J.R.; Droege, S. (technical eds). Department of Conservation. 2013. New Zealand
Monitoring bird populations by point counts. USDA Birds Online – the Digital Encyclopaedia of New
Forest Service, Pacific Southwest Research Zealand Birds. www.nzbirdsonline.org.nz. Last
Station General Technical Report. Albany, accessed 26 March 2018.
California. Tindall, S.D. 1996. Ecological Impacts and
Ralph, C.J.; Ralph, C.; Szabo, J. 2008. Tomtits Management of the common myna Acridotheres
confirmed breeding on Moturua Island, Bay tristis. Unpubl. M.Sc. Thesis, Biological Sciences,
of Islands. Apteryx 22: 11. Available online at University of Auckland, New Zealand.
http://osnz.org.nz/newsletters/far-north- Tindall, S.D.; Ralph, C.J.; Clout, M.N. 2007.
apteryx-december-2008. Changes in bird abundance following common
Rankin, E.E.W.; Knowlton, J.L., Gruner, D.S.; myna control on a New Zealand island. Pacific
Flaspohler, D.J., Giardina, C.P.; Leopold, D.R.; Conservation Biology 13(3): 202–212.
Buckardt, A.; Pitt, W.C.; Fukami, T. 2018. Towns, D.R. 1991. Response of lizard assemblages
Vertical foraging shifts in Hawaiian forest birds in the Mercury Islands, New Zealand, to
in response to invasive rat removal. Plos ONE removal of an introduced rodent: the kiore
13(9). doi: 10.1371/journal.pone.0202869 (Rattus exulans). Journal of the Royal Society of
SAS Institute. 2012. SAS/STAT Release 9.4. Cary, New Zealand 21: 119–136.
North Carolina, SAS Institute, Inc. Towns, D.R.; West, C.J.; Broome, K.G. 2013. Purposes,
Shiels, A.B.; Pitt, W.B.; Sugihara, R.T.; Witmer, G.W. outcomes and challenges of eradicating
2014. Biology and Impacts of Pacific Island invasive mammals from New Zealand islands:
Invasive Species. 11. Rattus rattus, the Black Rat an historical perspective. Wildlife Research 40(2):
(Rodentia: Muridae). Pacific Science 68(2): 145– 94–107. doi: 10.1071/wr12064
184. doi: 10.2984/68.2.1 Verner, J. 1985. Assessment of counting techniques.
Spurr, E.B.; Ralph, C.J. (compilers). 2006. Development Current Ornithology 2: 247–302.
of bird population monitoring in New Zealand: Vestena, C. 2009. Project Island Song Monitoring Plan
Proceedings of a workshop. Landcare Research – Draft. Kerikeri, New Zealand. New Zealand
Department of Conservation.Island landbird community after pest control 449 Appendix 1. The mean number of 7 native bird species (± se) seen or heard on the 10-minute station counts on all islands combined, summed by four time periods. Means within each graph with different letters are statistically significantly different (P < 0.05, ANOVA), while means with the same letters are not different (P > 0.05, ANOVA).
450     Ralph et al.

Appendix 2. The mean number of 11 non-native bird species (± se) seen or heard on the 10-minute station counts on
all islands combined, summed by four time periods. Means within each graph with different letters are statistically
significantly different (P < 0.05, ANOVA), while means with the same letters are not different (P > 0.05, ANOVA).
You can also read