How big is your bubble? Characteristics of self-isolating household units ('bubbles') during the COVID-19 Alert Level 4 period in New Zealand: a ...
←
→
Page content transcription
If your browser does not render page correctly, please read the page content below
Open access Original research
BMJ Open: first published as 10.1136/bmjopen-2020-042464 on 28 January 2021. Downloaded from http://bmjopen.bmj.com/ on February 13, 2021 by guest. Protected by copyright.
How big is your bubble? Characteristics
of self-isolating household units
(‘bubbles’) during the COVID-19 Alert
Level 4 period in New Zealand: a cross-
sectional survey
Nethmi Kearns ,1 Nick Shortt,1 Ciléin Kearns,1 Allie Eathorne,1 Mark Holliday,1
Diane Mackle,1 John Martindale,1 Alex Semprini ,1,2 Mark Weatherall,1,3
Richard Beasley ,1,2,4 Irene Braithwaite 1,2
To cite: Kearns N, Shortt N, ABSTRACT
Kearns C, et al. How big is Objective To characterise the self-isolating household
Strengths and limitations of this study
your bubble? Characteristics units (bubbles) during the COVID-19 Alert Level 4
of self-isolating household ►► First known study to report characteristics of
lockdown in New Zealand.
units (‘bubbles’) during the self-
isolating household units during COVID-19
Design, setting and participants In this cross-sectional
COVID-19 Alert Level 4 period lockdown.
in New Zealand: a cross- study, an online survey was distributed to a convenience
►► The study rapidly gained high level information
sectional survey. BMJ Open sample via Facebook advertising and the Medical Research
from approximately 1% of New Zealand households
2021;11:e042464. doi:10.1136/ Institute of New Zealand’s social media platforms and mailing
within a 6-hour period very close to the initiation of
bmjopen-2020-042464 list. Respondents were able to share a link to the survey via
lockdown.
their own social media platforms and by email. Results were
►► Prepublication history and ►► The study used a convenience sample survey pre-
collected over 6 days during Alert Level 4 from respondents
supplemental material for this dominantly recruited via Facebook and therefore is
paper is available online. To living in New Zealand, aged 16 years and over.
vulnerable to selection bias.
view these files, please visit Main outcomes measures The primary outcome
the journal online (http://dx.doi. was the mean size of a self-isolating household unit or
org/10.1136/bmjopen-2020- bubble. Secondary outcomes included the mean number
of people and leaving a significant death toll
042464). of households in each bubble, the proportion of bubbles
containing essential workers and/or vulnerable people, and
in its wake. The pandemic has constituted a
Received 06 July 2020 the mean number of times the home was left each week. Public Health Emergency of International
Revised 09 December 2020
Results 14 876 surveys were included in the analysis. The Concern,1 with New Zealand reporting its first
Accepted 10 January 2021 case of COVID-19 on 26 February 2020.2 In
mean (SD) bubble size was 3.58 (4.63) people, with mean
(SD) number of households 1.26 (0.77). The proportion response to the pandemic, the New Zealand
of bubbles containing one or more essential workers, or government created and implemented a four-
one or more vulnerable persons was 45.3% and 42.1%, level COVID-19 Alert System3 that specifies
respectively. The mean number of times individual bubble public health and social measures to mitigate
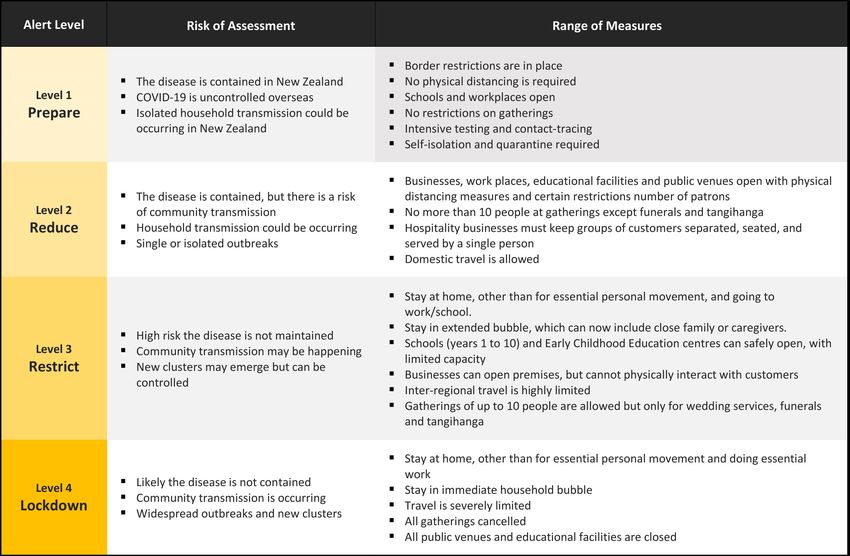
members left their home in the previous week was 12.9 against the disease, as illustrated in figure 1.
(12.4). Bubbles that contained at least one vulnerable Restrictions placed on the public increase
individual had fewer outings over the previous week
throughout the levels until, in the event of
compared with bubbles that did not contain a vulnerable
person. The bubble sizes were similar by respondent
sustained and intensive transmission of the
ethnicity. disease with widespread outbreaks, a Level 4
Conclusion In this New Zealand convenience sample, ‘lockdown’ is imposed to stall disease progres-
bubble sizes were small, mostly limited to one household, sion and assist with identifying and tracing
© Author(s) (or their and a high proportion contained essential workers and/or new cases.
employer(s)) 2021. Re-use vulnerable people. Understanding these characteristics from Isolation, quarantine and lockdowns are
permitted under CC BY-NC. No
commercial re-use. See rights
a country which achieved a low COVID-19 infection rate may among the oldest and most effective public
and permissions. Published by help inform public health interventions during this and future health measures for controlling commu-
BMJ. pandemics. nicable disease outbreaks.4 5 Lockdowns
For numbered affiliations see refer to a community- wide containment
end of article. strategy that is applied to an entire commu-
Correspondence to
INTRODUCTION nity, city or region. They are designed to
Dr Nethmi Kearns; The SARS-CoV-2 (COVID-19) pandemic has reduce personal movement and interac-
nethmi.kearns@m
rinz.ac.n z spread around the world infecting millions tions. Many countries have employed similar
Kearns N, et al. BMJ Open 2021;11:e042464. doi:10.1136/bmjopen-2020-042464 1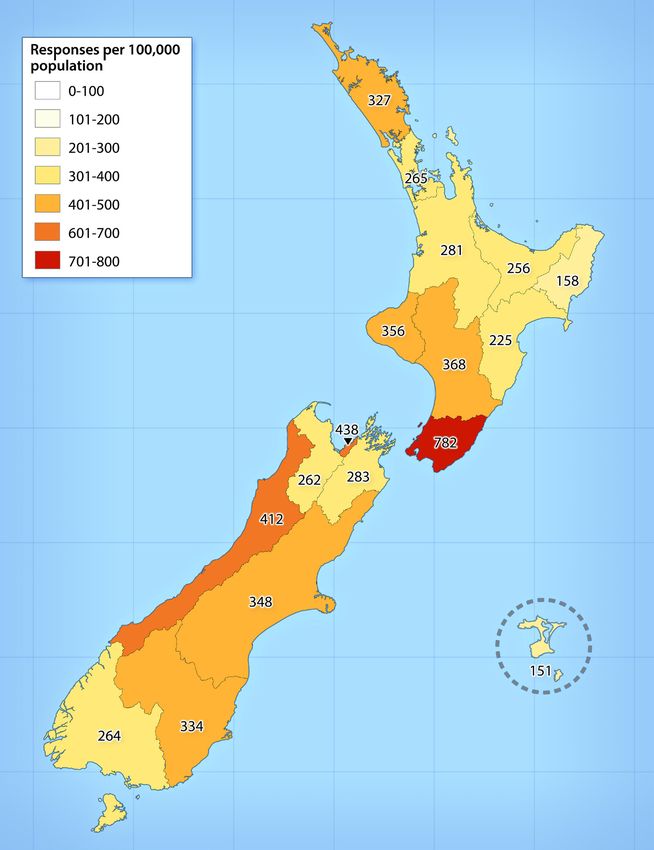
Open access
BMJ Open: first published as 10.1136/bmjopen-2020-042464 on 28 January 2021. Downloaded from http://bmjopen.bmj.com/ on February 13, 2021 by guest. Protected by copyright.
Figure 1 New Zealand COVID-19 Alert Levels. The Alert System outlines the current level of risk from COVID-19 and the
restrictions that legally must be followed in New Zealand.
containment strategies, although the parameters and The New Zealand government and public health authori-
methods of enforcement have varied considerably.6 ties developed a public messaging campaign that reinforced
China implemented the first lockdown in response to the concept of ‘staying in one’s bubble’ (figure 2).
COVID-19 in Wuhan on 23 January 2020,7 and many The term ‘bubble’ has been widely used in the media
countries,8 and some states in the USA6 have done the and by the New Zealand government to describe the
same. household unit within which an individual self-isolates.
The New Zealand government implemented Alert The bubble or household unit may span multiple house-
Level 4, one of the most stringent lockdowns internation- holds, for example, in shared custody or blended fami-
ally,6 at 23:59 on Wednesday, 25 March 2020. A state of lies. The public were urged to stay within their bubble
national emergency was declared and under section 70(1) and to avoid contact with other bubbles. Given the
(f) of the Health Act 1956,9 New Zealanders were legally
novelty of this concept, this study aimed to describe New
required to self-isolate at home. All educational facili-
Zealand bubbles and to explore relationships between
ties, public venues and business barring essential services
bubble characteristics and bubble behaviours. These
were closed, travel was severely limited and all outdoor
characteristics are of international interest in view of
and indoor gatherings were banned. All individuals other
than those working for essential services were instructed the successful public health measures including self-
to stay in isolation at home unless buying groceries, isolation, which resulted in elimination of COVID-19 in
exercising locally or seeking medical help.3 While the New Zealand10 within 8 weeks of their implementation
term ‘isolation’ refers to the separation of a person or (figure 3).
group of people known or believed to be infected with The primary objective was to determine the average size
a communicable disease, ‘quarantine’ is the more accu- of bubbles. Secondary objectives included determining
rate term. ‘Isolation’ and ‘self-isolation’ have been widely the mean number of households in each bubble, the
used in the media and by the public. Therefore, when proportion of bubbles containing essential workers and/
we refer to isolation in this paper, it is intended to mean or vulnerable people, and the mean number of times the
quarantine. home was left by bubble members each week.
2 Kearns N, et al. BMJ Open 2021;11:e042464. doi:10.1136/bmjopen-2020-042464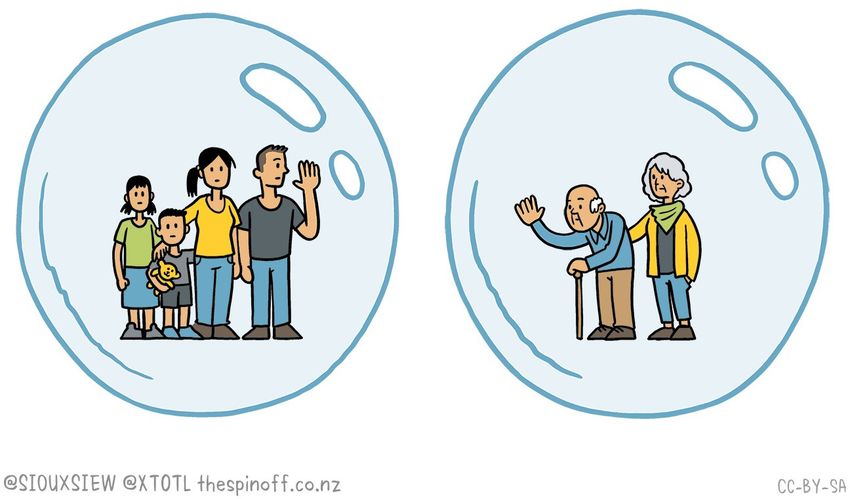
Open access
BMJ Open: first published as 10.1136/bmjopen-2020-042464 on 28 January 2021. Downloaded from http://bmjopen.bmj.com/ on February 13, 2021 by guest. Protected by copyright.
Figure 2 The bubble. The term ‘bubble’ has been widely used in the media and by the New Zealand government to describe
the household unit within which an individual self-isolates. Image by Morris T. Do not pop the bubble. The Spinoff. CC-BY-SA.
METHODS address to identify duplicates but following feedback this
Study design was changed to just suburb and postcode.
This was a cross-sectional study using an online survey A survey was included in the analysis if the participant
created on REDCap11 (online supplemental file 1). answered all the following compulsory questions:
The respondents answered questions relating to their 1. How many people (including yourself) are in the
bubble and each completed survey represented a single bubble?
bubble. The questions included the number of people 2. How many households are in your bubble?
and households within the bubble, whether any members 3. Do any people in your bubble work in an essential ser-
were essential workers or vulnerable people according to vice7?
Ministry of Health guidelines,12 13 and the total number 4. Are any people in your bubble vulnerable to
of times individuals within their bubbles left their home. COVID-198?
They also answered questions about themselves (age, Ethnicity was collected using the standard ethnicity
ethnicity, whether they were an essential worker or question for the New Zealand health and disability
vulnerable, and how often they had left their home for sector.14
exercise, shopping, essential work and any other reason). Respondents were also given the option of providing
The survey initially required respondents to provide their information about each of the remaining members of
Figure 3 COVID-19 Epidemic Curve in New Zealand. COVID-19 epidemic curve for the period 24 February 2020–8 June
2020, with dates for restrictions and Alert Levels in place. Surveillance data provided by Institute of Environmental Science and
Research (ESR), funded by the Ministry of Health, New Zealand. Dashboard developed by EPI-interactive.
Kearns N, et al. BMJ Open 2021;11:e042464. doi:10.1136/bmjopen-2020-042464 3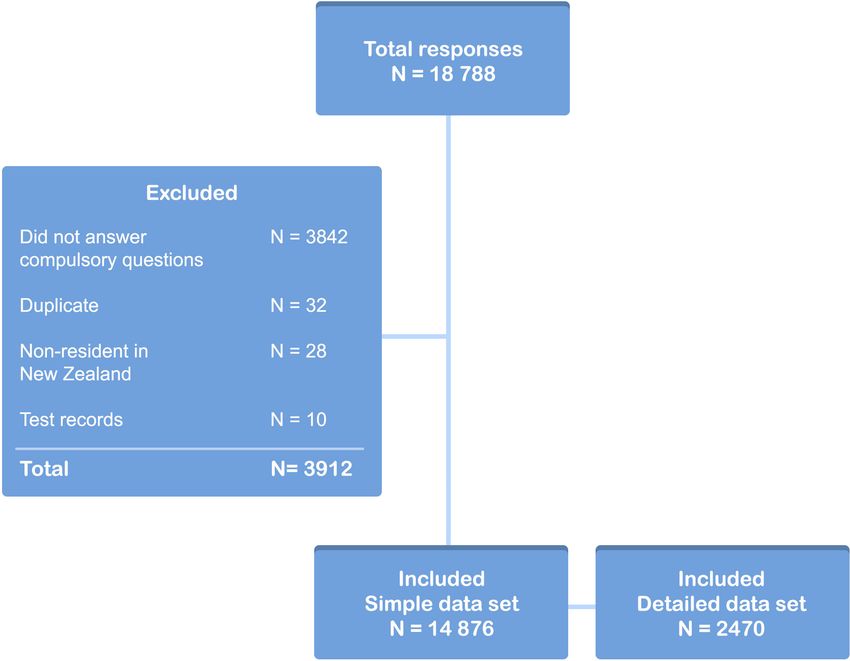
Open access
BMJ Open: first published as 10.1136/bmjopen-2020-042464 on 28 January 2021. Downloaded from http://bmjopen.bmj.com/ on February 13, 2021 by guest. Protected by copyright.
their bubbles: age, ethnicity, whether they were an essen- Study size
tial worker or vulnerable, and how often they had left the We wished to achieve a 5% margin of error for single
home. However, due to capacity issues with the servers responses and this required 385 complete responses.16
hosting our instance of REDCap, the majority of respon- As this was cluster sampling (a sample of ‘bubbles’),
dents were unable to fill in information about their house- with unknown cluster distribution and intraclass correla-
hold members. Therefore, these data are not included or tion, and undertaken on social media without a fully
reported in this study. random sampling methodology, the design effect for
cluster sampling was conservatively taken into account by
Setting increasing the sample size by 50%, aiming to achieve 580
Online social media platforms and email were used to responses about individual bubbles. There was no upper
share links to the online REDCap survey. A Facebook limit to the sample being sought.
advertisement was used to promote the survey at random
to Facebook users in New Zealand aged 16 years or older, Statistical methods
over a 72-hour period. Data descriptions were by simple counts and proportions
A link to the survey was also posted on the Medical and data descriptors: mean and SD, median and 25% and
Research Institute of New Zealand (MRINZ) website, 75% quantiles as the IQR and minimum to maximum.
Facebook page and Twitter account. The participant data- T-tests were also used to compare bubble size and house-
base for MRINZ was also emailed with a link to the online hold number per bubble. The association between
survey. For all approaches, participants were able to share ethnicity and bubble size and household number per
a link to the survey via their own social media platforms bubble used analysis of variance with European ethnicity
and by email. The period of data collection was during as the reference level. The primary comparison of
Alert Level 4, from 9 to 14 April 2020. interest was with Māori, the Indigenous Peoples of New
Zealand, who had markedly higher mortality rates during
Participants the 1918 influenza pandemic.17 The association between
Individuals were eligible if they were a resident in New rate of leaving, in relation to bubble size, the bubble, and
Zealand and aged 16 years and over. at least one essential or at least one vulnerable person in
the bubble was by Poisson regression with an offset for
bubble size. Any survey that included an answer for the
Ethics approval
primary outcome variable were included in the analysis.
Consent was implied by completion of the survey. As this
Data were not imputed for where consequent questions
study was a minimal risk observational study and involved
are unanswered. SAS V.9.4 was used.
members of the general public recruited other than
in their capacity as consumers of health and disability
services, it did not require approval from an ethics
committee as per Section 3 of the Standard Operating RESULTS
Procedures for the Health and Disability Ethics Commit- A total of 18 788 surveys were answered across New
tees in New Zealand.15 Zealand and 14 876 complete surveys were included in
the analysis (figure 4).
The number of responses varied by region and is illus-
Patient and public involvement
trated in Figure 5.
Patients or the public were not involved in the design,
or conduct, or reporting or dissemination plans of our Respondent characteristics
research. However, after the feedback of participants on The majority of survey respondents were female and
concerns over privacy, we removed the question relating of European descent (table 1). The mean (SD) age of
to full address details. respondents was 45.4 (14.6) years. Respondents who
were essential workers and vulnerable individuals were
Data management contained within 26.1% and 22.4% of bubbles, respec-
All data were entered directly by the participant into tively. The most common reason the respondents left
the REDCap database, hosted and supported by the their home was for exercise; mean (SD) number of times
MRINZ. REDCap is a secure, HIPAA (US Health Insur- per week 4.27 (4.83).
ance Portability and Accountability Act 1996) compliant
web-based application.11 Data were accessible only to a Bubble characteristics
limited number of trained study investigators. For surveys Bubbles contained a mean (SD) of 3.58 (4.63) people
where addresses were provided, duplicates were removed and 1.26 (0.77) households (table 1). The majority of
manually. bubbles contained only one household (80%), with
only 64 bubbles containing five or more households.
Bias The proportion of bubbles that contained at least one
This was a convenience sample, reliant on advertising and essential worker or at least one vulnerable individual
participants sharing the survey online. was 45.3% and 42.1%, respectively. Only 29.7% of
4 Kearns N, et al. BMJ Open 2021;11:e042464. doi:10.1136/bmjopen-2020-042464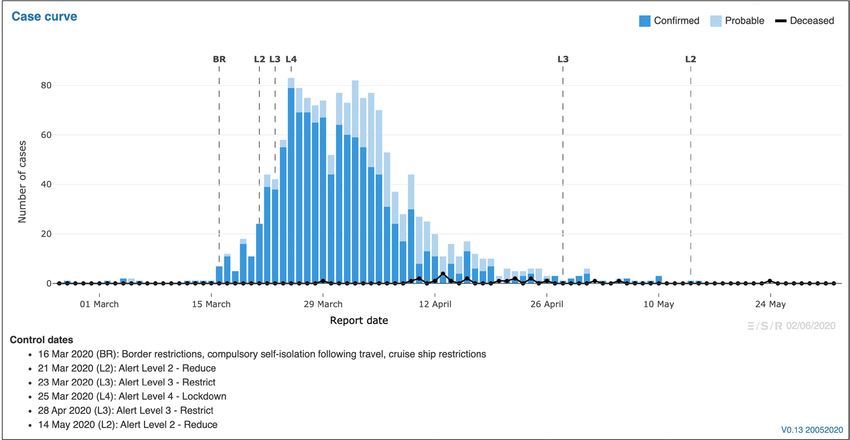
Open access
BMJ Open: first published as 10.1136/bmjopen-2020-042464 on 28 January 2021. Downloaded from http://bmjopen.bmj.com/ on February 13, 2021 by guest. Protected by copyright.
Figure 4 Survey responses. Flow diagram of included and excluded survey responses with reasons.
bubbles had neither an essential worker nor vulnerable DISCUSSION
person. Individual bubble members left their home a In this survey, isolation bubbles were generally small,
mean (SD) 12.9 (12.4) times in the previous week, most containing three to four people, and mostly one house-
often for exercise. There was minimal difference in the hold. About 70% of bubbles had an essential worker and/
bubble size across the regions (range 3.5–3.8 excluding or vulnerable person. Bubble sizes and the mean number
the Chatham Islands which had one bubble of four of households in the bubbles of Māori respondents were
people). slightly larger than that of European respondents. Bubble
members left the home approximately two times per day
Ethnicities and bubble size in total. Bubbles containing a vulnerable person had
Bubbles with Māori and Pacific respondents had a fewer leaving events than bubbles that did not contain a
larger bubble size, and the difference was significant vulnerable person.
when comparing Māori respondents to Europeans In New Zealand, the Level 4 lockdown between 25
March and 28 April 2020 had a marked effect in terms of
(table 2). Similar results were seen when comparing
reducing the COVID-19 infection rate towards achieving
the number of households per bubble by ethnicity.
a goal of elimination (figure 3). It is not possible to deter-
Bubbles in which the respondent was Māori contained
mine from our survey the specific contribution of self-
a mean (95% CI) 0.09 (0.04 to 0.14) more households
isolation to this outcome, relative to other public health
compared with bubbles in which the respondent was
measures including border closures, extensive testing and
European.
contact tracing. However, it is reasonable to assume that
when part of such a multifaceted public health strategy,
Bubbles with essential workers and/or vulnerable members self-
isolation within ‘bubbles’ with the characteristics
Bubbles that contained at least one essential worker identified in this survey contributed to the reduction in
had a mean (SD) 14.2 (13.2) leaving episodes in the cases of COVID-19 in New Zealand.
preceding week compared with bubbles with no essen- It is also challenging to determine from our survey the
tial workers which had 11.8 (11.5) leaving episodes; specific influence that the political and social environ-
relative rate 1.03 (95% CI 1.02 to 1.04), pOpen access
BMJ Open: first published as 10.1136/bmjopen-2020-042464 on 28 January 2021. Downloaded from http://bmjopen.bmj.com/ on February 13, 2021 by guest. Protected by copyright.
Figure 5 Regional distribution of survey responses. Regional distribution of included survey responses per 100 000 population
in New Zealand.
This contrasts with the more autocratic implementation itself, and to actively consider behaviours that might
of severe lockdown strictly enforced in China,18 and the cause public health risk to themselves and others.
fragmented and chaotic political and public health situa- The number of individuals in each bubble is of impor-
tion in the USA.19 tance given how COVID-19 is transmitted. Droplet trans-
To our knowledge, this is the first study to provide mission among individuals with close contact can be
information on the self-isolating household units and the higher in overcrowded houses and in household units
composition of households during lockdown, adding to with a larger number of individuals. Having blanket
the knowledge gap of an intervention that is currently regulations about isolation may not have the desired
used worldwide. We rapidly gained high level informa- effect if large numbers of individuals isolate together.
tion from approximately 1% of New Zealand households The living arrangements and household composition
within a 6-hour period very close to the initiation of lock- can vary between, as well as within, countries. Pakistan
down, using the strength of social media and a current and the Philippines have also been in lockdown with an
patient database. It also provided an opportunity for anticipated average household size of 6.8 and 4.2 individ-
participants to engage and learn about the lockdown uals, respectively,20 larger than the New Zealand census
6 Kearns N, et al. BMJ Open 2021;11:e042464. doi:10.1136/bmjopen-2020-042464Table 1 Respondent and bubble characteristics
N n % National %*
Respondent characteristics Age
16–19 14 876 343 2.3 5.2
20–29 1994 13.4 14.1
30–39 3301 22.2 13.0
40–49 3447 23.2 13.0
50–59 2910 19.6 13.0
60–69 2090 14.1 10.4
70–79 738 5.0 6.7
80+ 53 0.4 3.6
Gender
Female 14 361 12 111 84.3 50.6†
Male 2169 15.1 49.4†
Other 81 0.6
Kearns N, et al. BMJ Open 2021;11:e042464. doi:10.1136/bmjopen-2020-042464
Ethnicity‡
European 14 344 12 589 87.8 71.1
Māori 978 6.8 16.5
Pacific Peoples 137 1.0 8.1
Asian 549 3.8 15.1
Middle Eastern/Latin American/African 86 0.6 1.5
Other 5 0.03 0.3
Respondent is an essential worker 14 532 3788 26.1
Respondent is a vulnerable person 14 619 3279 22.4
Respondent aged 70 years or older 14 876 790 5.3
N Mean (SD) Median (IQR) Range
Age,years 14 876 45.4 (14.6) 45 (34 to 56) 16 to 93
No of times respondent left bubble for essential work§ 14 680 0.65 (2.01) 0 (0 to 0) 0 to 100
No of times respondent left bubble for exercise§ 4.27 (4.83) 4 (1 to 7) 0 to 98
No of times respondent left bubble for shopping§ 1.07 (1.44) 1 (0 to 2) 0 to 96
No of times respondent left bubble for other reason§ 0.3 (1.19) 0 (0 to 0) 0 to 28
Continued
Open access
7
BMJ Open: first published as 10.1136/bmjopen-2020-042464 on 28 January 2021. Downloaded from http://bmjopen.bmj.com/ on February 13, 2021 by guest. Protected by copyright.Open access
BMJ Open: first published as 10.1136/bmjopen-2020-042464 on 28 January 2021. Downloaded from http://bmjopen.bmj.com/ on February 13, 2021 by guest. Protected by copyright.
Table 2 Bubble size by respondent’s ethnicity
1 to 411
0 to 400
Mean bubble size Difference from
1 to 30
Range
Ethnicity (N) (95% CI) European (95% CI)
European 3.54 (3.46 to 3.62) NA
(12 589)
Māori (978) 4.06 (3.77 to 4.36) 0.52* (0.22 to 0.83)
%
29.7
17.1
28.2
25.0
45.3
42.1
Median (IQR)
Pacific Peoples 4.06 (3.27 to 4.85) 0.52 (–0.27 to 1.31)
10 (5 to 18)
3 (2 to 4)
1 (1 to 1)
(137)
Asian (549) 3.72 (3.33 to 4.11) 0.18 (–0.22 to 0.58)
Middle Eastern/ 3.19 (2.19 to 4.18) −0.35 (–1.35 to 0.65)
Latin American/
African (86)
3.58 (4.63)
1.26 (0.77)
4422
2539
4198
3717
6738
6256
12.9 (12.4)
Other (5) 3.60 (–0.52 to 7.72) 0.06 (–4.06 to 4.19)
N
Mean (SD)
*pOpen access
BMJ Open: first published as 10.1136/bmjopen-2020-042464 on 28 January 2021. Downloaded from http://bmjopen.bmj.com/ on February 13, 2021 by guest. Protected by copyright.
Europeans in the 1918 influenza pandemic17 and were of the same household answered the survey. However,
fivefold more likely to be admitted to hospital23 and 2.6- following feedback from the respondents, we changed
fold more likely to die22 than NZ Europeans in the 2009 the survey to only collect the suburb and postcode.
H1N1 pandemic. There has been concern that ongoing Consequently, the ability to detect further duplicates was
inequities in New Zealand could result in increased risk lost, although it is unlikely to lead to major bias, as dupli-
of infection for Māori, greater risk of negative COVID-19 cates were uncommon (37 duplicates (3.7%) in the first
health impacts, and worsening of the current inequi- 1000 responses). In the interest of obtaining complete
ties in access to high-quality healthcare for Māori nega- responses and focusing on our primary outcome variable,
tively impacting on Māori health outcomes from both we kept the survey short. The response rate from non-
COVID-19 and non- COVID-19 conditions.24 We had Europeans is less than we would expect given the propor-
considered that as Māori are already affected by house- tion within the New Zealand population.33 We did not
hold overcrowding,25 bubbles containing individuals of ask specifics about essential worker roles or vulnerabili-
Māori ethnicity might be larger and incorporate more ties contained within the bubbles. Approximately 40% of
households, potentially increasing transmission within bubbles contained one or more vulnerable people, poten-
bubbles despite a lockdown. tially lower than might be expected given the burden of
Currently, the prevalence of COVID-19 on Māori has chronic disease in New Zealand.34 The responses may
been lower than in European New Zealanders, which also have been affected by social desirability bias, where
has been attributed to the higher rate of European New the answers reflect expected behaviour instead of actual
Zealanders returning with COVID-19 infection from over- behaviour. The New Zealand government’s COVID-19
seas prior to lockdown.26 Of concern, this survey observed response was widely visible and well disseminated with
that bubbles that contained individuals of Māori ethnicity a broad presence across analogue and digital media,
were substantially larger or contained more households thereby potentially inflating or deflating individuals’
than those that contained Europeans, suggesting that responses (eg, under-reporting the times the bubble was
Māori may be at greater risk in the situation of a more left, or the number of households per bubble). We miti-
widespread community transmission of COVID-19. gated this by not collecting identifiable information and
As with all surveys of this nature, there are method- the survey was completed by the responder in their own
ological limitations that need to be considered. This was time, without the presence of an investigator, eliminating
a convenience sample survey predominantly recruited the possibility of coercion or fear of judgement.
via Facebook and vulnerable to selection bias. Despite The Alert Level 4 lockdown in New Zealand has
the number of roughly equal male (46.7%) and female succeeded in limiting the spread of COVID-19, despite
(53.3%) Facebook users in New Zealand27 and gender an initial trajectory similar to other countries in Western
not being a criteria for targeted advertising of the survey, Europe and North America.35 As a result, the reported
female respondents were over-represented in this survey, confirmed cases of 433 per million in New Zealand is
suggesting perhaps greater responsiveness to online substantially less than that of the UK (25 851 per million)
survey-based research. In a previous study we conducted and the USA (45 815 per million)36 (as of 10 December
using Facebook for advertising, we had greater partici- 2020). The requirement for self-isolation within bubbles
pation from female than male28; a trend seen in other resulted in a small number of individuals and households
online survey responses as well.27 The number of adults per bubble, in combination with reduced movement
aged 70 and older was also small compared with the New out of the bubble, especially in bubbles that contained
Zealand population, likely reflecting the use of social vulnerable persons. While the bubbles, in conjunction
media for the survey. with other public health measures in New Zealand,
New Zealand however has a high internet penetration appear to have had the desired effect, to date, additional
rate of 93%,29 and in March 2020, Facebook had 3.48 knowledge of the lockdown units and their implementa-
million30 users aged >16 years in New Zealand, up to 92% tion may assist in identifying other levers that can be used
of the New Zealand population at this time. As the study to shape further public health interventions if the rapid
was intended for those 16 years and above, distribution mitigation of COVID-19 cases is not achieved.
of the survey via Facebook offered the potential to reach
most of the population of interest. Facebook has previ- Author affiliations
1
ously been proven to be an effective form of sampling Medical Research Institute of New Zealand, Wellington, New Zealand
2
School of Biological Sciences, Victoria University of Wellington, Wellington, New
in health research recruitment where it produced repre-
Zealand
sentative data for a population, while having additional 3
Department of Medicine, University of Otago Wellington, Wellington, New Zealand
benefits of supporting the inclusion of hard- to-
reach 4
Department of Respiratory Medicine, Capital and Coast Distirct Health Board,
and younger populations.31 32 This methodology of Wellington, New Zealand
conducting online surveys via Facebook, however, may
not be as successful in areas with low internet penetration Contributors Substantial contributions to the conception of the work: RB, IB.
Substantial contributions to the design of the work: NK, IB, NS, CK, AS, MH, JM, DM.
or low uptake of social media such as Facebook. Substantial contributions to the acquisition of data for the work: NS, CK. Substantial
We initially collected full addresses from respon- contributions the analysis of the work: AE, MW. Substantial contributions to the
dents in order to remove duplicates if another member interpretation of data for the work: NK, IB, CK. Drafting the work: NK, IB. Revising
Kearns N, et al. BMJ Open 2021;11:e042464. doi:10.1136/bmjopen-2020-042464 9Open access
BMJ Open: first published as 10.1136/bmjopen-2020-042464 on 28 January 2021. Downloaded from http://bmjopen.bmj.com/ on February 13, 2021 by guest. Protected by copyright.
the work critically for important intellectual content: NK, NS, CK, AE, MH, DM, JM, 7 Pan A, Liu L, Wang C, et al. Association of public health interventions
AS, MW, RB, IB. Final approval of the version to be published: NK, NS, CK, AE, MH, with the epidemiology of the COVID-19 outbreak in Wuhan, China.
DM, JM, AS, MW, RB, IB. Agreement to be accountable for all aspects of the work in JAMA 2020;323:1915–23.
ensuring that questions related to the accuracy or integrity of any part of the work 8 Imperial College COVID-19 Response Team. Report 13: estimating
the number of infections and the impact of non-pharmaceutical
are appropriately investigated and resolved: NK, NS, CK, AE, MH, DM, JM, AS, MW,
interventions on COVID-19 in 11 European countries 2020.
RB, IB. 9 Chaudhury A, Gaude GS, Hattiholi J. Effects of oral montelukast
Funding The Medical Research Institute of New Zealand receives Independent on airway function in acute asthma: a randomized trial. Lung India
Research Organisation funding from the Health Research Council of New Zealand 2017;34:349–54.
(IRO grant [18/002]). 10 Cousins S. New Zealand eliminates COVID-19. Lancet
2020;395:1474.
Map disclaimer The depiction of boundaries on the map(s) in this article does not 11 Harris PA, Taylor R, Thielke R, et al. Research electronic data capture
imply the expression of any opinion whatsoever on the part of BMJ (or any member (REDCap)--a metadata-driven methodology and workflow process
of its group) concerning the legal status of any country, territory, jurisdiction or for providing translational research informatics support. J Biomed
area or of its authorities. The map(s) are provided without any warranty of any kind, Inform 2009;42:377–81. doi:10.1016/j.jbi.2008.08.010
either express or implied. 12 New Zealand Government. Essential businesses and services at
alert level 4, 2020. Available: https://covid19.govt.nz/businesses-
Competing interests None declared. and-employees/businesses-and-services/essential-businesses-and-
services/
Patient consent for publication Not required. 13 New Zealand Government. At-risk people - who is at higher risk from
Ethics approval As this study was a minimal risk observational study and involved coronavirus, 2020. Available: https://covid19.govt.nz/individuals-and-
members of the general public recruited other than in their capacity as consumers households/health-and-wellbeing/at-risk-people/
of health and disability services, it did not require approval from an ethics 14 Ministry of Health. HISO 10001:2017 ethnicity data protocols, 2017.
Available: health.govt.nz
committee as per Section 3 of the Standard Operating Procedures for the Health
15 Health and Disability Ethics Committees. Operating procedures,
and Disability Ethics Committees in New Zealand. 2020. Available: https://ethics.health.govt.nz/operating-procedures
Provenance and peer review Not commissioned; externally peer reviewed. 16 Survey Monkey. Sample size calculator, 2020. Available: https://
www.surveymonkey.com/mp/sample-size-calculator/
Data availability statement Data are available upon reasonable request. Extra 17 New Zealand Ministry for Culture and Heritage. The 1918 influenza
data is available by emailing i rene.braithwaite@mrinz.ac.nz. pandemic. New Zealand history, 2020. Available: https://nzhistory.
Supplemental material This content has been supplied by the author(s). It has govt.nz/culture/influenza-pandemic-1918
18 Wu Z, McGoogan JM. Characteristics of and important lessons from
not been vetted by BMJ Publishing Group Limited (BMJ) and may not have been
the coronavirus disease 2019 (COVID-19) outbreak in China. JAMA
peer-reviewed. Any opinions or recommendations discussed are solely those 2020;323:1239. doi:10.1001/jama.2020.2648
of the author(s) and are not endorsed by BMJ. BMJ disclaims all liability and 19 The Lancet. Reviving the US CDC. Lancet 2020;395:1521.
responsibility arising from any reliance placed on the content. Where the content 20 United Nations Department of Economic and Social Affairs.
includes any translated material, BMJ does not warrant the accuracy and reliability Household size & composition, 2019, 2019. Available: https://
of the translations (including but not limited to local regulations, clinical guidelines, population.un.org/Household/#/countries/4
terminology, drug names and drug dosages), and is not responsible for any error 21 Stats NZ Tatauranga Aotearoa. 2013 census QuickStats about
and/or omissions arising from translation and adaptation or otherwise. families and households, 2014. Available: http://archive.stats.govt.nz/
Census/2013-census/profile-and-summary-reports/qstats-families-
Open access This is an open access article distributed in accordance with the households/households.aspx
Creative Commons Attribution Non Commercial (CC BY-NC 4.0) license, which 22 Wilson N, Barnard LT, Summers JA, et al. Differential mortality rates
permits others to distribute, remix, adapt, build upon this work non-commercially, by ethnicity in 3 influenza pandemics over a century, New Zealand.
and license their derivative works on different terms, provided the original work is Emerg Infect Dis 2012;18:71–7.
properly cited, appropriate credit is given, any changes made indicated, and the use 23 Verrall A, Norton K, Rooker S, et al. Hospitalizations for pandemic
is non-commercial. See: http://creativecommons.org/licenses/by-nc/4.0/. (H1N1) 2009 among Maori and Pacific Islanders, New Zealand.
Emerg Infect Dis 2010;16:100–2.
ORCID iDs 24 King P, Cormack D, McLeod M. COVID-19 and Māori health – when
equity is more than a word. Public Health Expert 2020 https://blogs.
Nethmi Kearns http://orcid.org/0 000-0002-3188-991X
otago.ac.nz/pubhealthexpert/2020/04/10/covid-19-and-maori-
Alex Semprini http://orcid.org/0000-0003-0 949-0555 health-when-equity-is-more-than-a-word/
Richard Beasley http://orcid.org/0000-0003-0337-406X 25 Ministry of Health. Analysis of household crowding based on census
Irene Braithwaite http://o rcid.org/0 000-0001-5327-3027 2013 data, 2014. Available: https://www.health.govt.nz/publication/
analysis-household-crowding-based-census-2013-data
26 Armstrong S. Covid-19: virus and recession a devastating
combination for Māori and Pasifika. RNZ, 2020. Available: https://
www.rnz.co.nz/news/in-depth/414499/covid-19-virus-and-recession-
REFERENCES a-devastating-combination-for-maori-and-pasifika
1 World Health Organization. Statement on the second meeting of
27 Saleh A, Bista K. Examining factors impacting online survey
the International health regulations (2005) emergency Committee
response rates in educational research: perceptions of graduate
regarding the outbreak of novel coronavirus (2019-nCoV), 2020.
Available: https://www.who.int/news-room/detail/30-01-2020- students. J Multidiscip Eval 2017;13:63–74.
statement-on-the-second-meeting-of-the-international-health- 28 Kearns C, Baggott C, Harwood M, et al. Engaging Māori with
regulations-(2005)-emergency-committee-regarding-the-outbreak-of- qualitative healthcare research using an animated comic. Health
novel-coronavirus-(2019-ncov) Promot Int 2020:daaa111.
2 New Zealand Minsitry of Health. COVID-19 - current cases, 2020. 29 InternetNZ. State of the Internet 2017- the state of the Internet in
Available: https://www.health.govt.nz/our-work/diseases-and- New Zealand, 2017. Available: https://internetnz.nz/sites/default/
conditions/covid-19-novel-coronavirus/covid-19-current-situation/ files/SOTI FINAL.pdf
covid-19-current-cases 30 NapoleanCat. Facebook users in New Zealand, 2020. Available:
3 New Zealand Government. COVID-19 alert system, 2020. Available: https://napoleoncat.com/stats/facebook-users-in-new_zealand/
https://covid19.govt.nz/government-actions/covid-19-alert-system/ 2020/03
4 Cetron M, Landwirth J. Public health and ethical considerations in 31 Whitaker C, Stevelink S, Fear N. The use of Facebook in recruiting
planning for quarantine. Yale J Biol Med 2005;78:329–34. participants for health research purposes: a systematic review. J
5 Martini M, Gazzaniga V, Bragazzi NL, et al. The Spanish influenza Med Internet Res 2017;19:e290.
pandemic: a lesson from history 100 years after 1918. J Prev Med 32 Thornton L, Batterham PJ, Fassnacht DB, et al. Recruiting for health,
Hyg 2019;60:E64–7. medical or psychosocial research using Facebook: systematic
6 Blavatnik School of Government. COVID-19: government response review. Internet Interv 2016;4:72–81.
stringency index, March 21,2020, 2020. Available: https:// 33 Stats NZ Tatauranga Aotearoa. 2018 census population and dwelling
ourworldindata.org/grapher/covid-stringency-index?year=2020-03- counts, 2019. Available: https://www.stats.govt.nz/information-
21 releases/2018-census-population-and-dwelling-counts
10 Kearns N, et al. BMJ Open 2021;11:e042464. doi:10.1136/bmjopen-2020-042464Open access
BMJ Open: first published as 10.1136/bmjopen-2020-042464 on 28 January 2021. Downloaded from http://bmjopen.bmj.com/ on February 13, 2021 by guest. Protected by copyright.
34 National Advisory Committee on Health and Disability (institution). areas=gbr&areas=nzl&areas=ita&areas=esp&areasRegional=
Meeting the needs of people: Häpai te whänau Mo ake ake tonu, usny&areasRegional=usnj&cumulative=1&logScale=1&perMillion=
2007. https://www.health.govt.nz/system/files/documents/ 0&values=cases
publications/meeting-needs-chronic-conditions-feb07.pdf 36 Global Change Data Lab. Total and daily confirmed COVID-19
35 Financial Times. Cumulative confirmed cases of Covid-19 in cases per million people, 2020. Available: https://
United States, United Kingdom, New Zealand, Italy and Spain, ourworldindata.o rg/g rapher/t otal-d aily-c ovid-c ases-p er-m illion?
2020. Available: https://ig.ft.com/coronavirus-chart/?areas=usa& country=~N ZL
Kearns N, et al. BMJ Open 2021;11:e042464. doi:10.1136/bmjopen-2020-042464 11You can also read