Individual smoking rates and the implications for the location of stop smoking services
←
→
Page content transcription
If your browser does not render page correctly, please read the page content below
Area (2008) 40.3, 341– 353

               The geography of smoking in Leeds: estimating
Blackwell Publishing Ltd

                individual smoking rates and the implications
                  for the location of stop smoking services
                               Melanie N Tomintz*, Graham P Clarke* and Janette E Rigby**
                                           *School of Geography, University of Leeds, Leeds LS2 9JT
                                                       Email: m.tomintz05@leeds.ac.uk
                                     **Department of Geography, University of Sheffield, Sheffield S10 2TN

                                                  Revised manuscript received 29 April 2008

                           Smoking is an important and topical health issue in the UK. In Leeds, the target is to
                           reduce smoking prevalence by 9 per cent by 2010. However, a key unknown is the likely
                           distribution of smokers across the city. This paper aims to estimate individual smoking
                           rates using microsimulation and hence evaluate the performance of established stop
                           smoking services, e.g. how well do they serve local areas and to what extent does
                           attendance vary between service point locations? Location-allocation modelling is
                           employed to test various location scenarios and provide insight into where to optimally
                           place centres.

                           Key words: health geography, microsimulation, geography of smoking, location-allocation
                           modelling, stop smoking services

                                                                         smoking in the home to protect their children. The
Introduction                                                             consequences are that such children can have higher
             To cease smoking is the easiest thing I ever did. I ought   incidences of lower respiratory tract infections, greater
             to know because I’ve done it a thousand times. (Mark        absenteeism from school and higher use of health
             Twain)                                                      services (Stanton et al. 2005).
                                                                            Smoking is an important factor driving geographical
Smoking is the largest cause of preventable death in                     variations in mortality, but most studies focus on
Britain and is responsible for various types of cancer                   national or regional trends and less has been done
(notably lung cancer) and heart disease. Peto (1994)                     at the small area level (Pearce et al. 2003). The
points out that 30 per cent of all deaths for people                     national target in England is to reduce the number
aged 35 to 69 in Britain are due to smoking and                          of smokers by 2010 from 26 per cent down to 21 per
nowadays this habit is responsible for around 86 500                     cent (Department of Health 2004). To help smokers
deaths a year (Department of Health 2006). A related                     quit, stop smoking services were set up in 1999,
health issue is that of passive smoking, where people                    raising a crucial geographical question: ‘where should
are at greater risk of developing lung cancer and                        these facilities be located?’ The recent White Paper
coronary heart disease when living with a person                         Our health, our care, our say: a new direction for
who smokes (Hackshaw et al. 1997; He et al. 1999).                       community services (Department of Health 2006)
Children in households that have a smoker are often                      highlights the increasing need to provide more
exposed to health risks, but a study by Blackburn et al.                 services away from hospitals and clinics and into com-
(2003) showed that only 20 per cent of parents stop                      munity areas (particularly hard-to-reach communities

Area Vol. 40 No. 3, pp. 341–353, 2008
ISSN 0004-0894 © The Authors.
Journal compilation © Royal Geographical Society (with The Institute of British Geographers) 2008
342 Tomintz et al.
that might contain large numbers of poor residents the Indian population, with 10 per cent, and the
or ethnic minority groups). This is a particularly highest rates for the White and Black African com-
important policy as statistics show that smoking munity, with 33 per cent (Goddard 2005).
rates are much higher in population groups of low Geodemographic variations in the resident popu-
socio-economic status (Goddard 2006). Thus, when lation are likely to cause significant variations in
attempting to reduce health inequalities, it is impor- small-area smoking rates. However, there are few
tant that efforts are concentrated in more deprived detailed statistics that identify rates of smoking at
communities. small geographical areas, making policy implemen-
Statistics also show that smoking rates vary by tation challenging. Estimates of small-area rates have
age, socio-economic status and ethnicity. The smoking been produced by Twigg and colleagues, who used
rate in the UK has decreased steadily over time, multi-level synthetic estimations at ward level (Twigg
especially for men. In the 1970s, more than 50 per et al. 2000 2004). Further research on small-area
cent of the male and 40 per cent of the female estimates of smokers can be found in Pearce et al.
population smoked, whereas by 2006 the rate has (2003) and Vaish et al. (2004). These authors focused
declined to 27 per cent for men and 21 per cent for on one or two variables, such as sex and age. An
women (Goddard 2006). Smoking rates vary amongst advantage of the microsimulation method used in
different age groups, with people aged 20–24 the this paper is that it can consider a larger number of
most likely to smoke. A high number of young people variables.
are seduced into smoking at an early age (often The aim of this paper is to provide a clearer
through peer pressure) and Stanton et al. (2005) and understanding of the geographical variations in
Sargent and Dalton (2001) report that children who smoking rates and to suggest an approach for locating
start smoking at an early age are more likely to more stop smoking services within areas of high
smoke into adulthood (Department of Health 1998). need. This maps well on to increasing interest between
An important issue for understanding spatial health inequalities and social exclusion in UK cities
variations in smoking within a city or region is the in particular (Department of Health 2006). The study
strong association between smoking and socio- area selected is Leeds, West Yorkshire, UK which
economic class. In general the proportion of smokers in consists of approximately 750 000 people.
higher socio-economic classes (such as people in The rest of the paper is structured as follows: first
managerial and professional occupations) is less the current policy situations both in the UK and
than in lower socio-economic classes. People in lower Leeds are highlighted and future plans to reduce
income groups often smoke to cope with stress the smoking population in the city are outlined.
(Datta et al. 2006) and in turn, tend to have higher Attention is also given to the issue of passive smoking.
stress levels (Elliott 2000). Further, Barbeau et al. Second, the paper explores the inequalities in smoking
(2005) discovered that in the US the number of patterns, focusing on estimates of smoking preva-
tobacco advertisements in lower socio-economic lence by age, socio-economic status and ethnicity.
communities is higher in comparison with those in As each of these attributes shows different spatial
higher income communities, and the focus of tobacco patterns of smoking, a microsimulation approach is
companies is mainly on minority communities with used to combine those attributes to produce more
low incomes (Luke et al. 2000). Other indicators robust estimates of smoking rates. Third, the per-
related to socio-economic status, such as unemploy- formance of existing stop smoking centres is evaluated
ment, housing tenure and car availability, are also in terms of market penetration (how well they serve
good predictors for smoking prevalence and health the estimated smokers). Fourth, the methodology of
inequalities in general (Gordon et al. 1999). location-allocation modelling is used to demonstrate
Smoking prevalence also varies between and within different scenarios illustrating possible locations of
different ethnic groups. The highest smoking rate in stop smoking services in Leeds. This enables policy-
the UK can be found for Bangladeshi men (around makers to make comparisons between current and
45%), whereas Indian women record rates as low as optimal locations and identify good locations for
4 per cent. The highest prevalence amongst women new centres. Finally, it is argued that such a novel com-
is found for White and Asian women, with around bination of microsimulation and location-allocation
33 per cent, whilst the lowest smoking rates for men models will offer health planners considerable power
come from the Indian community, with 17 per cent. to examine ‘what if’ scenarios of future smoking
Looking at all persons, the lowest rates are found for patterns.
Area Vol. 40 No. 3, pp. 341–353, 2008
ISSN 0004-0894 © The Authors.
Journal compilation © Royal Geographical Society (with The Institute of British Geographers) 2008The geography of smoking in Leeds 343
Smoking and smoking cessation services encourage smokers to stop smoking or at least to
reduce their cigarette consumption.
Concern over the links between smoking and ill-
It is estimated that 70 per cent of people would
health has developed since the pioneering work of
like to stop smoking but perceive it to be very dif-
Doll and Hill (1950), although these concerns took
ficult (Department of Health 2004). The NHS has
considerable time to be translated into policy
recognised this problem and has invested extensively
(Edwards 2004). The first successful steps against
in stop smoking services. These services are free of
smoking in the UK were taken in the 1960s by
charge, and people can self-refer or can be referred
banning the advertising of cigarettes on television.
by health professionals. Services consist of either
However, in comparison with other countries such
one-to-one or group sessions with a trained advisor.
as Norway, France and Australia, the UK was weaker
In addition, free telephone help lines, an information
in developing anti-smoking policies despite the
website and nicotine replacement therapies have
Department of Health’s (1992) review on advertising
been introduced.
smoking. In 1998, the Department of Health published
a White Paper entitled Smoking kills: a white paper
on tobacco, which argued that National Health Estimating small-area smoking rates
Service (NHS) services were needed to help smokers
In the Introduction it was shown that smoking rates
who wanted to quit. The main groups targeted are
vary depending on different geodemographic variables.
(Department of Health 1998 2004):
Here, the variables age and socio-economic class
are mapped for Output Areas (OAs) in Leeds using
• Adults (in general), with the aim of reducing smoking data from the General Household Survey (GHS) of
rates from 28 per cent to 26 per cent by 2005 and 2006 (Goddard 2006) and the UK Census 2001
21 per cent by 2010. (Figures 1 and 2). Figure 1 shows the estimated small-
• People aged below 16, with the aim of reducing area smoking rates based on the individual age of
prevalence of their smoking from 13 per cent in residents in Leeds OAs and the national smoking
1998 to 11 per cent by 2005 and 9 per cent by rates by age group available from the GHS. For
2010. instance, it is known that the national smoking rate
• Adults in different social classes, with the focus on for people aged 20–24 is 31 per cent. Thus, if there
the manual group as it has the highest smoking are 16 people aged 20–24 living in a Leeds OA,
prevalence. Here the aim is to reduce the smoking then we can multiply the national smoking rate
rate from 31 per cent in 2002 to 26 per cent or less (31%) by the number of people (16) to generate the
by 2010. number of smokers for this age group. This is then
• Women who smoke during pregnancy, where the applied to all age groups (as smoking rates vary for
aim is reduce the smoking prevalence from 23 per different age groups) to obtain the total number of
cent in 1998 to 18 per cent in 2005 and 15 per cent smokers in each of the 2439 OAs in Leeds. The
or less by 2010. same procedure was carried out to estimate small-area
smoking rates by socio-economic class. This, however,
In Leeds, around 30 per cent of the adult population produces a very different picture of smoking rates
smokes. To meet the UK national targets, Leeds (Figure 2). We have also estimated smoking rates by
needs to reduce this to 21 per cent, which repre- ethnicity (not shown here) and, again, the spatial
sents about 55 000 adult smokers (The Healthy patterns are different.
Leeds Partnership 2006). This is a huge challenge, as Figures 1 and 2 demonstrate variations in smoking
it means that almost one in three smokers will have prevalence by age and socio-economic class. Ideally,
to quit. A recent White Paper in 2004, Choosing therefore, we need to estimate smoking prevalence
health: making healthy choices easier, consisted by sex, age, socio-economic class and ethnicity
of plans to make public areas, such as offices and (which are the main predictors of smoking) simulta-
factories, smoke free (Department of Health 2004). neously. To do this we employ a microsimulation
England and Wales became smoke free in all public technique where it is possible to combine all relevant
areas on 1 July 2007 to protect against passive variables with the advantage of obtaining one result
smoking and to continue to reduce smoking of smoking estimates. Large-scale datasets based on
prevalence. Fichtenberg and Glantz (2002) show the attributes of individuals are built and ‘what if’
that restrictions on smoking in workplaces do analyses are powerful to model the impacts of
Area Vol. 40 No. 3, pp. 341–353, 2008
ISSN 0004-0894 © The Authors.
Journal compilation © Royal Geographical Society (with The Institute of British Geographers) 2008344 Tomintz et al.
Figure 1 Smoking rates estimated using age for Leeds Output Areas (2006)
changing household demographics. Such micro- The microsimulation model consists of four con-
simulation models cover many policy-relevant issues in straint variables (which have to be available in
welfare geography and are used to analyse policy both data sets), namely sex, age, socio-economic
impacts based on microunits (Birkin and Clarke 1995; class and ethnicity. These variables are grouped
Clarke 1996; Orcutt et al. 1986). and entered sequentially into the model as socio-
In this paper, the microsimulation method applies economic class (five categories), age (six categories),
a static deterministic reweighting approach developed ethnicity (five categories) and sex (two categories).
at the University of Leeds (Smith et al. in press). In The order of constraints is important as the first
the model two data sets are used: the General variable is reproduced most accurately. The deter-
Household Survey (GHS) 2005 (n = 19 480) and the ministic microsimulation modelling used here is a
UK Census 2001. The GHS is an annual cross- kind of ‘cloning’ exercise where individuals from
sectional survey that holds information on individuals the GHS are selected to populate each OA if they
and households at the regional level and the survey match the socio-economic conditions used as con-
consists of more than 1000 variables including straints. Further, marital status (two categories) is
information about a person’s lifestyle, such as smoking used as an unconstrained or validation variable as it
and drinking. The UK Census is conducted every ten is also a predictor if someone is a smoker or not
years and the most recent data available are for (but the variables mentioned before are stronger).
2001. The Census provides a rich dataset on demo- An error threshold is set where the simulated con-
graphic and socio-economic information, including straint variables are compared with the actual con-
age and socio-economic class, for the whole popu- straint variables where the error is less than 10 per
lation down to OAs (where one OA consists of cent for 90 per cent of the OAs. For the validation
around 250 people), although no information about variable marital status, the threshold is set to less
smoking is given. than 20 per cent of error in 90 per cent of the OAs
Area Vol. 40 No. 3, pp. 341–353, 2008
ISSN 0004-0894 © The Authors.
Journal compilation © Royal Geographical Society (with The Institute of British Geographers) 2008The geography of smoking in Leeds 345
Figure 2 Smoking rates estimated using socio-economic group for Leeds Output Areas (2006)
as the validation variables are more difficult to model. of existing stop smoking centres. Data supplied by
The criteria were successfully met in this application. the Leeds Primary Care Trust (PCT) showed that in
More detail of the microsimulation methodology October 2006 there were 51 service points in Leeds,
appears elsewhere (Ballas et al. 2005; Clarke 1996; with considerable variation in days and times of
Smith et al. in press). opening. For example, on a typical Monday, 11
Figure 3 shows the estimates of smoking from the centres were available, whereas on a Saturday there
microsimulation (based on a combination of age, were only two centres open. Most of the facilities
sex, socio-economic class and ethnicity). This map are located close to the city centre. There are no
of smoking rates clearly picks out areas of Leeds centres in the north at all and only two locations
where smoking is driven by age (student areas such cover the whole north-east and eastern parts of
as Headingley and University), social class (most of Leeds. Planning stop smoking services is a complex
East and South Leeds) and ethnicity (low rates in task because the PCT is quite flexible as to where to
some inner city areas driven by low smoking rates set up its services and hence numerous options are
of Asian women). Although it is recognised that the available (providing suitable premises can be found).
smoking rates in Figure 3 are still only estimates, we It can respond to complaints by setting up services
argue that these are a substantial improvement on where there are a large number of new requests for
rates estimated using only one variable. help. Hence ongoing changes can be made but in a
rather haphazard way. Obviously stop smoking
services will have greater success when focusing on
Market penetration analysis of stop people who wish to stop. According to The Healthy
smoking services Leeds Partnership (2006), there is £2.1 million
Having estimated small-area smoking prevalence available over the next three years for smoking
rates, the next task is to evaluate the performance cessation services. Further specialised services are
Area Vol. 40 No. 3, pp. 341–353, 2008
ISSN 0004-0894 © The Authors.
Journal compilation © Royal Geographical Society (with The Institute of British Geographers) 2008346 Tomintz et al.
Figure 3 Estimated smoking rates for Leeds Output Areas from the spatial microsimulation
Table 1 Example of data set obtained from the Leeds PCT
also available, such as services for South Asian at certain centres. For the analysis in this paper,
Communities (‘Tambakoo’) or services for pregnant data on persons who contacted one of the smoking
women (‘Fresh Air Babies’) to encourage visits to cessation services in Leeds between October 2004
stop smoking services. and September 2006 were obtained from the Leeds
Analysing areas where a high number of smokers PCT at the unit postcode level. The dataset contains
attend any of the services is important for planning, information on 4068 people (of whom 2394 attended
as it is then possible to see what kind of population a session and 1674 did not) including sex, age, eth-
groups are most likely to give up and make use of a nicity and unit postcode address. Data are available
stop smoking session. Further research can then on persons actually attending a service, which centre
explore why people from these areas attend any they attended and at what time, and if they stopped
particular service. For example, better media cam- smoking after 4 weeks and 52 weeks. Table 1 shows
paigns in certain areas achieve a higher attendance a sample of the data.
Area Vol. 40 No. 3, pp. 341–353, 2008
ISSN 0004-0894 © The Authors.
Journal compilation © Royal Geographical Society (with The Institute of British Geographers) 2008The geography of smoking in Leeds 347
Figure 4 Market penetration of stop smoking centres in Leeds by ward
As shown above in Figure 3, our demand estimations A corresponding analysis can be completed for
of smokers according to sex, age, socio-economic people who contacted any of the stop smoking
class and ethnicity are made at Census OA level but services but did not actually attend (n = 1674) (Figure 5).
the stop smoking centre dataset holds information It can be seen that Beeston, Middleton and Hunslet
at unit postcode level. Therefore it was necessary in the South and Burmantofts in the centre of Leeds
to match the data by using look up tables to see have the highest number of people who contacted a
which postcode belongs to which Census OA. This service but did not show up. However, three stop
information can be downloaded from UKBORDERS smoking services are located in Middleton, two in
(http://borders.edina.ac.uk/html/lut_download/eng_ Hunslet, one in Beeston and one in Burmantofts, so
pctooa.html; accessed 27 February 2007). Having people should be aware of these services nearby.
information on the number of attendees for each stop The actual reason for not turning up is not known
smoking centre along with the OA estimations of and in-depth research is needed to understand this.
numbers of smokers means it is possible to analyse the Reasons could include the opening hours or the
market share or penetration of the different centres day the service operates. Barriers such as language
by calculating the proportion of smokers attending a problems for immigrant populations could be another
centre. As the OA level is a very fine level of spatial possible reason. Interestingly, in terms of future pro-
resolution, the data are aggregated to ward level to get vision, it was found that most people attended sessions
a broader picture of how effective centres are. Figure 4 from 6 pm onwards, which shows the importance of
shows that the highest market penetration is found in the timing sessions outside main working hours. Also of
south (Rothwell, Middleton and Hunslet) and the west interest are that women were more likely to attend a
(Pudsey South, Bramley and Armley) and the lowest stop smoking session than men and that people in
market penetration in the centre of Leeds (Headingley) the age group 30– 44 were most likely to attend any
and the north-east (Garforth and Swillington). of the services.
Area Vol. 40 No. 3, pp. 341–353, 2008
ISSN 0004-0894 © The Authors.
Journal compilation © Royal Geographical Society (with The Institute of British Geographers) 2008348 Tomintz et al.
Figure 5 Proportion of estimated smokers who booked an appointment and failed to attend
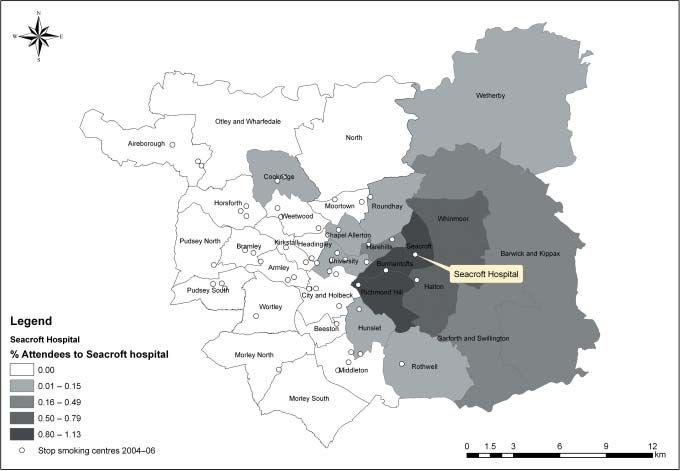
Analysing individual centres gives useful infor- and variations over space and time (Nemet and
mation on different catchment area sizes. Figure 6 Bailey 2000). Most models assume a person will be
shows the results for Seacroft Hospital in East Leeds. allocated to his/her nearest facility, so the objective
The map shows a wide catchment area for the centre, is then to minimise total travel cost or distance for
highlighting that Seacroft Hospital is one of the all persons. The most common location model is
centres with the highest attendance records. Figure 6 called the p-median model and was first defined
highlights high attendance in relation to smokers by Hakimi (1964), where a set of constraints are
in Seacroft itself (where the centre is located) and in defined and each demand site (here the number of
Richmond Hill and Burmantofts, which are adjacent smokers at OA level) is allocated to only one facility
wards. High attendance can also be seen from the (stop smoking centre) so that all service needs are
north-east and eastern part of Leeds, where no centre met. If the interest lies in locating facilities to cover
was located at the time of the analysis. Such market a set of demand sites within a defined travel distance
analysis can help health planners target areas where or time, then the location set covering problem
current penetration of the smoking community is (LSCP) is the most appropriate (Toregas et al. 1971).
low. The maximal covering problem (MCP) uses elements
of the p-median problem and the LSCP to locate a
number of facilities within a set of supply sites
Optimally locating stop smoking services (Church and ReVelle 1974). This should maximise
Location-allocation models are a tried and tested the number of people obtaining a certain service
modelling technique for locating facilities in the and it is mainly used for emergency service facilities.
best possible way given the location of demand. For more information on location-allocation and
With such models it is possible to understand complex healthcare planning see Hodgson (1988), Ross et al.
relationships between access and facility location (1994) and Møller-Jensen and Kofie (2001).
Area Vol. 40 No. 3, pp. 341–353, 2008
ISSN 0004-0894 © The Authors.
Journal compilation © Royal Geographical Society (with The Institute of British Geographers) 2008The geography of smoking in Leeds 349
Figure 6 Catchment area for the attendees at Seacroft Hospital
The method to be adopted here is the p-median • Number of demand sites (number of estimated
problem as the focus is to minimise total distance smokers in each OA).
travelled (the further away the service, generally the • Number of possible supply sites (number of stop
lower the uptake), emphasising the importance of smoking centres).
geography or distance-decay effects. In reality, when • Distance, time or cost of travel from each demand
people cannot access certain facilities, utilisation is site to each potential supply site.
normally lower. Studies have highlighted that distance • Number of new facilities to open.
between home/work and medical centres influences
the number of health visits and people sometimes The p-median problem can be written as follows
do not go to primary healthcare centres even though (Cromley and McLafferty 2002):
they actually need to visit them (Carr-Hill et al.
Objective function:
1997; Haynes and Bentham 1982; Nemet and Bailey
2000). Demographic and socio-economic factors Minimise Z = ∑i∈I ∑ j∈J aidijxij (1)
strongly influence the access to a health service: for
instance, people with low incomes and no cars are Subject to the constraints:
more dependent on public transport, which is often An individual demand site must be assigned to a
poor away from key arterial routes. This is especially facility xij ≤ xjj for all (i, j)
crucial for young people with low or no income or Demand must be assigned to an open facility ∑ j∈J Xij = 1
for the elderly, more immobile population. Therefore, for all i
disadvantaged groups often make less frequent visits Exactly p facilities must be located ∑ j∈J X jj = p for
to facility locations. all j
To solve the p-median problem the following data All demand from an individual demand site is
are required: assigned to only one facility xij = (0, 1) for all (i, j)
Area Vol. 40 No. 3, pp. 341–353, 2008
ISSN 0004-0894 © The Authors.
Journal compilation © Royal Geographical Society (with The Institute of British Geographers) 2008350 Tomintz et al.
Table 2 Location-allocation results for each day of a typical week (figures are rounded)
Longest distance one Average distance % of smokers who
has to travel to the (km) need to travel further
nearest centre (km) than 5 km
Monday
11 existing centres 7.8 2.4 23.6
11 ‘optimal’ centres 1.6 3.0 3.9
Tuesday
19 existing centres 11.0 2.1 13.8
19 ‘optimal’ centres 10.0 2.6 0.4
Wednesday
15 existing centres 5.5 2.3 27.8
15 ‘optimal’ centres 2.5 2.9 2.6
Thursday
15 existing centres 11.0 2.1 23.0
15 ‘optimal’ centres 2.5 2.9 2.6
Friday
9 existing centres 11.0 2.5 39.3
9 ‘optimal’ centres 10.5 3.1 9.4
Saturday
2 existing centres 10.6 2.9 76.1
2 ‘optimal’ centres 1.9 3.4 53.0
where: Optimal techniques would take a high amount of
Z is the objective function (see equation 1) computation time for larger datasets and hence
I is the set of demand areas and the subscript i is an mostly heuristic processes are used to obtain reason-
index denoting a particular demand area able results. Heuristics are algorithms that work
J is the set of candidate facility sites and the subscript j faster when working with large datasets by providing
is an index denoting a particular facility site a result close to the ‘optimal’ result but do not
ai is the number of people at demand site i guarantee that the best result will be found. The first
dij is the distance or time (travel cost) separating heuristic for the p-median problem was developed
place i from candidate facility site j by Teitz and Bart and other heuristics followed, such
xij is 1 if demand at place i is assigned to a facility as genetic algorithms, simulated annealing, TABU
opened at site j or 0 if demand at place i is not search, GRASP, hybrids and GRIA (Global-Regional
assigned to that site Interchange Approach). The two heuristics Teitz and
p is the number of facilities to be located. Bart and GRIA were embedded into ESRI’s network
module developed for ArcInfo7.0 (for more detail
For the location-allocation model there are various see Church and Sorensen 1996) and for this work
ways to calculate distance. The easiest and compu- GRIA was chosen (which is the predefined command).
tationally fastest is the Euclidean distance, which In October 2006, 51 stop smoking services were
calculates the route from one point to another as a run between Monday and Saturday at different times
straight line, whereas road networks reflect real of the day. The following analysis is based on such a
travel patterns more closely. Hence a road network typical week. Table 2 shows the overall results of
was implemented where OS Meridian 2 data were comparing the results from the location-allocation
downloaded from Digimap with the scale 1:50 000 model (optimal sites) with the actual sites chosen by
(http://digimap2.edina.ac.uk/downloader/Downloader? the healthcare planners on each day of the week.
tab=0; accessed 16 January 2007) and a road network The summary indicator chosen is the number of
was built within a GIS. Church and Sorensen (1996) smokers that have to travel more than 5 km to reach
point out that there are two basic approaches to a service location. The demand population in the
solve the p-median model: optimal and heuristic. model is the number of smokers estimated through
Area Vol. 40 No. 3, pp. 341–353, 2008
ISSN 0004-0894 © The Authors.
Journal compilation © Royal Geographical Society (with The Institute of British Geographers) 2008The geography of smoking in Leeds 351
Figure 7 Nine actual centres (black squares) compared with nine ‘optimal’ centres (centre of spider plot)
on a typical Friday
the microsimulation model for Leeds OAs. ESRI’s in the north and east at all on that day. Here the
ArcInfo Workstation is used to construct the model locates one centre in each of the north-east,
location-allocation model. The results of scenarios north-west, east and south, and two in central Leeds
for each day are shown in Table 2. where there are no centres. Only three of the
It can be seen that the ‘optimal’ locations reduce current centres are near optimally modelled locations.
the travel distance for smokers on all days. The best The results from the nine existing Friday centres
reduction can be seen on Friday, where 30 per cent show that 39 per cent of the smoking population
more smokers could be reached. Figure 7 shows the would need to travel more than 5 km to access their
results of the scenario mapped for Friday using nearest stop smoking service, whereas the outcome
ArcInfo. The results are shown as spider maps, where from the location-allocation model reduces this to
the centre of the spider is the ‘optimal’ location for 9 per cent.
a stop smoking service and the legs of the spider Table 2 shows that the 19 centres open on a Tuesday
show the area it covers. The black squares show the in comparison to the weekend, when no sessions
nine current stop smoking centres, whereas the are running on a Sunday and only two on a Saturday.
centre point of the grey spiders show the ‘optimal’ Therefore it would be beneficial to move some
locations and the grey lines indicate the area that is sessions to the weekend. These results should be a
covered by a particular centre. The light grey lines starting point for healthcare planners to redistribute
beneath the spider plots show the road network and the centres in a more efficient way, although more
dark grey boundaries are the ward boundaries (for criteria need to be taken into account, such as varied
better orientation). It can be seen that currently the opening times of services, and people’s willingness
centres available every Friday are quite clustered in to give up. Discussions with Leeds PCT are now
the western part of Leeds and no sessions are available on-going in relation to future service provision.
Area Vol. 40 No. 3, pp. 341–353, 2008
ISSN 0004-0894 © The Authors.
Journal compilation © Royal Geographical Society (with The Institute of British Geographers) 2008352 Tomintz et al.
different ethnic groups (such as Bangladeshi men, as
Discussion and conclusion they have a very high smoking prevalence). Also the
The results above show the importance of estimating time of the day could be modelled to see the potential
smoking prevalence at small areas to help tackle impacts on changing opening times, and the travel
health inequalities and to locate services more patterns of those that rely on public transport could
efficiently and effectively. A preliminary analysis of be more explicitly addressed in the network analysis
the smoking prevalence for different demographic part of the location-allocation models. Finally, other
and socio-economic variables was shown at the ‘what if’ modelling scenarios could give supporting
start of the paper. This analysis showed that there is information for policymakers and healthcare plan-
a need to combine these variables (as each variable ners in the future. These might include forecasting
on its own showed different spatial patterns) and for smoking patterns based on previous trends and
this purpose microsimulation is a useful and powerful updating the population base through modelling
methodology. births, deaths and migrations. Further interest lies in
Mapping the market penetration of stop smoking the impacts of the smoking ban in public places
centres is useful to identify areas with relatively high which came into force in July 2007. The impacts in
rates of attendance and it helps to identify elements Leeds could be modelled by using data/trends seen
of performance relating to target numbers. Areas with in other areas which have witnessed such a ban
low attendance could be the result of individuals earlier than England (such as Ireland and Scotland).
facing problems accessing the service. More in-depth Additional ‘what if’ policy scenarios can include the
analysis about the reasons for non-attendance is impacts of media campaigns or tax increases on the
suggested. smoking population in England.
Finding the best locations for stop smoking services The combination of microsimulation and location-
is crucial to meet the national targets in relation to allocation models in this paper showed the power
lower smoking rates. Location-allocation models are of the analyses to support decisionmakers and it is
a useful tool as numerous scenarios can be created. the first time that such analyses have been applied.
Here, the present versus the optimal locations on a The findings of this research will hopefully lead to a
specific day were modelled and average distance new approach to targeting smokers in Leeds and
travelled was calculated and expressed as the number allow centre locations to be found that should help
of smokers that have to travel further than 5 km to decrease inequalities of access for different popu-
to reach stop smoking services. Clearly, if health lation groups and in turn reduce health inequalities.
planners felt that in the future 5 km was too far to
travel, then this could be reduced and the accessi-
bility scores re-calculated. Acknowledgements
One has to keep in mind that the small-area We would like to thank the White Rose Consortium for
smoking rates used in this paper are only estimates funding this research. Thanks also to the Leeds PCT for its
and that it is not possible to construct the real collaboration and for providing datasets. The 2001 Census
smoking population without extensive data collection. Output Area Boundaries and Ward Boundaries are Crown
Only the people aged 16–74 were modelled, which copyright 2003 where Crown copyright material is repro-
hides a certain proportion of smokers. Further, the duced with the permission of the Controller of HMSO. The
PCT has to face certain constraints, including focusing data to build a road network are Crown Copyright/database
2007 and an Ordnance Survey/EDINA supplied service.
only on particular deprived areas or they do not get
any premises for their services. This makes it difficult
to distribute centres more equally or probably effi- References
ciently. The location-allocation analysis here is based
on people travelling from their home to their nearest Ballas D, Rossiter D, Thomas B, Clarke G and Dorling D 2005
centre, which means people travelling from their Geography matters: simulating the local impacts of national
social policies Joseph York, Rowntree Foundation, UK
workplace to a centre are not captured.
Barbeau E M, Wolin K Y, Naumova E N and Balbach E 2005
Future work will involve policymakers in the
Tobacco advertising in communities: associations with
development of new scenarios. For example, there race and class Preventive Medicine 40 16 –22
is interest in targeting specific population groups Birkin M and Clarke G 1995 Using microsimulation methods
such as women aged 30–44 (as the statistics show to synthesize census data in Openshaw S ed Census users’
they are the group most likely to quit) or to target handbook Pearson Professional Limited, Cambridge 363–87
Area Vol. 40 No. 3, pp. 341–353, 2008
ISSN 0004-0894 © The Authors.
Journal compilation © Royal Geographical Society (with The Institute of British Geographers) 2008The geography of smoking in Leeds 353 Blackburn C, Spencer N, Bonas S, Coe C, Dolan A and Moy R Haynes R M and Bentham C G 1982 The effects of accessi- 2003 Effect of strategies to reduce exposure of infants to bility on general practitioner consultations, out-patient environmental tobacco smoke in the home: cross sectional attendances and in-patient admissions in Norfolk, England survey British Medical Journal 327 257–61 Social Science & Medicine 16 561–9 Carr-Hill R, Place M and Posnett J 1997 Access and utilisation He J, Vupputuri S, Allen K, Prerost M R, Hughes J and Whelton of health care services in Ferguson B, Posnett J and Sheldon P K 1999 Passive smoking and the risk of coronary heart D A eds Concentration and choice in healthcare Financial disease – a meta-analysis of epidemiologic studies New Times Healthcare, London 37– 49 England Journal of Medicine 340 920–6 Church R L and ReVelle C S 1974 The maximal covering Hodgson M J 1988 An hierarchical location-allocation model location problem Papers of the Regional Science Association for primary health care delivery in a developing area Social 32 101–18 Science & Medicine 26 153– 61 Church R L and Sorensen P 1996 Integrating normative location Luke D, Esmundo E and Bloom Y 2000 Smoke signs: patterns models into GIS: problems and prospects with the p-median of tobacco billboard advertising in a metropolitan region problem in Longley P and Batty M eds Spatial analysis: Tob Control 9 16 –23 modelling in a GIS environment Pearson Professional Ltd, Møller-Jensen L and Kofie R Y 2001 Exploiting available data Cambridge 167– 84 sources: location/allocation modeling for health service Clarke G 1996 Microsimulation for urban and regional policy planning in rural Ghana Danish Journal of Geography 101 analysis Pion Limited, London 145–53 Cromley E K and McLafferty S L 2002 GIS and public health Nemet G F and Bailey A J 2000 Distance and health care The Guilford Press, London utilization among the rural elderly Social Science & Medicine Datta G D, Subramanian S V, Colditz G A, Kawachi I, Palmer J R 50 1197–208 and Rosenberg L 2006 Individual, neighborhood, and state- Orcutt G H, Merz J and Quinke H 1986 Microanalytic simu- level predictors of smoking among US black women: a multi- lation models to support social and financial policy Elsevier level analysis Social Science & Medicine 63 1034– 44 Science Publishers B V, Amsterdam Department of Health 1992 Effect of tobacco advertising on Pearce J, Boyle P and Flowerdew R 2003 Predicting smoking tobacco consumption: a discussion document reviewing behaviour in census output areas across Scotland Health the evidence Economics & Operational Research Division, and Place 9 139 – 49 Department of Health, London Peto R 1994 Smoking and death: the past 40 years and the Department of Health 1998 Smoking kills: a white paper on next 40 British Medical Journal 309 937–9 tobacco Stationery Office, London Ross N A, Rosenberg M and Pross D 1994 Siting a women’s Department of Health 2004 Choosing health: making healthy health facility: a location-allocation study of breast cancer choices easier Stationery Office, London screening services in Eastern Ontario The Canadian Geo- Department of Health 2006 Our health, our care, our say: a new grapher 38 150 –61 direction for community services Stationery Office, London Sargent J D and Dalton M 2001 Does parental disapproval of Doll R and Hill A B 1950 Smoking and carcinoma of the lung smoking prevent adolescents from becoming established British Medical Journal 30 739 – 48 smokers? Pediatrics 108 1256 –62 Edwards R 2004 The problem of tobacco smoking British Smith D M, Clarke G and Harland K in press Improving the Medical Journal 328 217–19 synthetic data generation process in spatial microsimulation Elliott M 2000 The stress process in neighborhood context models Environment and Planning A Health & Place 6 287–99 Stanton H J, Martin J and Henningfield J 2005 The impact of Fichtenberg C M and Glantz S A 2002 Effect of smoke-free smoking on the family Current Paediatrics 15 590 – 8 workplaces on smoking behaviour: systematic review British The Healthy Leeds Partnership 2006 Leeds tobacco control Medical Journal 325 188 –95 strategy 2006 to 2010 Leeds Initiative, Leeds Goddard E 2005 General Household Survey 2005: smoking Toregas C, Swain R W, ReVelle C S and Bergman L 1971 The and drinking among adults, 2005 Office for National Statistics, location of emergency service facilities Operations London Research 19 1363 –73 Goddard E 2006 General Household Survey 2006: smoking Twigg L, Moon G and Jones K 2000 Predicting small-area and drinking among adults, 2006 Office for National Statistics, health-related behaviour: a comparison of smoking and Newport drinking indicators Social Science & Medicine 50 1109– Gordon D, Shaw M, Dorling D and Smith G D 1999 Inequal- 20 ities in health: the evidence The Policy Press, Bristol Twigg L, Moon G and Walker S 2004 The smoking epidemic Hackshaw A K, Law M R and Wald N J 1997 The accumulated in England Health Development Agency, London evidence on lung cancer and environmental tobacco smoke Vaish A K, Sathe N and Folsom R E 2004 Small area esti- British Medical Journal 315 980 – 8 mates of diabetes and smoking prevalence in North Hakimi S L 1964 Optimum locations of switching centres and Carolina counties: 1996–2002 behavioral risk factor sur- the absolute centres and medians of a graph Operations veillance system Proceedings of the American Statistical Research 12 450–9 Association Area Vol. 40 No. 3, pp. 341–353, 2008 ISSN 0004-0894 © The Authors. Journal compilation © Royal Geographical Society (with The Institute of British Geographers) 2008
You can also read