Assessment of NF-κB Inhibitor (SN50) Effect on Adipose Tu- mor Necrosis Factor-Alpha and Angiotensinogen Secretion and Expression - Preprints.org
←
→
Page content transcription
If your browser does not render page correctly, please read the page content below
Preprints (www.preprints.org) | NOT PEER-REVIEWED | Posted: 6 April 2021                            doi:10.20944/preprints202104.0170.v1

           Research article

           Assessment of NF-κB Inhibitor (SN50) Effect on Adipose Tu-
           mor Necrosis Factor-Alpha and Angiotensinogen Secretion and
           Expression †
           Lotfi S. Bin Dahman 1,3, Nasser M. Al-Daghri 1*, Assim A. Alfadda 2, Reem M. Sallam 2,5,6 and
           Philip G. McTernan 1,4

                                       1  Chair for Biomarkers of Chronic Diseases, Department of Biochemistry, College of Science,
                                          King Saud University, Riyadh 11451, Saudi Arabia; aldaghri2011@gmail.com (N.M.A)
                                       2 Obesity Research Center, College of Medicine, King Saud University, Riyadh 11461, Saudi Arabia;

                                          aalfadda@ksu.edu.sa (A.A.A)
                                       3 Medical Biochemistry Department, College of Medicine and Health Sciences, Hadhramout University,

                                          Mukalla 50511, Yemen; lotfydahman@hu.edu.ye (L.S.B)
                                       4 Clinical Sciences Research Institute, University Hospitals Coventry and Warwickshire Trust, Walsgrave,

                                          Coventry CV2 2DX, UK; philip.mcternan@ntu.ac.uk (P.G.M)
                                       5 Medical Biochemistry and Molecular Biology Department, Ain Shams University, Cairo, Egypt;

                                          reemsallam@med.asu.edu.eg (R.M.S)
                                       6 Basic Medical Sciences, Faculty of Medicine, Galala University. Suez, Egypt (R.M.S)

                                       * Correspondence: ldaghri2011@gmail.com (N.M.A.); Tel.: +9-661-467-5939; Fax: +009-661-467-5931
                                       † Presented at the 1st International Electronic Conference on Biomolecules: Natural and Bio-Inspired Thera-
                                          peutics for Human Diseases, 1–13 December 2020; Available online: https://iecbm2020.sciforum.net/.

                                       Abstract: Central adiposity is one of the significant determinants of obesity-related hypertension
                                       risk, which may arise due to the abdominal fat depot's pathogenic inflammatory nature. Pro-inflam-
                                       matory cytokines and adipokines up-regulation through nuclear factor-kappa B (NF-κB) activation
                                       in adipose tissue has been considered an essential function in the pathogenesis of obesity-related
                                       hypertension. This study aimed to ascertain the NF-κB inhibitor (SN50) effect on TNF-α and angio-
                                       tensinogen (AGT) secretion and expression in mediating the anti-inflammatory effect through its
                                       impact on NF-κB activity in humans adipose tissue. Primary human adipocytes were isolated from
                                       20 subjects among 10 overweight and 10 obese with and without hypertension and treated with
                                       10ng/ml LPS in the presence and absence of NF-κB inhibitor, SN50 (50μg/ml). TNF-α secretion and
                                       NF-κB p65 activity were detected in supernatants extracted from cultured cells treated and un-
                                       treated with LPS (10ng/ml) and SN50 (50μg/ml) using enzyme-linked immunosorbent assay
                                       (ELISA). The western blot technique detected the protein of NF-κB p65 and AGT. Gene expression
                                       of TNF-α and AGT was detected in cells and performed using quantitative real-time polymerase
                                       chain reaction (RT-PCR). Treatment of AbdSc adipocytes with LPS (10ng/ml) caused a significant
                                       increase in NF-κB p65 among overweight and obese subjects with and without hypertension ( P=
                                       0.001) at 24 hours incubation. In contrast, SN50-NF-κB inhibitor causes a reduction of NF-κB p65 in
                                       overweight (P ≤0.001) and obese subjects with and without hypertension (P= 0.001) at 24 hours in-
                                       cubation. Treatment of AbdSc adipocytes with 10ng/ml LPS caused a significant increase in TNF-α
                                       secretion in overweight and obese subjects at all-time points (P ≤0.001), whereas SN50 leads to a
                                       decrease in TNF-α secretion at 3 and 12 hours incubation. Treatment of AbdSc adipocytes with LPS
                                       (10ng/ml) caused increased TNF-α and AGT gene expression twofold compared with untreated
                                       cells, whereas, in the presence of SN50, it reduces mRNA AGT levels in both groups. Taken together,
                                       these adipokines with NF-κB activation may represent essential biomarkers to evaluate hyperten-
                                       sion risk and to provide insight into the pathogenesis of obesity-related hypertension.

                                       Keywords: abdominal subcutaneous adipocytes; angiotensinogen; nuclear factor-kappa B; lipopol-
                                       ysaccharide; tumor necrosis factor-alpha

            © 2021 by the author(s). Distributed under a Creative Commons CC BY license.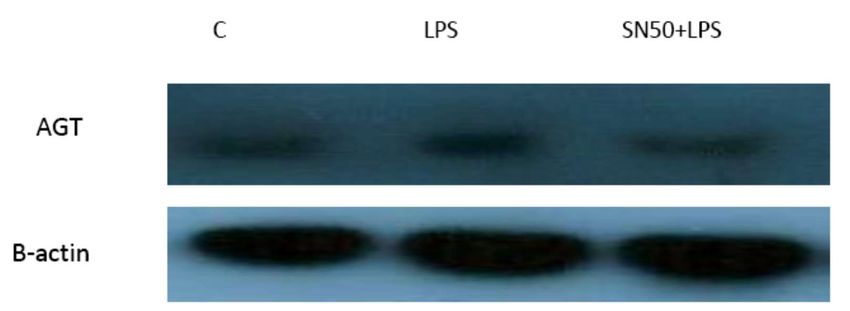
Preprints (www.preprints.org) | NOT PEER-REVIEWED | Posted: 6 April 2021               doi:10.20944/preprints202104.0170.v1

                                                                                                                        2 of 18

                                     1.   Introduction

                                     Abdominal adipose tissue is considered to be particularly pathogenic in nature with in-
                                     creasing obesity [1]. Adipose tissue is an endocrine organ that secretes numerous bioac-
                                     tive peptides, often referred to as adipocytokines, which have been proposed to partici-
                                     pate in the development of hypertension [2]. From a basic physiological perspective, adi-
                                     pose tissue growth is tightly coupled to angiogenesis and microcirculation development.
                                     Tumor necrosis factor-alpha (TNF-α) is known to regulate angiotensinogen (AGT) in
                                     hepatocytes, as the AGT promoter contains a cytokine-inducible enhancer known as the
                                     acute phase response element [3].

                                          Pro-inflammatory adipocytokine secretion from adipose tissue is coordinated
                                     through the activation of the nuclear factor-kappa B (NF-κB) transcription factor [4],
                                     which regulates the transcription of genes involved in inflammatory responses, cell
                                     growth control, and apoptosis. Thus, additional pathways in the development of hyper-
                                     tension may emanate from NF-κB activation. In resting cells, NF-κB is bound to I kappa
                                     B (IκB) inhibitors, which prevent NF-κB from entering the nucleus.

                                          Extracellular stimuli such as pro-inflammatory cytokines, chemokines, and lipopol-
                                     ysaccharides (LPS) activate a set of proteins termed IκB kinases (IKKs), which phosphor-
                                     ylate IκB, leading to an altered conformation of IκB, which releases NF-κB to enter the
                                     nucleus and activates transcription of target genes [5]. Lipopolysaccharides increase the
                                     secretion of cytokines such as TNF-α via NF-κB activation [6]. TNF-α also induces the
                                     transcription of AGT via NF-κB [7]. Moreover, there is accumulating evidence that indi-
                                     cates angiotensin II (ANG II) is capable of inducing an inflammatory response in the car-
                                     diac tissue through the activation of NF-κB [8].

                                           However, the study of NF-κB has, to some extent, been hampered by the lack of
                                     selective and specific inhibitory compounds. Our study, therefore, investigated the role
                                     of a cell-permeable peptide, SN50, as an NF-κB inhibitor. This peptide consists of the
                                     nuclear localization sequence of NF-κB subunit (p50) fused with the hydrophobic region
                                     of the signal sequence of Kaposi’s fibroblast growth factor. Lin et al. [9] demonstrated
                                     that SN50 is capable of inhibiting the nuclear import of NF-κB in human monocytic cells
                                     and murine endothelial cells stimulated with LPS and TNF-α.

                                           We hypothesized that the activation of NF-κB and the subsequent secretion and
                                     expression of TNF-α and AGT from human adipose tissue might play an important role
                                     in the development of arterial hypertension in obese subjects. The results may enable us
                                     to understand the role of various pro-inflammatory agents upregulated by activated NF-
                                     κB in the development of arterial hypertension. Our study was aimed to ascertain the
                                     effect of the NF-κB inhibitor, SN50, on reducing TNF-α and AGT secretion and expres-
                                     sion in mediating the anti-inflammatory effect through its effects on the NF-κB inflam-
                                     matory pathway in humans adipose tissue.

                                     2. Materials and Methods
                                     2.1. Subjects and Adipose Tissue
                                     Abdominal subcutaneous adipose tissue (AbdScAT) samples were obtained from 10
                                     overweight (Mean age: 30.71±9.69; and a mean BMI: 27.92±0.66), and 10 obese with and
                                     without hypertension (Mean age: 41.6±12.62; and a mean BMI: 36.245±6.95). They were
                                     undergoing abdominal adipose tissue liposuction for cosmetic reasons. Subjects with
                                     chronic debilitating diseases were excluded from the study. Personal information and
                                     anthropometric measurements were taken from each participant. All participants fasted
                                     overnight before surgery, and only normal saline was administered intravenously until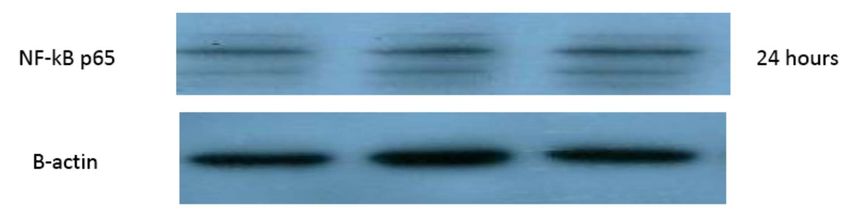
Preprints (www.preprints.org) | NOT PEER-REVIEWED | Posted: 6 April 2021                  doi:10.20944/preprints202104.0170.v1

                                                                                                                            3 of 18

                                     the tissue liposuction was taken. Informed consent was taken from all participants. The
                                     study was carried out at the Chair for Biomarkers of Chronic Diseases and Obesity
                                     Research Center, King Saud University, Riyadh, KSA. Ethical approval was granted by
                                     the King Khalid University Hospital, College of Medicine, King Saud University, Riyadh,
                                     KSA.

                                     2.2. Isolation and Culture of Mature Adipocytes

                                     Adipose tissue liposuction samples were digested for 30 minutes at 37 0C in Hank's
                                     balanced salt solution (HBSS) containing 2mg/ml collagenase under intermittent shaking
                                     as described by [10]. In brief, the mixture was centrifuged at 2000 rpm for 5 minutes at
                                     room temperature. After centrifugation, the tubes were tilted, allowing the densely
                                     packed adipocytes layer (cake of fat cell) to flow gently into a clean falcon tube. Mature
                                     fat cells were then washed by pouring in 10-15 ml of Dulbecco's modified eagle medium
                                     (DMEM F-12) phenol-red free (1ml containing 15mmol/l glucose, supplemented with 100
                                     U/ml of penicillin and 100μg/ml streptomycin. Fat cells were centrifuged at 1000 rpm for
                                     1 min. Once the adipocytes have been washed, the cells were collected into a new falcon
                                     tube. Following isolation of these cells, cells (0.2 ml, 100,000 adipocytes) were plated in 6-
                                     well tissue culture plates with culture medium (1ml, containing 15 mmol/l glucose,
                                     supplemented with 100 U/ml of penicillin, 100 μg/ml streptomycin, and 100μg/ml
                                     transferrin). The cells were preincubated with SN50 and SN50M peptides (50μg/ml)
                                     before the initiation of stimulation to enable efficient membrane translocation at 37 0C in
                                     95% air and 5% CO2 for 2 hours. After preincubation, the cells were treated with ten ng/ml
                                     LPS for 03, 12, 24, and 48 hours before the experiments. To optimize the experiments, we
                                     used different concentrations of NF-κB inhibitor (1, 10, 50, and 100 μg/ml SN50) and LPS
                                     (1, 10, and 100 ng/ml) without causing cellular death; this was deemed as 50 μg/ml SN50,
                                     and ten ng/ml LPS. Following treatment, conditioned media and adipocytes were
                                     centrifuged for 1 minute at 1000 rpm. The infranatant then separated and stored at -80°C
                                     until adipokines measurement. In contrast, fat cells were used for protein expression (NF-
                                     kB p65 activity assay and western blot) and gene expression of TNF-α and ANG.

                                     2.3. NF-κB p65 Activity Assay
                                     NF-κB p65 activity was assessed using the transcription factor assay kit according to the
                                     manufacturer's instructions (TransAM NF-κB p65 kit, Active Motif, Rixenart, Belgium;
                                     Cat. No. 40096), as described by [11]. In brief, 20 μg of total protein was used to detect NF-
                                     κB p65 activity. Jurkat cell nuclear extract (2.5μg) was used as a positive control for NF-
                                     κB p65 activation. Wild-type consensus oligonucleotides were used in the assay as a
                                     competitor for NF-κB binding. 20 pmol/well of oligonucleotides used were enough to
                                     prevent NF-κB binding to the probe immobilized on the plate. Conversely, the mutated
                                     consensus oligonucleotides were used as an uncompetitor for NF-κB binding.

                                     2.4. Isolation and Protein Quantification
                                     Equal amounts of protein from each sample (20 μg) and pertained markers were heated
                                     for 5 min at 95 °C in a loading sample buffer, loaded, and separated by 12% sodium do-
                                     decyl sulphate-polyacrylamide (SDS-PAGE) running gel and 4% SDS-PAGE stacking gel.
                                     In brief, equal amounts of protein from each sample (20 μg) and prestained markers were
                                     heated for 5 min at 95 0C in loading sample buffer and then separated by 12% Sodium
                                     Dodecyl Sulphate-Polyacrylamide (SDS-PAGE) running gel, and 4% SDS-PAGE stacking
                                     gel. Gels were run for 2 hours at 120 voltages and then blotted and transferred onto poly-
                                     vinylidene difluoride (PVDF) membrane for 25 minutes at 15 voltages using a liquid trans-
                                     fer buffer. After transfer, the membrane was washed with 1X tris buffered saline (TBS)
                                     for 5 minutes and then blocked in a blocking buffer (TBS with 0.1% Tween20, 5% nonfat
                                     dried milk, and 1% bovine serum albumin (BSA) for one hour at room temperature. After
Preprints (www.preprints.org) | NOT PEER-REVIEWED | Posted: 6 April 2021 doi:10.20944/preprints202104.0170.v1
4 of 18
blocking, the membrane was then incubated with gentle agitation overnight at 40 0C with
antibodies against the following: polyclonal rabbit IgG NF-kB p65 (1:1000) (Cell Signaling
Technology), polyclonal rabbit IgG angiotensinogen (1:200) (Phoenix Pharmaceuticals In-
dustries, USA), polyclonal goat IgG TNF-α (1:1000) (R&D Systems, USA). After incuba-
tion, the membrane was then washed three times with TBS/T for 5 minutes each wash and
then incubated with the appropriate HRP-conjugated secondary antibody for one hour.
After incubation, the membrane was washed five times for 5 minutes with TBS/T and then
incubated with chemiluminescent development (luminol and peroxide substrate) with
gentle agitation for 1 minute in a dark room. The membrane was drained, wrapped in
plastic wrap, and exposed on the x-ray image.
2.5. Isolation and Purification of Total RNA
Cells from 6 wells were extracted with 200 μl of RNA later (for RNA stabilization). Total
RNA was isolated using the RNeasy mini kit (Qiagen, GmBH, Hilden; Germany). RNA
concentration and purity were performed using the Nanodrop ND-1000
spectrophotometer, Thermo Fisher Scientific, Wilmington, DE 19810 USA.
2.6. cDNA Synthesis
The reverse transcription step was conducted on 200ng RNA using the quantitect reverse
transcription kit (Qiagen, USA) described by Heller et al. [13]. In brief, purified RNA
samples (200 ng/μl) were incubated with 2 μl of genomic DNA wipeout buffer at 42°C for
2 minutes to remove contaminating genomic DNA effectively. After genomic DNA
elimination, the RNA samples were reverse transcribed using a master mix prepared from
quantiscript reverse transcriptase (1 μl), RT primer mix (1 μl), quantiscript RT buffer (4
μl) at 42°C for 15 minutes.
2.7. Quantitative Real-Time PCR
All the experiments were performed in 96 well plates with CFX 96- Real-Time PCR
detection system (Bio-Rad, USA) using a premade TaqMan probe for (AGT:
Hs01586213_m1 and TNF-α Hs00174128_m1). Real-time relative expression experiments
were performed according to the manufacturer’s instructions. In brief, 1 μl cDNA was
used in a final PCR volume of 20 μl, containing 10 μl of the TaqMan Master Mix (AB
Applied Biosystems, Warrington, UK), 8μl RNA-free water, and 1 μl TaqMan probe.
Polymerase chain reaction cycles were as follows: 10 minutes at 42°C, followed by 40
cycles for 15 seconds at 95°C, and then 1 minute at 60°C. All reactions were multiplexed
with the housekeeping gene human 18S ribosomal RNA (AB Applied Biosystems,
Warrington, UK) and were used as a reference, enabling data to be expressed as delta
cycle threshold (∆CT) values (where ∆CT=CT 18s- CT gene of interest). Quantification of
target mRNA was carried out by comparing the number of cycles required to reach the
reference and target threshold values (ΔΔCT method). All reactions were performed in
triplicate. All statistical analyses were performed at the ∆CT stage to exclude potential
bias due to the averaging of data transformed through a 2-∆∆CT equation.
2.8. Statistical Analysis
Data were analyzed using the SPSS Windows Statistical Package for Social Sciences
(Version 16.0 SPSS Inc., Chicago, IL, USA) and expressed as mean ± standard error (S.E.).
An independent sample t-test was done for delta C.T. (∆CT) among untreated and various
treatment groups. PPreprints (www.preprints.org) | NOT PEER-REVIEWED | Posted: 6 April 2021 doi:10.20944/preprints202104.0170.v1
5 of 18
3. Results
3.1. Inhibitory Effect of SN50 on NF-kB Translocation and Activity in Cultured Human
AbdSc Adipocytes
Figure 1 show the effect of SN50 on NF-κB translocation and activity in untreated and
LPS-treated cells taken from overweight, and obese with and without hypertension at
different time points. Treatment of adipocytes with 10 ng/ml LPS, resulted a significant
increase in NF-κB activity in obese with and without hypertension than overweight
subjects at 3 and 12 hours respectively (Controls: 0.32±0.06 vs. LPS: 0.54±0.06; P=0.005;
0.34±0.02 vs. 0.57±0.04; P=0.001), and a significant increase in both groups at 24 hours
(overweight: controls: 0.21±0.07 vs. LPS: 0.46±0.02; P=0.002; obese subjects with or without
hypertension: controls: 0.33±0.04 vs. 0.54±0.04; P=0.005). Coincubation with SN50 (50
μg/ml) effectively abrogated LPS-stimulated NF-κB activity in the obese subjects with or
without hypertension at 3, 12, and 24 hours (3 h, LPS: 0.54 ± 0.06 vs. SN50+LPS: 0.35 ±
0.06; P=0.01; 12 h, LPS: 0.57 ± 0.04 vs. SN50+LPS: 0.31 ± 0.05; P ≤0.001; 24 h, LPS: 0.54 ± 0.05
vs. SN50+LPS: 0.41 ± 0.11; P ≤0.001) respectively, and in overweight subjects only at 24
hour (LPS: 0.46 ± 0.02 vs. SN50+LPS: 0.24 ± 0.03; P ≤0.001). In contrast, SN50M (Inactive
peptide) did not affect the ability of LPS to activate and translocate NF-κB. Incubation
with SN50 alone did not influence NF-κB activity in both groups (overweight: 3 hr.;
controls: 0.38 ± 0.04 vs. SN50: 0.36 ± 0.04; P=NS; obese with or without hypertension; 3 hr.;
control: 0.32 ± 0.06 vs. SN50: 0.41 ± 0.06; P=NS; A 12 hr.; controls: 0.33 ± 0.07 vs. 0.29 ±
0.1; P=NS; B 12 hr.; control: 0.34 ± 0.02 vs. SN50: 0.29 ± 0.04; P=NS; overweight, 24 hr.;
controls: 0.21 ± 0.07 vs. SN50: 0.14 ± 0.09; P=NS; obese with or without hypertension, 24
hr.; controls: 0.33 ± 0.04 vs. SN50: 0.32 ± 0.08; P=NS). Values are expressed as mean ± SE
using the sample student t-test.
3 hours
0.7
UC SN50 LPS SN50+LPS *
0.6
0.5
*
NF-kB p65 Activity
0.4
0.3
0.2
0.1
0
Overweight Obese ± hypertension
(A)Preprints (www.preprints.org) | NOT PEER-REVIEWED | Posted: 6 April 2021 doi:10.20944/preprints202104.0170.v1
6 of 18
0.8 12 hours
0.7 ***
UC SN50 LPS LPS+SN50
0.6
NF-kB p65 Activity
0.5
*
0.4
0.3
0.2
0.1
0
Overweight Obese ± hypertension
(B)
24 hours
0.7
Untreated cell SN50 LPS SN50+LPS
0.6 *
0.5 *
NF-kB p65 Activity
0.4
0.3
0.2
0.1
0
Overweight Obese ± hypertension
(C)
Figure 1. Inhibitory effect of the NF-κB inhibitor, SN50, on NF-κB p65 activity in cultured human abdominal subcutaneous
(AbdSc) adipocytes. (a) Adipocytes treated with lipopolysaccharides (LPS) (10 ng/mL) in the presence and absence of
SN50 (50 μg/mL) of the overweight and the obese ± hypertension group at 3 h of incubation. Values are expressed as
means ± SEMs using the student t-test. Values of p < 0.05 were considered significant versus untreated and treated cells. *
P-valuePreprints (www.preprints.org) | NOT PEER-REVIEWED | Posted: 6 April 2021 doi:10.20944/preprints202104.0170.v1
7 of 18
means ± SEMs using the student t-test. Values of p < 0.05 were considered significant versus untreated and treated cells
with LPS. * P-valuePreprints (www.preprints.org) | NOT PEER-REVIEWED | Posted: 6 April 2021 doi:10.20944/preprints202104.0170.v1
8 of 18
pg/ml; P=0.008; obese ± hypertension: LPS: 82.2 ± 4 vs. SN50+LPS: 54.4 ± 3.1 pg/ml; P
≤0.001; overweight 12 h; LPS: 140 ± 7 vs. SN50+LPS: 124.7 ± 5.1 pg/ml; P =0.09; obese ±
hypertension: LPS: 177.3 ± 6.7 vs. SN5+LPS: 93.3 ± 5.3 pg/ml; P ≤0.001; overweight 24 hr.;
LPS: 80.3 ± 4.3 vs. SN50+LPS: 47.3 ± 5.9 pg/ml; P=0.02; obese ± hypertension: LPS: 123.2 ±
6.2 vs. SN50+LPS: 59 ± 5.2 pg/ml; P ≤0.001). The maximum inhibition of TNF-α secretion
(around 50 %) is obtained with a concentration of 50 μg/ml. Whereas, TNF-α secretion
was increased in LPS-treated compared with untreated cells (controls) in both groups
(overweight 3 h; controls: 7.1 ± 1.5 vs. LPS: 31.1 ± 3.4 pg/ml; PPreprints (www.preprints.org) | NOT PEER-REVIEWED | Posted: 6 April 2021 doi:10.20944/preprints202104.0170.v1
9 of 18
12 hours
200 U_cell LPS SN50+LPS SN50
***
180
160 ***
TNF-α (pg/ml) Secretion
140
120
***
100
80
60
40
20 ***
0
Obese ± hypertension Overweight
(B)
24 hours
U_cell LPS SN50+LPS SN50
160
***
140
TNF-α (pg/ml) Secretion
120
100 ***
80 ***
*
60
40
***
20
0
Obese ± hypertension Overweight
(C)
Figure 3. Secretion of TNF-α (pg/mL) in cultured human AbdSc adipocytes. Adipocytes treated with LPS (10 ng/mL) in
the presence and absence of SN50 (50 μg/mL) among overweight subjects and obese ± hypertension subjects at (a) 3, (b)
12, and (c) 24 h incubation periods. Values are expressed as means ± standard errors using the student t-test. Levels of p <
0.05 were expressed as significant versus untreated cells. * P-valuePreprints (www.preprints.org) | NOT PEER-REVIEWED | Posted: 6 April 2021 doi:10.20944/preprints202104.0170.v1
10 of 18
3.4. mRNA Expression of TNF-α in Cultured Human AbdSc Adipocytes
Figure 4 shows the mRNA TNF-α level in cultured human adipocytes treated with
LPS and SN50 for 12 hours taken from overweight (n=10) and obese with and without
hypertension (n=10). Treatment of AbdSc adipocytes with LPS (10 ng/ml) increased the
expression of the TNF-α gene twofold compared with untreated cells (controls) in both
groups (Controls: 1 vs. LPS: 1.87; P=0.005; Controls: 1 vs. LPS: 2; P=0.02) respectively. In
contrast, the treatment of AbdSc adipocytes with LPS in the presence of SN50 (50 μg/ml)
reduced the expression of the TNF-α gene compared with treated cells in the overweight
group (LPS: 1.87 vs. SN50+LPS: 1.15; P= 0.02), whereas, no significant change was ob-
served in the expression of TNF-α mRNA level in obese ± hypertension group (LPS: 2 vs.
SN50+LPS: 1.48; P= 0.14). Moreover, there was no effect for SN50 alone on TNF-α mRNA
level in both groups (controls: 1 vs. SN50: 0.88; P= 0.51; controls: 1 vs. SN50: 1.39; P= 0.11)
respectively. In contrast, expression of TNF-α gene was increased twofold in LPS-treated
cell compared with controls in the combined groups studied (Figure 5), (controls: 1 vs.
LPS: 1.96; P= 0.001), and significantly reduced in the presence of SN50 (LPS: 1.96 vs.
SN50+LPS: 1.20; P= 0.02).
Overweight
2.50
TNF-α Relative Fold Expression
2.00
1.50
1.00
0.50
0.00
UC LPS LPS+SN50 SN50Preprints (www.preprints.org) | NOT PEER-REVIEWED | Posted: 6 April 2021 doi:10.20944/preprints202104.0170.v1
11 of 18
Obese ± hypertension
3.00
2.50
TNF-α Relative Fold Expression
2.00
1.50
1.00
0.50
0.00
UC LPS LPS+SN50 SN50
Figure 4. mRNA Expression of TNF-α level among overweight subjects and obese with and without hypertension subjects in cultured
human AbdSc adipocytes. Total RNA was isolated from AbdSc adipocytes from (a) overweight subjects (n = 10) and (b) obese ± hyper-
tension subjects (n = 10) and treated with LPS (10 ng/mL) in the presence and absence of SN50 (50 μg/mL) at 12 h of incubation. Quanti-
tative RT-PCR was performed using a premade TaqMan probe for TNF-α. The quantitative fold changes in mRNA expression were
determined as relative to 18S mRNA levels in each corresponding group and calculated using the 2-ΔΔCT method. Statistical analysis was
undertaken using the independent sample t-test. P < 0.05 was considered as significant versus untreated cells. * P-value = 0.02, ** p-value
= 0.002 (the overweight group), ** p-value = 0.005 (the obese ± hypertension group).
2.50
Overall
2.00
TNF-α Relative Fold Expression
1.50
1.00
0.50
0.00
UC LPS SN50+LPS SN50
Figure 5. mRNA expression of TNF-α level in cultured human AbdSc adipocytes in the studied combined group. Total
RNA was isolated from AbdSc adipocytes treated with LPS (10 ng/mL) in the presence and absence of SN50 (50 μg/mL)
at 12 h of incubation. Quantitative RT-PCR was performed using a premade TaqMan probe for TNF-α. The quantitative
fold changes in mRNA expression were determined as relative to 18S mRNA levels in each corresponding group andPreprints (www.preprints.org) | NOT PEER-REVIEWED | Posted: 6 April 2021 doi:10.20944/preprints202104.0170.v1
12 of 18
calculated using the 2-ΔΔCT method. Statistical analysis was undertaken using the independent sample t-test. * pPreprints (www.preprints.org) | NOT PEER-REVIEWED | Posted: 6 April 2021 doi:10.20944/preprints202104.0170.v1
13 of 18
Obese ± hypertension
2.50
***
AGT Relative Fold Expression
2.00
1.50
1.00 ***
0.50
0.00
UC LPS SN50+LPS SN50
Figure 6. mRNA expression of angiotensinogen (AGT) levels among overweight subjects and obese subjects with and
without hypertension in cultured human AbdSc adipocytes. Total RNA was isolated from AbdSc adipocytes from (a)
overweight subjects (n = 10) and (b) obese ± hypertension subjects (n = 10) treated with LPS (10 ng/mL) in the presence
and absence of SN50 (50 μg/mL) at 12 h of incubation. Quantitative RT-PCR was performed using a premade TaqMan
probe for AGT. The quantitative fold changes in mRNA expression were determined as relative to 18S mRNA levels in
each corresponding group and calculated using the 2-ΔΔCT method. Statistical analysis was undertaken using the inde-
pendent sample t-test. * pPreprints (www.preprints.org) | NOT PEER-REVIEWED | Posted: 6 April 2021 doi:10.20944/preprints202104.0170.v1
14 of 18
3.6. SN50 Reduces ANG Protein in LPS-Stimulated Adipocytes
LPS alone slightly increases AGT protein levels compared with those in control cells.
Coincubation with LPS and SN50 resulted in a slight reduction of AGT protein levels 24
hours (Figure 8).
Figure 8. Angiotensinogen antibody by western blot. Adipocyte cells were treated with LPS at 10
ng/mL in the presence and absence of SN50 (50 μg/mL) at 24 h of incubation. Proteins (20 μg per
lane) were separated by 12% SDS-PAGE and analyzed by western blotting using the anti-AGT an-
tibody. The loading equality was controlled using the antibody against the β-actin protein.
4. Discussion
Despite the high prevalence of obesity and hypertension in Saudi Arabia, no study has
examined the relationships between pro-inflammatory adipokines and blood pressure in
the obese, hypertensive phenotype and the role of signaling pathways in developing hy-
pertension in human adipose tissue. As obesity and hypertension are increasingly consid-
ered to produce subclinical chronic inflammation, the pro-inflammatory adipokines' po-
sition becomes increasingly essential to understand [14]. Our study focused on the NF-κB
pathway as one signaling pathway contributing to the upregulation of pro-inflammatory
adipokines such as TNF-α and RAS components like AGT in human adipose tissue, whose
secretions in adipose tissue are coordinated through NF-κB activation. Harvested and iso-
lated abdominal subcutaneous adipose tissue was used for this study.
Adipose tissue plays an essential role in the secretion of certain pro-inflammatory
adipokines, and activation of these adipokines is coordinated through the NF-κB-depend-
ent pathway [4, 15–17]. The present study examined, in vitro, the effect of an NF-κB
blocker (SN50) on TNF-α secretion as well as mRNA, TNF-α protein, and AGT expression
in primary human adipocytes, which were isolated from overweight subjects and obese
subjects with and without hypertension and treated with 10 ng/mL LPS as a potent stim-
ulant pathogen at different concentrations and time points.
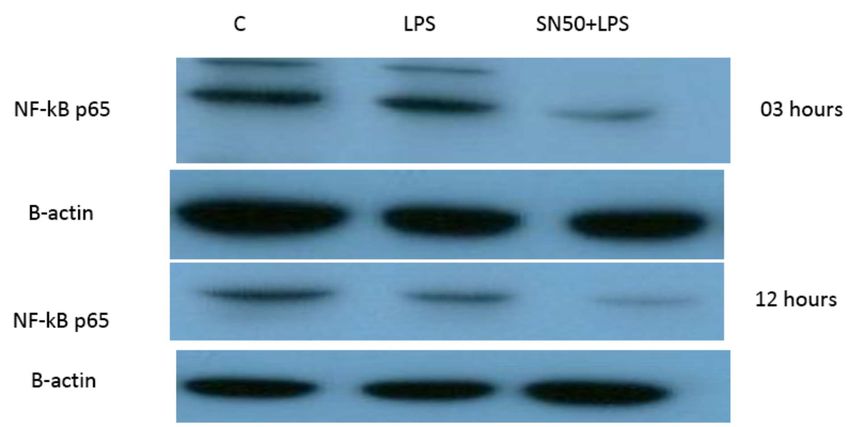
Our findings demonstrated that LPS significantly stimulates NF-κB activation in a
concentration higher or equivalent to Jurkat cells (positive control cells) in both groups.
Lipopolysaccharide also increases NF-κB p65 protein levels compared with those in con-
trol cells at 3 and 12 h and did not affect 24 h. In contrast, coincubation with LPS and SN50
resulted in a marked reduction in NF-κB p65 levels than those treated only with LPS.
However, SN50 alone did not affect LPS through NF-kB activation and expression. Our
findings suggest that SN50 at least in part suppresses NF-κB-mediated inflammatory
pathways in adipose tissue. Another interesting finding is the relationship between NF-
κB activation and the degree of adiposity. Our study observed a strong relationship be-
tween body mass index (BMI) and NF-κB p65, which remained significant independent
of age.
Liposaccharide is a well-preserved component of the external part of the Gram-neg-
ative bacterial cell wall [18]. The innate immune system recognizes this molecule via Toll-
like receptors (TLRs), a class of proteins that play a crucial role in the natural immunePreprints (www.preprints.org) | NOT PEER-REVIEWED | Posted: 6 April 2021 doi:10.20944/preprints202104.0170.v1
15 of 18
system, recognizing antigens, including LPS, on monocyte/macrophage activation. Acti-
vation of TLRs (particularly TLR-4) leads to translocation of NF-κB into the nucleus to
initiate gene expression of cytokines like IL-1, IL-6, and TNF-α [18–20].
Numerous studies have shown that the endotoxin LPS has a potent inflammatory
stimulant on cytokine secretion through NF-κB activation [4, 6]. Hence, our study ad-
dressed the principal activation regulatory pathways of the secretion of TNF-α by LPS via
NF-κB activation. Treatment of adipocytes with 10 ng/mL LPS caused a significant in-
crease in TNF-α secretion. In contrast, a significant decrease occurred in response to the
presence of SN50 as compared with those cells treated with LPS at 3, 12, and 24 h. The
maximum inhibitory action of SN50 on NF-κB activation was obtained with a concentra-
tion of 50μg/mL without causing cell death, which was observed at 12 h after treatment.
This effect gradually decreased in both groups. In contrast, SN50 alone did not affect TNF-
α secretion compared with control cells. Moreover, we observed that TNF-α secretion was
significantly higher in the obese hypertensive group than in the overweight group.
The secretion of pro-inflammatory adipokines from adipose tissue has been studied
by previous authors [4,21,22]. Adipocytes are known to secrete large quantities of IL-6 and
non-negligible amounts of TNF-α compared to macrophages [21, 22]. There is increasing
evidence supposing that adipocytes are highly implicated in the inflammatory phenome-
non associated with obesity-related hypertension. However, Hoareau et al. [18] have
shown that macrophages are more sensitive to LPS than adipocytes, responding to 5
ng/mL of LPS more than adipocytes, which are sensitive to 50 ng/mL LPS. The number of
TLR4 on the cells' surface could explain these differences in response between adipocytes
and macrophages [18]. The production of TNF-α by adipocytes may be of particular im-
portance because up to one-third of circulating TNF-α is secreted by adipose tissue [23].
An increase in central (visceral) adiposity confers a higher metabolic risk. This increased
metabolic risk is associated with subclinical inflammation.
Numerous studies have noted this mechanism, demonstrating that LPS can stimulate
the release of pro-inflammatory cytokines such as TNF-α via NF-κB activation [18,6]. They
observed that TNF-α production in human adipocytes is dependent on the NF-κB
pathway. Lehrke et al. [6] showed that LPS increases resistin production by inducing
secretion of TNF-α. This increase in resistin production can be blocked by aspirin and
rosiglitazone drugs with a dual anti-inflammatory and insulin-sensitizing action. They
have been shown to antagonize NF-κB activity. Indeed, loss of NF-κB function abolishes
LPS induction of resistin [6]. In a study of mice's adipocytes, it was found that resistin
caused insulin resistance and glucose intolerance [24], and the mice, who were lacking
resistin, had low blood glucose levels [25]. The ability of resistin to modulate glucose
metabolism is associated with the activation of SOCS3, an inhibitor of insulin signaling in
adipocytes [24]. Regarding its effect on glucose metabolism, an increase in serum resistin
also predicted the risk for increased systolic and diastolic BP in patients with type 2
diabetes mellitus (T2DM) independently of age, gender, BMI, fasting, blood glucose, and
HDL-cholesterol [26].
Zhang et al. [27] showed that resistin can predict the risk of future hypertension
among non-diabetic women aged ≥55 years, even after adjustment for inflammatory and
endothelial markers, and can promote endothelial cell activation through the release of
ET-1 and up-regulation of VCAM-1 and ICAM-1 [28]. Resistin also increases TNF-α and
IL-6 expression in white adipose tissue [29].
NF-κB plays a role in regulating gene transcription, and the present study reported
this role in the mRNA TNF-α and AGT levels of overweight patients and obese patients
with and without hypertension at 12 h. Treatment of AbdSc adipocytes with LPS in-
creased the mRNA TNF-α level twofold compared to those in untreated cells in both
groups. In contrast, the treatment of AbdSc adipocytes with LPS in the presence of SN50
caused a decrease in the mRNA TNF-α level compared with those LPS-treated overweight
subjects. In contrast, no significant change was observed in mRNA TNF-α level in obesePreprints (www.preprints.org) | NOT PEER-REVIEWED | Posted: 6 April 2021 doi:10.20944/preprints202104.0170.v1
16 of 18
subjects without hypertension. Moreover, SN50 alone did not affect TNF-α mRNA levels
in both of the experimental groups.
In contrast, our study demonstrated that the mRNA TNF-α level increased twofold
in LPS-treated subjects compared with control cells in the combined group and signifi-
cantly decreased in the presence of SN50. In addition to its effect on gene expression, LPS
also slightly increased the TNF-α protein levels compared with those in control cells. In
contrast, coincubation with LPS and SN50 resulted in a reduction in TNF-α protein levels
at 24 h.
Similarly, treatment of AbdSc adipocytes with LPS caused a twofold increase in the
mRNA AGT level than those in control cells in both groups. In contrast, the treatment of
AbdSc adipocytes with LPS in the presence of SN50 caused a decrease in the mRNA AGT
level. Moreover, the mRNA AGT was increased twofold in LPS-treated subjects and re-
duced in SN50 compared with LPS-treatment in the combined group. LPS alone also
slightly increased the AGT protein levels compared with those in control cells. Coincuba-
tion with LPS and SN50 resulted in a slight reduction in AGT protein levels at 24 h. Thus,
LPS can cause an inflammatory status in adipocytes, and the provocative quality led to
increased TNF-α via NF-κB and increased AGT and ANG II via RAS. The blocking of NF-
κB activation by SN50 led to a decrease in the inflammatory status, responsible for obesity
and co-morbidities such as hypertension.
5. Conclusions
Our study clearly demonstrated that the LPS-induced activation pathway may be an
integral part of the inflammatory process in white adipocytes linked to obesity and obe-
sity-related complications. This stimulatory action seems to be mediated via the NF-κB activa-
tion. Thus, the NF-κB inflammatory pathway may represent a regulator of the inflammatory
processes in obesity-related hypertension. Taken together, these adipokines with NF-κB
activation may represent important biomarkers to evaluate hypertension risk and may
provide mechanistic insight into the pathogenesis of obesity-related hypertension.
Author Contributions: Conceptualization: N.M.A., P.G.M., and L.S.B.D.; methodology: P.G.M.,
R.M.S., and L.S.B.D.; software: R.M.S. and L.S.B.D.; tissue experiment: R.M.S. and L.S.B.D.; samples
investigation: L.S.B.D. and R.M.S.; manuscript writing: P.G.M., A.A.A., N.M.A.-D., and L.S.B.D.;
manuscript review: P.G.M., N.M.A.-D., and A.A.A. All authors have read and agreed to the pub-
lished version of the manuscript.
Institutional Review Board Statement: The study was conducted according to the guidelines of the
Declaration of Helsinki, and approved by the Ethical approval was granted by the King Khalid
University Hospital, College of Medicine, King Saud University, Riyadh, KSA.
Informed Consent Statement: Informed consent was obtained from all subjects involved in the
study.
Data Availability Statement: All requests for data access should be addressed to the corresponding
author. Proposals requesting data access will have to specify how they plan to use the data.
Acknowledgments: The authors are grateful to the National Plan for Science and Technology (Pro-
ject identification code; 08-MED-603-2), Riyadh, KSA, for funding the study and the 1Chair for Bi-
omarkers of Chronic Diseases and Obesity Research Center, KSU for technical support. The authors
are also thankful to the primary care physicians and nurses who recruited and collected the data
and tissue samples of the participants. Special thanks to Benjamin Vinodson for the statistical anal-
ysis.
Conflicts of Interest: The authors declare no conflicts of interest.
References
1. Taube, A.; Schlich, R.; Sell, H.; Eckardt, K.; Eckel, J. Inflammation and metabolic dysfunction: Links to Cardiovascular Disease.
Am. J. Physiol. Heart Circ. Physiol. 2012, 302, H2148–H2165, doi:10.1152/ajpheart.00907.2011.Preprints (www.preprints.org) | NOT PEER-REVIEWED | Posted: 6 April 2021 doi:10.20944/preprints202104.0170.v1
17 of 18
2. Stabouli, S.; Kotsis, V.; Papamichael, C.; Constantopoulos, A.; Zakopoulos, N. Adolescent obesity is associated with high am-
bulatory blood pressure and increased carotid intimal medial thickness. J. Ped. 2005, 147, 651–656,
doi:10.1016/j.jpeds.2005.06.008.
3. Takeshita, Y.; Takamura, T.; Ando, H.; Hamaguchi, E.; Takazakura, A.; Matsuzawa-Nagata, N.; Kaneko, S. Cross talk of tumor
necrosis factor-alpha and the renin-angiotensin system in tumor necrosis factor-alpha-induced plasminogen activator inhibitor-
1 production from hepatocytes. Eur. J. Pharmacol. 2008, 579, 426–432, doi:10.1016/j.ejphar.2007.11.016.
4. Creely, S.J.; McTernan, P.G.; Kusminski, C.M.; Fisher, M.; Da Silva, M.N.F.; Khanolkar, M.; Evans, M.; Harte, A.L.; Kumar, S.
Lipopolysaccharide activates an innate immune system response in human adipose tissue in obesity and type 2 diabetes. Am.
J. Physiol. Endocrinol. Metab. 2007, 292, E740–E747, doi:10.1152/ajpendo.00302.2006.
5. Kawai, T.; Akira, S. TLR signaling. Cell Death Differ. 2006, 13, 816–825.
6. Lehrke, M.; Reilly, M.P.; Millington, S.C.; Iqbal, N.; Rader, D.J.; Lazar, M.A. An inflammatory cascade leading to hyperre-
sistinemia in Humans. PloS. Med. 2004, 1, e45, doi:10.1371/journal.pmed.0010045.
7. Harte, A.L.; McTernan, P.G.; Chetty, R.; Coppack, S.; Katz, J.; Smith, S.; Kumar, S. Insulin-mediated upregulation of the renin-
angiotensin system in human subcutaneous adipocytes is reduced by rosiglitazone. Circulation 2005, 111, 1954–1961,
doi:10.1161/01.CIR.0000161954.17870.5D.
8. Hall, G.; Hasday, J.D.; Rogers, T.B. Regulating the regulator: NF-kappa B signaling in heart. J. Mol. Cell. 2006, 41, 580–591,
doi:10.1016/j.yjmcc.2006.07.006.
9. Lin, Y.Z.; Yao, S.Y.; Veach, R.A.; Torgerson, T.R.; Hawiger, J. Inhibition of nuclear translocation of transcription factor NF-kappa
B by a synthetic peptide containing a cell membrane-permeable motif and nuclear localization sequence. J. Biol. Chem. 1995, 270,
14255–14258, doi:10.1074/jbc.270.24.14255.
10. McTernan, P.G.; Anwar, A.; Eggo, M.C.; Barnett, A.H.; Stewart, P.M.; Kumar, S. Gender differences in the regulation of P450
aromatase expression and activity in human adipose tissue. Int. J. Obes. Relat. Metab. Disord. 2000, 24, 875–881,
doi:10.1038/sj.ijo.0801254.
11. Renard, P.; Ernest, I.; Houbion, A.; Art, M.; Le, C.H.; Raes, M.; Remacle, J. Development of a sensitive multi-well colorimetric
assay for active NF-κB. Nucleic Acids Res. 2001, 29, e4–e21.
12. Bradford, M.M. A rapid and sensitive method for the quantitation of microgram quantities of protein utilizing the principle of
protein-dye binding. Anal. Biochem. 1976, 72, 248–254.
13. Heller, R.A.; Schena, M.; Chai, A.; Shalon, D.; Bedilion, T.; Gilmore, J.; Woolley, D.E.; Davis, R.W. Discovery and analysis of
inflammatory disease-related genes using cDNA microarrays. Proc. Natl. Acad. Sci. USA. 1997, 94, 2150–2155,
doi:10.1073/pnas.94.6.2150.
14. Chamarthi, B.; Williams, G.H.; Ricchiuti, V.; Srikumar, N.; Hopkins, P.N.; Lauther, J.M.; Jeunemaitre, X.; Thomas, A. Inflamma-
tion and hypertension: The interplay of interleukin-6, dietary sodium, and the renin-angiotensin system in humans. Am. J.
Hypertens. 2011, 24, 1143–1148, doi:10.1038/ajh.2011.113.
15. Kern, P.A.; Ranganathan, S.; Li, C.; Wood, L.; Ranganathan, G. Adipose tissue tumor necrosis factor and interleukin-6 expres-
sion in human obesity and insulin resistance. Am. J. Physiol. Endocrinol. Metab. 2001, 280, E745–E751, doi:10.1152/aj-
pendo.2001.280.5.E745.
16. Vozarova, B.; Weyer, C.; Hanson, K.; Tataranni, P.A.; Bogardus, C.; Pratley, R.E. Circulating interleukin-6 in relation to adipos-
ity, insulin action, and insulin secretion. Obes. Res. 2001, 9, 414–417, doi:10.1038/oby.2001.54.
17. Senn, J.J.; Klover, P.J.; Nowak, I.A.; Mooney, R.A. Interleukin-6 induces cellular insulin resistance in hepatocytes. Diabetes. 2002,
51, 3391–3399, doi:10.2337/diabetes.51.12.3391.
18. Hoareau, L.; Bencharif, K.; Rondeau, P.; Murumalla, R.; Ravanan, P.; Tallet, F.; Delarue, P.; Cesari, M.; Roche, R.; Festy, F. Sig-
naling pathways involved in LPS induced TNF-alpha production in human adipocytes. J. Inflamm. 2010, 7, 1.
19. Muzio, M.; Polentarutti, N.; Bosisio, D.; Manoj Kumar, P.P.; Mantovani, A. Toll-like receptor family and signalling pathway.
Biochem. Soc. Trans. 2000, 28, 563–566, doi:10.1042/bst0280563.
20. Lin, Y.; Lee, H.; Berg, A.H.; Lisanti, M.P.; Shapiro, L.; Scherer, P.E. The lipopolysaccharide-activated toll-like receptor (TLR)-4
induces synthesis of the closely related receptor TLR-2 in adipocytes. J. Biol. Chem. 2000, 275, 24255–24263.
21. Hoareau, L.; Ravanan, P.; Gonthier, M.P.; Delarue, P.; Goncalves, J.; Cesari, M.; Festy, F.; Roche, R. Effect of PEA on LPS inflam-
matory action in human adipocytes. Cytokine 2006, 34, 291–296, doi:10.1016/j.cyto.2006.06.005.
22. Bes-Houtmann, S.; Roche, R.; Hoareau, L.; Gonthier, M.P.; Festy, F.; Caillens, H.; Gasque, P.; Lefebvre d’Hellencourt, C.; Cesari,
M. Presence of functional TLR2 and TLR4 on human adipocytes. Histochem. Cell. Biol. 2007, 127, 131–137, doi:10.1007%2Fs00418-
006-0230-1.
23. Cawthorn, W.P.; Sethi, J.K. TNF-alpha and adipocyte biology. FEBS Letters. 2008, 582, 117–131, doi:10.1016/j.febslet.2007.11.051.
24. Steppan, C.M.; Bailey, S.T.; Bhat, S.; Brown, E.J.; Banerjee, R.R.; Wright, C.M.; Patel, H.R.; Ahima, R.S.; Lazar, M.A. The hormone
resistin links obesity to diabetes. Nature 2001, 409, 307–312
25. Banerjee, R.R.; Rangwala, S.M.; Shapiro, J.S.; Rich, A.S.; Rhoades, B.; Qi, Y.; Wang, J.; Rajala, M.W.; Pocai, A.; Scherer, P.E.; et al.
Regulation of fasted blood glucose by resistin. Science 2004, 303, 1195–1198, doi:10.1126/science.1092341.
26. Takata, Y.; Osawa, H.; Kurata, M.; Kurokawa, M.; Yamauchi, J.; Ochi, M.; Nishida, W.; Okura, T.; Higaki, J.; Makino, H. Hyper-
resistinemia is associated with coexistence of hypertension and type two diabetes. Hypertension 2008, 51, 534–539,
doi:10.1161/HYPERTENSIONAHA.107.103077.Preprints (www.preprints.org) | NOT PEER-REVIEWED | Posted: 6 April 2021 doi:10.20944/preprints202104.0170.v1
18 of 18
27. Zhang, H.; Cui, J.; Zhang, C. Emerging role of adipokines as mediators in atherosclerosis. World J. Cardiol. 2010, 2, 370–376,
doi:10.4330%2Fwjc.v2.i11.370.
28. Verma, S.; Li, S.H.; Wang, C.H.; Fedak, P.W.; Li, R.K.; Weisel, R.D.; Mickle, D.A. Resistin promotes endothelial cell activation:
Further evidence of adipokine-endothelial interaction. Circulation 2003, 108, 736–740, doi:10.1161/01.CIR.0000084503.91330.49.
29. Rabe, K.; Lehrke, M.; Parhofer, K.G.; Broedl, U.C. Adipokines and insulin resistance. Mol. Med. 2008, 14, 741–751,
doi:10.2119/2008-00058.Rabe.You can also read