Evaluation of Fertilizer Value of Residues Obtained after Processing Household Organic Waste with Black Soldier Fly Larvae (Hermetia illucens) - MDPI
←
→
Page content transcription
If your browser does not render page correctly, please read the page content below
sustainability

Article
Evaluation of Fertilizer Value of Residues Obtained
after Processing Household Organic Waste with Black
Soldier Fly Larvae (Hermetia illucens)
Kiyonori Kawasaki 1, * , Toshiya Kawasaki 1 , Hirofumi Hirayasu 2 , Yoshiki Matsumoto 1, *                and
Yasuhiro Fujitani 2
 1    Graduate School of Agriculture, Kagawa University, Ikenobe 2393, Miki-cho, Kita-gun, Kagawa 761-0795,
      Japan; tooosy.k@gmail.com
 2    Research Institute of Environment, Agriculture and Fisheries, Osaka Prefecture, Shakudo 442, Habikino,
      Osaka 583-0862, Japan; HirayasuH@mbox.kannousuiken-osaka.or.jp (H.H.);
      FujitaniY@mbox.kannousuiken-osaka.or.jp (Y.F.)
 *    Correspondence: kkawasaki@ag.kagawa-u.ac.jp (K.K.); myoshiki@ag.kagawa-u.ac.jp (Y.M.);
      Tel.: +81-87-891-3061 (K.K.)

 Received: 30 May 2020; Accepted: 12 June 2020; Published: 17 June 2020

 Abstract: The residue generated by the black soldier fly (Hermetia illucens, BSF) during the processing
 of organic waste is considered a suitable crop fertilizer. However, no detailed studies have investigated
 the fertilizer value of the residue obtained from processing household organic waste. In this study,
 experimental household organic waste (EHOW) was processed by BSF at 200 mg of EHOW per head
 for 15 days at 27 ◦ C. To evaluate the fertilizer value of the obtained BSF larvae production residue
 (BSFR), the chemical composition and microbiota were analyzed, and Komatsuna (Brassica rapa var.
 perviridis) cultivation tests were conducted. BSFR results demonstrated higher ammonium nitrogen
 and lower nitrate nitrogen, and the highest above-ground dry matter weight of Komatsuna. Although
 the relative abundance of Escherichia was low, the relative abundance of Xanthomonadaceae, which
 contains a genus that causes disease in plants, was high. Therefore, the presence of plant pathogens
 in the BSFR microbiota should be considered. Finally, the effects of BSFR on the external environment
 requires more detailed investigation.

 Keywords: organic fertilizer; Hermetia illucens; compost; household organic waste; microbiota profile;
 principal component analysis

1. Introduction
      The concept of using fly larvae for processing organic waste was initially proposed almost 100
years ago [1]. More recently, the black soldier fly (BSF), which is raised on animal manure or household
organic waste (HOW) as feed for livestock, is being considered as an efficient way to recycle unutilized
resources in a sustainable manner [2]. However, due to restrictions from sanitary laws and a lack of
public acceptance for processing HOW for this purpose [3], several companies currently raise BSF
larvae on cereal byproducts. Subsequently, the BSF larvae meal is sold as feed for animals [4] and BSF
larvae production residue (BSFR) is sold for fertilizer.
      Although using only cereal byproducts for BSF larvae production will maintain the safety of feed
for livestock, this regulation may inhibit the possibility of sustainable resource recycling technology.
The BSFR could be used as an organic fertilizer because BSF larvae can use livestock manure and HOW
as a food source [5,6], which is typically disposed of as organic waste [6]. However, most previous
studies on BSF larvae production have been conducted to develop efficient organic waste treatment
conditions for BSF larvae production.

Sustainability 2020, 12, 4920; doi:10.3390/su12124920                       www.mdpi.com/journal/sustainability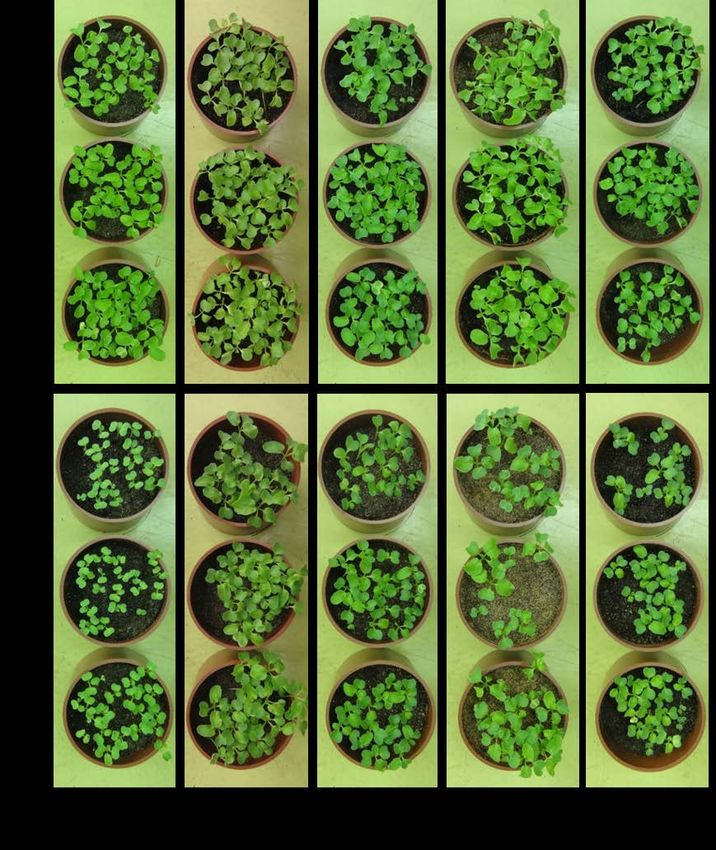
Sustainability 2020, 12, 4920                                                                        2 of 14

     A previous study on the density of BSF larvae reported that a larval density of 1.2 larvae/cm2
and a feeding rate of 163 mg/larva/day (dry base) were optimal for ideal organic waste disposal [7].
Although, in the case of one feeding, the individual larvae weight was more affected by the nutrient
concentration of the feed than the density of larvae [8].
     Efficient BSF larvae production methods are currently being investigated; however, very few
studies currently exist on the fertilizer value of BSFR made from HOW. In a recent study, a mixture of
municipal solid organic waste from factories and households was treated with BSF larvae [6]. This
study reported that the heavy metal content in municipal solid organic waste was reduced and the
heavy metal content in the residue was below the threshold for fertilizer use [6]. However, the study
did not investigate microorganisms in the residue and evaluate its effects on plants. Therefore, a
detailed evaluation of the HOW-derived BSFR has still not been conducted. Although some microbial
benefits of BSF larvae production have been reported, in particular a reduction in Escherichia coli in
livestock manure [9,10], it appears that only one study has investigated the microbiota of BSFR [11].
Furthermore, to date no detailed studies that analyzed the fertilizer value of BSFR exist. Thus, this
present study aimed to better explain the nutrient composition and suitability of BSFR as a fertilizer in
comparison with commercial compost.

2. Materials and Methods

2.1. Preparation of BSF Larvae and Experimental Household Organic Waste
     BSF eggs were obtained from an adult breeding department in a laboratory (Research Institute
of Environment, Agriculture and Fisheries, Osaka Prefecture) and the larvae were reared for seven
days following the methods described by Nakamura et al. [12]. Experimental household organic waste
(EHOW) was created according to a previous study [13]. Specifically, the composition of EHOW was
17% cabbage, 17% carrot, 16% potato, 10% horse mackerel, 8% ground pork, 5% apple pomace, 5%
banana peel, 4% grapefruit pomace, 4% orange pomace, 3% rice, 3% bread, 3% wheat noodle, 3%
Chinese noodle, and 2% eggshell. These ingredients were finely chopped using a food processor
and uniformly mixed to create EHOW. EHOW was frozen and stored at −20 ◦ C until required for
the experiments.

2.2. Chemical Composition of BSFR and Commercial Compost
     The seven-day-old BSF larvae were placed on EHOW (200 mg/larvae, dry base) at 27 ◦ C for
15 days to create BSFR. A composition analysis was undertaken to compare BSFR to cow, horse, and
poultry waste composts in order to clarify the value of BSFR as fertilizer and commercial compost.
     Concentration of total organic carbon (TOC), total nitrogen (TN), carbon to nitrogen ratio (C/N),
ammonium nitrogen (NH4 + -N), nitrate (NO3 -N), phosphorus (P), potassium (K), sodium (Na), copper
(Cu), calcium (Ca), iron (Fe), magnesium (Mg), zinc (Zn), manganese (Mn), crude ash, pH, and
electrical conductivity (EC) were measured. The concentration of carbon in each sample was analyzed
using a CHN analyzer (MT-6, YANACO, Tokyo, Japan) according to the manufacturer’s instructions.
Water content (950.01), total nitrogen (955.04), ammonium nitrogen (920.03), nitrate nitrogen (930.01),
phosphorus (958.01), potassium (983.02), sodium (965.09), copper (965.09), calcium (965.09), iron (965.09),
magnesium (965.09), zinc (965.09), and ash (955.03) within the samples were analyzed according to the
Official Methods of Analysis of the Association of Official Agricultural Chemists (AOAC) [14]. The
value of pH and EC were measured using a pH meter (pH-22B, HORIBA, Tokyo, Japan) and an EC
meter (EC-33B, HORIBA, Tokyo, Japan) according to the manufacturer’s instructions, respectively.

2.3. Analysis of Microbiota in BSFR and Commercial Compost by Amplicon Sequencing
    DNA was extracted from EHOW, BSFR, and three commercial composts (cow, horse, and
poultry composts) using a Fast DNA SPIN kit for soil (MP Biomedicals, California, CA, USA),
according to the manufacturer’s instructions. The variable region V3-V4 of bacterial 16S rRNA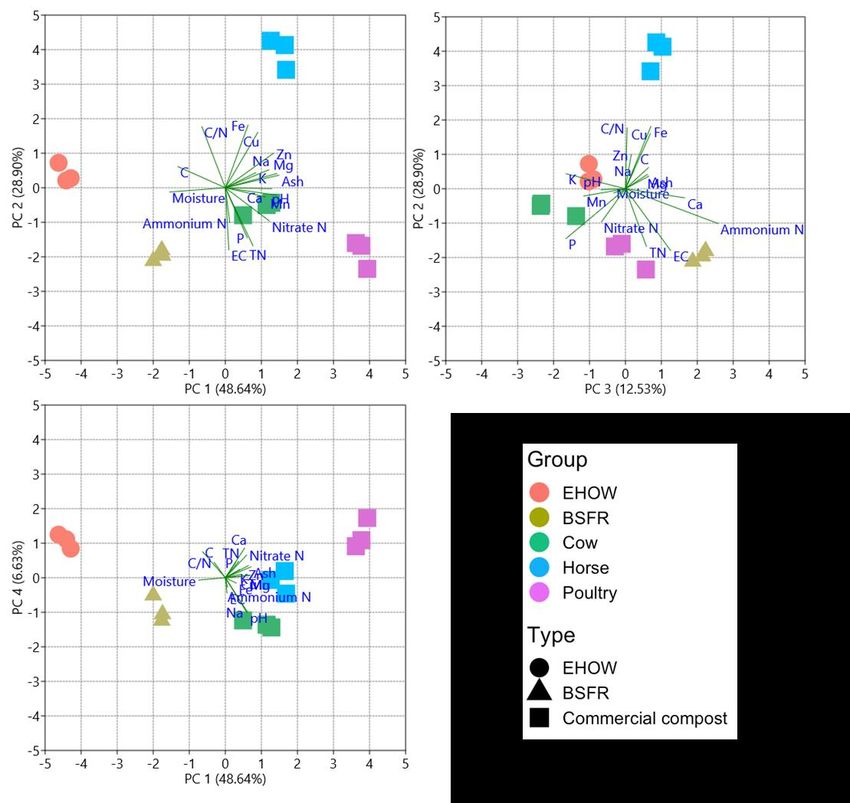
Sustainability 2020, 12, 4920                                                                                     3 of 14

genes were amplified using universal primers 341F (50 -CCTACGGGNGGCWGCAG-30 ) and 805R
(50 -GACTACHVGGGTATCTAATCC-30 ) [15]. The polymerase chain reaction (PCR) mixture was
composed of 10 µM forward primer, 10 µM reverse primer, 2 × KAPA HiFi HotStart ReadyMix (KAPA
BIOSYSTEMS, MA, USA), and the extracted fecal DNA template. The first set of PCR conditions were
as follows: initial denaturation at 94 ◦ C for 3 min, followed by 25 cycles of 94 ◦ C for 30 s, 55 ◦ C for 30 s,
and 72 ◦ C for 30 s, and a final extension step at 72 ◦ C for 10 min. The second set of PCR conditions for
index attachment were initial denaturation at 98 ◦ C for 30 s, followed by 8 cycles of 98 ◦ C for 30 s, 60 ◦ C
for 30 s, and 72 ◦ C for 30 s, and a final extension step at 72 ◦ C for 5 min. The amplicons were purified
using AMPure XP beads (Beckman Coulter, Brea, CA, USA). Paired-end sequencing of all libraries was
performed on an Illumina MiSeq sequencer (Illumina, San Diego, CA, USA) using a MiSeq Reagent kit
v3 (600 cycles; Illumina) according to the manufacturer’s instructions.

2.4. Plant Cultivation Test 1
      This experiment was conducted according to the methods issued by the Food and Agricultural
Materials Inspection Center [16]. For the experiment, pots (113ϕ × 65 mm) without drainage holes
were used. Each compost was used as a fertilizer and 250 g of soil sod (moisture 33.09%, TN 0.42%,
NH4 + -N 0.00%, NO3 -N 0.09%, K 0.05%, P 0.00%, ash 56.94%, pH 7.0, and EC 0.5 mS/cm) was sterilized
by an autoclave, placed in a plastic bag and stirred for 1 min. The TN content of each pot was adjusted
to 100 mg and 200 mg in each pot for two treatment groups—A group (n = 3) and B group (n = 3),
respectively. Thirty Komatsuna (Brassica rapa var. perviridis) seeds were sown in each pot. To prevent
the premature death of the Komatsuna, a 25 mg equivalent of chemical fertilizer (i.e., ammonium
sulfate, phosphorus pentoxide, and potassium oxide) was added to all groups. Table 1 shows the
fertilization amount in each treatment group and the contents of total nitrogen, available phosphoric
acid, and potassium in each group. After sowing the Komatsuna seeds, the plants were cultivated in a
constant temperature room at 25 ◦ C and 70% humidity for a 14-h light period and a 10-h dark period
for 21 days. To prevent the soil drying out, watering was undertaken once per day after germination.
The germination rate on day 5 and the fresh and dry weight of the above-ground portion on day 21
were measured.

                                  Table 1. Fertilization amount for the cultivation test 1.

                          Group                      EHOW          BSFR         Cow           Horse     Poultry
                         Amount Applied (g)          10.25         4.72         6.44           14.72     3.09
                           Nitrogen a (mg)           100.00       100.00       100.00         100.00    100.00
               A
                         Phosphorus a (mg)            6.54         2.34         5.99            3.62     3.41
                          Potassium a (mg)           267.28        89.68       90.14          1020.77   20.22
                         Amount Applied (g)          20.50         9.43        12.87           29.43     6.19
                           Nitrogen a (mg)           200.00       200.00       200.00         200.00    200.00
               B
                         Phosphorus a (mg)           13.08         4.69        11.99            7.24     6.83
                          Potassium a (mg)           534.56       179.37       180.28         2041.55   40.43
           a   Calculated amount. EHOW—experimental household organic waste, BSFR—black soldier fly residue.

2.5. Plant Cultivation Test 2
      This experiment was conducted according to the methods issued by the National Agriculture
and Food Research Organization [17]. The amounts of compost and sod applied from each group
are displayed in Table 2. The amount of poultry compost was decreased to half of the level of other
compost types to avoid excessive application of nitrogen. Unsterilized compost and 250 g of the
soil sod was placed in a plastic bag and stirred for 1 min. Then, mixed soil was placed into pots
(113ϕ × 65 mm) without drainage holes. Sixteen Komatsuna seeds were sown in each pot (n = 5).
After sowing, the plants were cultivated in a constant temperature room at 25 ◦ C and 70% humidity
for a 14-h light period and a 10-h dark period for 21 days. To prevent the soil drying out, watering was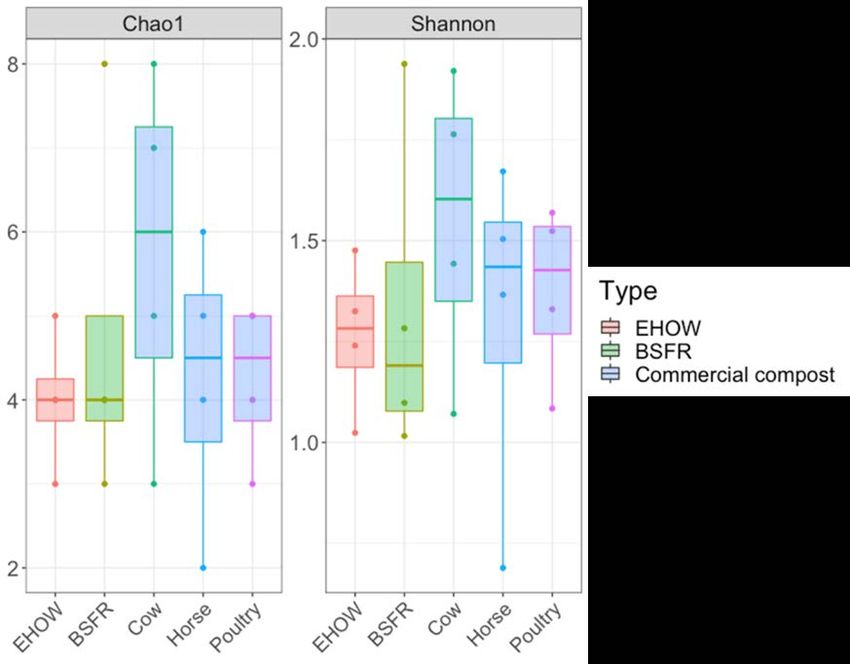
Sustainability 2020, 12, 4920                                                                                                4 of 14

undertaken once per day after germination. The germination rate on day 5 and the fresh weight of the
above-ground portion and total leaf number on day 21 were measured.

                                Table 2. Fertilization amount for the cultivation test 2.

             Group              Control          BSFR1         BSFR2       BSFR3         Cow           Horse       Poultry
     Amount applied (g)           0.00            25.18         12.60        8.33       25.20          25.52        12.49

2.6. Statistical Analysis
     The chemical composition and the results of the cultivation tests were statistically analyzed by
one-way analysis of variance (ANOVA), Games– Howell nonparametric post-hoc tests, Spearman
rank-order correlation coefficients (Spearman’s rho), and principal component analysis (PCA) on
the correlation matrix of the chemical composition using Statistical Product and Service Solutions
(SPSS) software (SPSS Statistics 25, International Business Machines Corporation, Armonk, NY,
USA). PCA was also performed using the statistical software PAST4.0 [18] and a biplot diagram was
created. The analysis of the microbiota data was performed according to the method described in
Kawasaki et al. [13].

3. Results

3.1. Chemical Composition of BSFR and Commercial Compost
     The chemical composition of each sample is shown in Table 2. The chemical composition of the
samples was significantly different between groups, excluding the value of K (Table 3). BSFR had the
highest concentration of NH4 + -N and highest EC value among the samples. The moisture content of
BSFR was lower than that of EHOW but higher than found in livestock manure. The C/N was lower
than EHOW and similar to the cattle manure. The nitrogen content of BSFR was similar to the poultry
manure. The nitrate nitrogen content of BSFR was the next highest, and the nitrate nitrogen content of
BSFR was the lowest among the composts. The P content of BSFR was almost equal to the EHOW.
BSFR had the highest value of Ca, but when compared to the livestock manure, the mineral content
of BSFR had lower values of all minerals. The ash content of BSFR was higher than EHOW but not
livestock. The pH of BSFR was neutral.

                      Table 3. Chemical composition of EHOW and fertilizers (dry matter basis).

                     Items       EHOW         BSFR         Cow          Horse       Poultry   SEM        p-Value
                 Moisture (%)    78.01a       55.60b       39.98c       27.80d      14.21e      5.93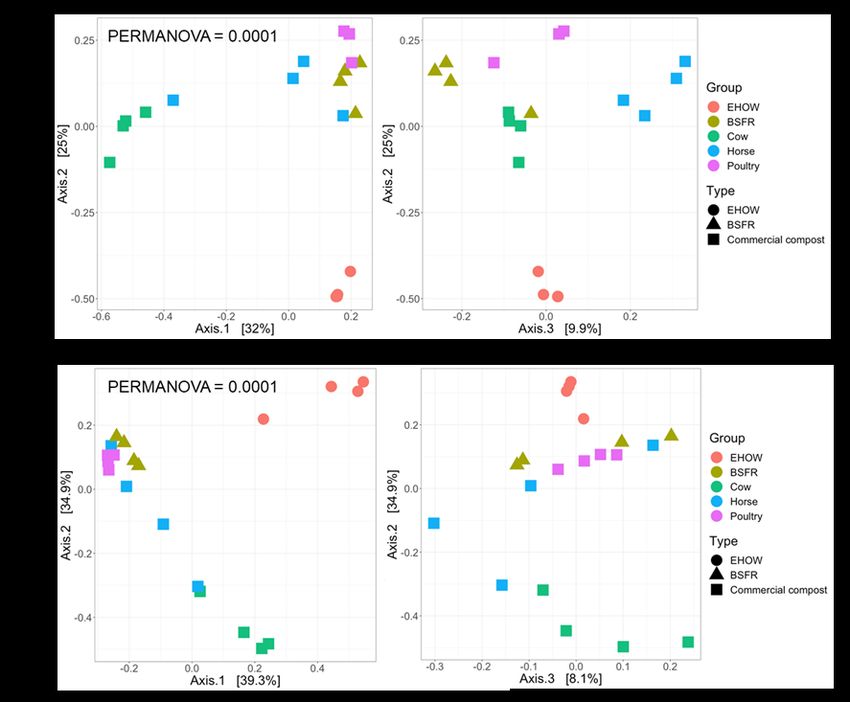
Sustainability
Sustainability   2020,
               2020, 12,12, x FOR PEER REVIEW
                         4920                                                                                   5 14
                                                                                                             5 of of 14

        Different alphabet characters indicate significant difference (Games–Howell nonparametric post-hoc
3.2. PCA  of pthe
       test,      Chemical
               < 0.05).    Composition
                        SEM—standard error of the mean. p-values were computed by one-way ANOVAs and
        represent the significant differences in the results.
     The   PCA plot is shown in Figure 1. The correlation coefficients between each chemical component
are shown in Supplementary Table S1. The PCA on the correlation matrix of the chemical composition
  3.2. PCA of the Chemical Composition
showed four components with eigenvalues higher than 1 (Supplementary Table S2). The contributing
rate of The
         eachPCA    plot iscomponent
                principal   shown in Figure    1. The
                                        (PC) was    PCcontributing
                                                        1, 47.55%; PCrate2,of28.90%;
                                                                              each principal  component
                                                                                      PC 3, 13.02%;  PC 4,(PC)    was
                                                                                                             6.10%;
  PCthe
and    1, total
          47.55%;   PC 2, 28.90%;
                contributing  rate ofPC
                                      the3,three
                                            13.02%;   PC 4, 6.10%;
                                                 components         and theBSFR
                                                               was 95.57%.     total plotted
                                                                                     contributing  rateEHOW
                                                                                             between     of the and
                                                                                                                 three
  components
cow               was 95.57%.
     in PC 1, plotted    close toBSFR  plotted
                                  poultry   in PCbetween   EHOW
                                                   2, plotted close and  cow in PC
                                                                    to horse      PC 3,
                                                                                      1, and
                                                                                         plotted closeclose
                                                                                             plotted    to poultry
                                                                                                             to cowin
  PChorse
and   2, plotted
             in PCclose
                    4. to horse in PC 3, and plotted close to cow and horse in PC 4.

                               Figure    Principal
                                      1. 1.
                                 Figure            component
                                            Principal        analysis
                                                      component       of of
                                                                analysis thethe
                                                                              groups.
                                                                                groups.

3.3. Relative Abundance in Microbiota of BSFR and Commercial Compost
  3.3. Relative Abundance in Microbiota of BSFR and Commercial Compost
     Up to 10 highly abundant bacteria were identified for each study group (Table 4). The most
       Up to 10 highly abundant bacteria were identified for each study group (Table 4). The most
abundant bacteria for BSFR was Bacillaceae, similar to poultry. However, Sporosarcina and
  abundant bacteria for BSFR was Bacillaceae, similar to poultry. However, Sporosarcina and
Xanthomonadaceae, which recorded the second and third highest abundance in the microbiota of
  Xanthomonadaceae, which recorded the second and third highest abundance in the microbiota of
BSFR, did not show high abundance of microbiota in any other group. Lactobacillales, Carnobacterium,
  BSFR, did not show high abundance of microbiota in any other group. Lactobacillales,
and Escherichia, were observed in high abundance within the microbiota of EHOW, but were not found
  Carnobacterium, and Escherichia, were observed in high abundance within the microbiota of EHOW,
in high abundance in BSFR. Corynebacterium, Bacillus, Virgibacillus, and Aerococcaceae were detected in
  but were not found in high abundance in BSFR. Corynebacterium, Bacillus, Virgibacillus, and
BSFR and also in horse, poultry, or both. Trichococcus, Natronobacillus and Erysipelotrichaceae were
  Aerococcaceae were detected in BSFR and also in horse, poultry, or both. Trichococcus, Natronobacillus
detected only in BSFR.
  and Erysipelotrichaceae were detected only in BSFR.
Sustainability 2020, 12, 4920 6 of 14
Table 4. The 10 most abundant microbial taxonomic groups (relative abundance, %) in the samples.
EHOW BSFR Cow Horse Poultry
No.
Taxonomy (%) Taxonomy (%) Taxonomy (%) Taxonomy (%) Taxonomy (%)
1 Lactobacillales 31.33 Bacillaceae 22.91 Halomonas 15.27 Bacillales 16.52 Bacillaceae 51.31
2 Carnobacterium 21.55 Sporosarcina 13.21 Georgenia 10.27 [Weeksellaceae] 9.61 Bacillales 21.69
3 Escherichia 16.68 Xanthomonadaceae 9.82 Bacillaceae 7.75 Pseudomonas 6.64 Corynebacterium 5.79
4 Enterococcus 11.16 Corynebacterium 9.49 Sphingobacteriaceae 7.20 Jonesiaceae 4.41 Yaniella 4.99
5 Lactococcus 5.06 Bacillus 8.05 Flavobacteriaceae 6.68 Bacillus 3.45 Aerococcaceae 2.55
6 Vagococcus 3.63 Virgibacillus 6.22 Promicromonosporaceae 4.73 Corynebacterium 3.34 Virgibacillus 2.15
7 Lactobacillus 2.54 Trichococcus 4.54 Marinimicrobium 3.42 Porphyromonadaceae 3.32 Bacillus 1.93
8 Proteus 1.47 Aerococcaceae 4.51 KSA1 2.83 Alcaligenaceae 3.04 Lactobacillus 0.94
9 Pseudomonas 1.18 Natronobacillus 3.39 Clostridia 2.83 Georgenia 2.49 Salinicoccus 0.88
10 Enterococcaceae 1.06 Erysipelotrichaceae 2.92 Bacillales 2.39 Bacillaceae 2.17 Lentibacillus 0.65
Total 95.66 85.05 63.36 54.99 92.88
Microbial classification at the lowest possible taxonomic level and their relative abundance in the microbiota of the samples (n = 4).Sustainability
Sustainability 2020, 12,12,
2020, x FOR PEER REVIEW
4920 77ofof1414
3.4.Analysis
3.4. AnalysisofofMicrobial
MicrobialDiversity
Diversityforforbetween
betweenGroups
Groups
Whenα-diversity
When α-diversity(Chao
(Chao1 1index:
index:richness,
richness,Shannon
Shannonindex:
index:evenness)
evenness)was
wascompared
comparedamong
amongthethe
groups, no significant difference among groups was observed for any α-diversity index (Figure 2).
groups, no significant difference among groups was observed for any α-diversity index (Figure 2).
Figure
Figure 2. 2.Alpha
Alpha diversity
diversity indices
indices (Chao1
(Chao1 andand Shannon)
Shannon) of microbial
of microbial communities
communities in groups
in the the groups
(n = (n
4). =
4). ANOVA—analysis
ANOVA—analysis of variance.
of variance.
Regardingβ-diversity
Regarding β-diversitybased
basedononunweighted
unweightedand
andweighted
weightedUniFrac
UniFracdistance,
distance,BSFRBSFRand
andpoultry
poultry
wereclosely
were closelyclustered
clusteredininthe
theprincipal
principalcoordinate
coordinateanalysis
analysis (PCoA)
(PCoA) plots
plots of
of the
the first
first three
three axes
axes(axes
(axes1,
1,2,2, and
and 3;
3; Figure 3). BSFR data were located away from those of EHOW and Cow. Permutational
Figure 3). BSFR data were located away from those of EHOW and Cow. Permutational
multivariateanalysis
multivariate analysisofofvariance
variance(PERMANOVA)
(PERMANOVA)indicated
indicatedthat
thatthe
theβ-diversity
β-diversityininthethemicrobiota
microbiotaofof
groups had differences among groups (PERMANOVA <
the groups had differences among groups (PERMANOVA < 0.05; Figure 3).
the 0.05; Figure 3).
3.5. Plant Cultivation Test 1 (Same Amount of Nitrogen)
On day five of the experiment, the germination rate for the Komatsuna seeds was lower in all
groups when starting N was 200 mg, compared to 100 mg (Table 5). BSFR showed the highest value
when starting total nitrogen was 100 mg, while horse showed the highest value for the above-ground
fresh weight of Komatsuna when starting total nitrogen was 200 mg on day 21. BSFR showed the
highest above-ground dry weight of Komatsuna regardless of the starting N amount (p < 0.05). There
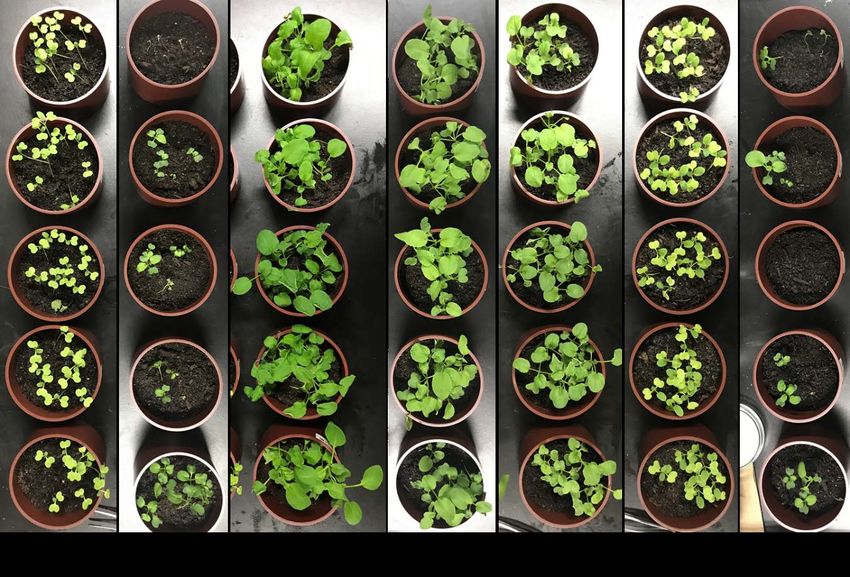
was no difference in the physical appearance of Komatsuna on day 21 in A group, but EHOW revealed
smaller leaves and one pot with a low germination rate was recorded for horse (Figure 4).Sustainability 2020, 12, 4920 8 of 14
Sustainability 2020, 12, x FOR PEER REVIEW 8 of 14
Figure
Figure 3.
3. Beta
Betadiversity
diversityofofmicrobial
microbialcommunities
communitiesininthe
thesamples
samples(n(n
= 4). (a) (a)
= 4). Unweighted andand
Unweighted (b)
weighted UniFrac distance principal coordinate analysis plots of β-diversity measures
(b) weighted UniFrac distance principal coordinate analysis plots of β-diversity measures of the of the
microbiota
microbiota communities
communities inin the
the samples
samples (n
(n ==4).
4).PERMANOVA—permutational
PERMANOVA—permutational multivariate
multivariate ANOVA.
ANOVA.
3.5. Plant
TableCultivation Test
5. Results of the1 cultivation
(Same Amounttest 1ofshowing
Nitrogen)
germination rate, fresh weight, and dry weight
of Komatsuna.
On day five of the experiment, the germination rate for the Komatsuna seeds was lower in all
groups when starting
Group
N was 200 mg,EHOW compared BSFR
to 100 mg Cow
(Table 5). BSFR
Horse
showedSEM
Poultry
the highest
p-value
value
when starting total nitrogen was 100 mg, while horse showed the highest value for the above-ground
Germination rate (%) 72.22 70.00 67.78 72.22 70.00 3.01 0.99
A Fresh weight (mg/strain) 141.36 172.10 157.49 171.49 129.60 7.41 0.29
fresh weight ofDryKomatsuna when starting
weight (mg/strain) 9.35 total nitrogen
11.45 10.96was 200 8.67mg on8.71 day 21. 0.40
BSFR showed 0.04 the
highest above-ground dryrate
Germination weight
(%) of Komatsuna
42.22 regardless
42.22 51.11 of the starting
32.22 N
44.44 amount2.59(p < 0.05).
0.25 There
B Fresh weight (mg/strain) 68.71a 149.98bc 124.41bc 156.41c 99.48ab 9.05Sustainability 2020, 12, x FOR PEER REVIEW 9 of 14
SEM—standard
Sustainability error of the mean. p-values were computed by one-way ANOVAs and represent the9 of 14
2020, 12, 4920
significant differences in the results.
Figure 4. Plants on day 21 of the cultivation subjected to the two N levels ((A) = 100 mg, (B) = 200 mg)
Figure 4. Plants on day 21 of the cultivation subjected to the two N levels ((A) = 100 mg, (B) = 200 mg)
and the tested organic matrices (EHOW, BSFR, cow manure compost, horse manure compost, poultry
and the tested organic matrices (EHOW, BSFR, cow manure compost, horse manure compost, poultry
manure compost) (plant cultivation test 1).
manure compost) (plant cultivation test 1).
3.6. Plant
TableCultivation
6. Results ofTest
the 2
cultivation test 2 showing germination rate, total leaf number, and fresh weight
of Komatsuna.
On day five of the experiment, the germination rate for the Komatsuna seeds was lower in BSFR1
and poultryGroup
(p < 0.05). TheControl
total leaf number
BSFR1 of Komatsuna
BSFR2 BSFR3 on dayHorse
Cow 21 revealed
Poultrythe SEM
highestp-value
value for
BSFR2, while BSFR1 recordeda the lowest 53.75 a
value. On day 21, the fresh weight
57.50 ac
of the above-groundGroup Control BSFR1 BSFR2 BSFR3 Cow Horse Poultry SEM p-value
Germination rate (%) 85.00 53.75 a 73.75 75.00 78.75 86.25 b 57.50 ac 2.57Sustainability 2020, 12, 4920 11 of 14
inhibited and their growth will be damaged [27]. Thus, higher negative PC values would indicate
that the sample is close to the unfermented condition and does not sufficiently work as a fertilizer.
In PC 2, negative correlations were found for TN, P, and EC, while positive correlations were found
for C/N ratio, Cu, and Fe. These results indicate that for PC 2, when the value of the PC increased
negatively, the sample was rich in TN and P, and the EC value was also high; when the value of the PC
increased positively, the C/N ratio was high and the Cu and Fe content were high. In PC 3, there was a
positive correlation with ammonium nitrogen, which suggests that the concentration of NH4 + -N was
higher when the PC value was positively increased. In PC 4, each sample plotted in approximately the
same position, a situation that also makes it difficult to characterize the other PC. PC 1 represents the
compost characteristics of each sample, and PCs 2 and 3 represent the detailed compost characteristics
that support PC 1.
The livestock manures are plotted at different locations in the plots of PC 1 and 2 due to their
corresponding characteristics. Despite this, they are considered ready for use as fertilizer. The plots
demonstrated that EHOW was plotted at a farther distance from the livestock manures and is not
ready for use as a fertilizer in its original condition. Although BSFR is closer to livestock manures
than EHOW, it had high moisture and a high EC value for the conditions used in this study. Therefore,
BSFR can be better processed for fertilizer use by increasing the period of larval processing, drying,
and reducing the organic matter.
The top 10 microbiota for BSFR in terms of relative abundance were similar to those in poultry, but
the structure of BSFR demonstrated a distinct composition. Unlike poultry manure, BSFR is not subject
to composting for a long period of time, which was evident from its chemical composition. This may
occur because BSFR is a dry product of animal feces. Sporosarcina, which exhibited a high abundance of
BSFR microbiota was also detected in the BSF larvae and the feed residue [11]. Hence, this suggests that
Sporosarcina originated from larvae. In the α diversity, BSFR did not show any significant differences
with other commercial composts, indicating that the diversity of constituent bacteria was similar to
commercial composts. In the β diversity, BSFR plotted at far distances from EHOW, which suggests
that changes in the constituent bacteria were caused by larval processing. Moreover, although BSFR
plotted near horse, it was plotted closest to poultry, indicating that the microbiota of BSFR was closest
to that of poultry manure, similar to the results of the top 10 bacterial composition.
It is important to determine whether BSFR is safe for plant and human health when considering
its use as a fertilizer. The abundance of Escherichia in EHOW was reduced by larval processing, which
confirms that BSFR can be used as a fertilizer, in addition to a commercial compost. However, caution
should be taken in the application of BSFR as a fertilizer for vegetables of Brassicaceae, vineyards, or
citrus orchards, as Xanthomonadaceae was recorded in high abundance in the microbiota of BSFR.
This family includes two genera Xanthomonas and Xylella which can cause disease in plants [28–31].
In the Komatsuna cultivation test, there was no difference in the germination rate for standard
condition A when fertilizer was applied to a starting total of 100 mg of total nitrogen per pot. Although
BSFR contains Xanthomonadaceae, which includes a potentially disease-causing bacteria, no pathogens
were observed in the Komatsuna during the cultivation test and they appeared to grow normally.
Moreover, under condition A, the highest values for the fresh and dry weights of the Komatsuna were
from BSFR. Hence, BSFR can be applied as a commercial fertilizer if the amount of nitrogen is adjusted
to standard application levels. The conversion of organic waste into BSFR by BSF larvae is better than
using organic waste as fertilizer directly as the germination rates of EHOW and the BSFR Komatsuna
were almost the same under condition B. However, the fresh and dry weights for the day 21 EHOW
and BSFR Komatsuna were more than twice as high in the initial BSFR group. The common fertilizer
values (nitrogen, phosphorus, and potassium) and the values of other chemical compositions that were
altered by larval processing may have affected Komatsuna growth. This is strongly suggested by the
weakly acidic pH that is suitable for growing plants but was only recorded in EHOW [16], as well as
the fresh weight which was the lowest of all groups. Therefore, rather than directly using the organic
waste as a fertilizer it is beneficial in plant production to use organic waste as feed for BSF larvae andSustainability 2020, 12, 4920 12 of 14
then use the residue as fertilizer. Under the conditions of the present study, it is evident that if BSFR is
applied at 1/20 of the amount of soil, then there is no yellowing of leaves due to nitrogen deficiency,
which was observed in the horse group. This result was also apparent when BSFR was applied at 1/30
of the amount of soil. The germination of Komatsuna was inhibited when 1/10 of the amount of BSFR
was applied to the soil. These results indicate that applying such a large amount of BSFR to the soil is
not recommended. This recommendation is further reinforced as BSFR recorded the highest EC value.
5. Conclusions
In summary, BSFR derived from EHOW could be an incomplete compost based on its chemical
composition for short term larval processing. This process mainly focuses on larvae production, but it
contains a significant amount of ammonium nitrogen which could be an effective N source for plant
nutrition. This may reduce environmental pollution of nitrates in the soil, which is typical of several
composts that are not properly stabilized. However, the presence of plant pathogens in the BSFR
microbiota needs to be considered. The effects of BSFR on the environment, soil microbial community,
and plant productivity require more detailed investigation in a mid-term experiment.
Supplementary Materials: The following are available online at http://www.mdpi.com/2071-1050/12/12/4920/s1.
Table S1: Spearman rank-order correlation coefficients of the chemical composition of the samples. Table S2:
Component Matrixa of the variables.
Author Contributions: Writing—original draft preparation, K.K.; writing—review and editing, T.K., H.H., Y.M.,
and Y.F.; insect preparation, H.H.; examination, K.K. and T.K.; data analysis, K.K. and T.K.; project administration,
K.K., Y.M., and Y.F.; and funding acquisition, K.K., Y.M., and Y.F. All authors have read and agreed to the published
version of the manuscript.
Funding: This research was supported by the Environment Research and Technology Development Fund (1-1604)
of the Ministry of the Environment, Japan.
Acknowledgments: We thank Shun-ichiro Iwase, Tomohiro Seyama, Akihisa Izumo, Koji Kasai, and the staff of
the Research Institute of Environment, Agriculture and Fisheries, Osaka Prefecture for their assistance in taking
care of the insects.
Conflicts of Interest: The authors declare no conflict of interest.
References
1. Čičková, H.; Newton, G.L.; Lacy, R.C.; Kozánek, M. The use of fly larvae for organic waste treatment.
Waste Manag. 2015, 35, 68–80. [CrossRef] [PubMed]
2. van Huis, A.; van Itterbeeck, J.; Klunder, H.; Mertens, E.; Halloran, A.; Muir, G.; Vantomme, P. Future Prospects
for Food and Feed Security; Food and Agriculture Organization of the United Nations: Rome, Italy, 2013;
Volume 171, ISBN 9789251075951.
3. Wang, Y.-S.; Shelomi, M. Review of Black Soldier Fly (Hermetia illucens) as Animal Feed and Human Food.
Foods 2017, 6, 91. [CrossRef] [PubMed]
4. Cutrignelli, M.I.; Messina, M.; Tulli, F.; Randazzi, B.; Olivotto, I.; Gasco, L.; Loponte, R.; Bovera, F. Evaluation
of an insect meal of the Black Soldier Fly (Hermetia illucens) as soybean substitute: Intestinal morphometry,
enzymatic and microbial activity in laying hens. Res. Vet. Sci. 2018, 117, 209–215. [CrossRef] [PubMed]
5. Charlton, A.J.; Dickinson, M.; Wakefield, M.E.; Fitches, E.; Kenis, M.; Han, R.; Zhu, F.; Kone, N.; Grant, M.;
Devic, E.; et al. Exploring the chemical safety of fly larvae as a source of protein for animal feed. J. Insects
Food Feed 2015, 1, 7–16. [CrossRef]
6. Sarpong, D.; Oduro-Kwarteng, S.; Gyasi, S.F.; Buamah, R.; Donkor, E.; Awuah, E.; Baah, M.K. Biodegradation
by composting of municipal organic solid waste into organic fertilizer using the black soldier fly (Hermetia
illucens) (Diptera: Stratiomyidae) larvae. Int. J. Recycl. Org. Waste Agric. 2019, 8, 45–54. [CrossRef]
7. Parra Paz, A.S.; Carrejo, N.S.; Gómez Rodríguez, C.H. Effects of Larval Density and Feeding Rates on
the Bioconversion of Vegetable Waste Using Black Soldier Fly Larvae Hermetia illucens (L.), (Diptera:
Stratiomyidae). Waste Biomass Valorization 2015, 6, 1059–1065. [CrossRef]Sustainability 2020, 12, 4920 13 of 14
8. Barragan-Fonseca, K.B.; Dicke, M.; van Loon, J.J.A. Influence of larval density and dietary nutrient
concentration on performance, body protein, and fat contents of black soldier fly larvae (Hermetia illucens).
Entomol. Exp. Appl. 2018, 166, 761–770. [CrossRef]
9. Erickson, M.C.; Islam, M.; Sheppard, C.; Liao, J.; Doyle, M.P. Reduction of Escherichia coli O157:H7 and
Salmonella enterica serovar enteritidis in chicken manure by larvae of the black soldier fly. J. Food Prot. 2004,
67, 685–690. [CrossRef]
10. Liu, Q.; Tomberlin, J.K.; Brady, J.A.; Sanford, M.R.; Yu, Z. Black Soldier Fly (Diptera: Stratiomyidae) Larvae
Reduce Escherichia coli in Dairy Manure. Environ. Entomol. 2008, 37, 1525–1530. [CrossRef]
11. Wynants, E.; Frooninckx, L.; Crauwels, S.; Verreth, C.; De Smet, J.; Sandrock, C.; Wohlfahrt, J.; Van Schelt, J.;
Depraetere, S.; Lievens, B.; et al. Assessing the Microbiota of Black Soldier Fly Larvae (Hermetia illucens)
Reared on Organic Waste Streams on Four Different Locations at Laboratory and Large Scale. Microb. Ecol.
2019, 77, 913–930. [CrossRef]
12. Nakamura, S.; Ichiki, R.T.; Shimoda, M.; Morioka, S. Small-scale rearing of the black soldier fly, Hermetia
illucens (Diptera: Stratiomyidae), in the laboratory: low-cost and year-round rearing. Appl. Entomol. Zool.
2016, 51, 161–166. [CrossRef]
13. Kawasaki, K.; Hashimoto, Y.; Hori, A.; Kawasaki, T.; Hirayasu, H.; Iwase, S.I.; Hashizume, A.; Ido, A.;
Miura, C.; Miura, T.; et al. Evaluation of black soldier fly (Hermetia illucens) larvae and pre-pupae raised on
household organic waste, as potential ingredients for poultry feed. Animals 2019, 9, 98. [CrossRef] [PubMed]
14. AOAC. Official Methods of Analysis of the Association of Official Analytical Chemists, 17th ed.; Horwitz, W., Ed.;
AOAC international: Gaithersburg, MA, USA, 2002; ISBN 0-93558-67-6.
15. Klindworth, A.; Peplies, J.; Pruesse, E.; Schweer, T.; Glöckner, F.O.; Quast, C.; Horn, M. Evaluation of general
16S ribosomal RNA gene PCR primers for classical and next-generation sequencing-based diversity studies.
Nucleic Acids Res. 2013, 41, e1. [CrossRef]
16. Food and Agricultural Materials Inspection Center (FAMIC). Method and Explanation of Cultivation Test for
Plants; FAMIC: Saitama, Japan, 2017.
17. National Agricuiture and Food Research Organization. A Simple Method for Evaluating The Quality of
Compost by Juvenile Plant Tests. Available online: https://www.naro.affrc.go.jp/training/files/20031006-08-2.
pdf (accessed on 8 June 2020).
18. Hammer, Ø.; David, A.T.H.; Paul, D.R. PAST: Paleontological statistics package for education and data
analysis. Palaeontol. Electron. 2001, 4, 1–9.
19. WHO. Guidelines for Drinking-Water Quality: Fourth Edition Incorporating the First Addendum, 4th ed.; World
Health Organization: Geneva, Switzerland, 2017; ISBN 9789241549950.
20. Kolay, A.K. Fertilisers: Properties and Uses. In Manures and Fertilizers; ATLANTIC: New Delhi, India, 2007;
pp. 78–116. ISBN 978-8126908103.
21. Rochette, P.; Angers, D.A.; Chantigny, M.H.; Gasser, M.O.; MacDonald, J.D.; Pelster, D.E.; Bertrand, N. NH3
volatilization, soil NH4+concentration and soil pH following subsurface banding of urea at increasing rates.
Can. J. Soil Sci. 2013, 93, 261–268. [CrossRef]
22. Nieder, R.; Benbi, D.K.; Scherer, H.W. Fixation and defixation of ammonium in soils: A review. Biol. Fertil.
Soils 2011, 47, 1–14. [CrossRef]
23. Krupa, S.V. Effects of atmospheric ammonia (NH3) on terrestrial vegetation: A review. Environ. Pollut. 2003,
124, 179–221. [CrossRef]
24. Wellburn, A.R. Tansley Review No. 24 Why are atmospheric oxides of nitrogen usually phytotoxic and not
alternative fertilizers? New Phytol. 1990, 115, 395–429. [CrossRef]
25. Sasaki, N.; Suehara, K.-I.; Kohda, J.; Nakano, Y.; Yang, T. Effects of ratio and pH of raw materials on oil
degradation efficiency in a compost fermentation process. J. Biosci. Bioeng. 2003, 96, 47–52. [CrossRef]
26. Sundberg, C.; Smårs, S.; Jönsson, H. Low pH as an inhibiting factor in the transition from mesophilic to
thermophilic phase in composting. Bioresour. Technol. 2004, 95, 145–150. [CrossRef]
27. de Bertoldi, M.; Vallini, G.; Pera, A. The biology of composting: A review. Waste Manag. Res. 1983, 1, 157–176.
[CrossRef]
28. An, S.Q.; Potnis, N.; Dow, M.; Vorhölter, F.J.; He, Y.Q.; Becker, A.; Teper, D.; Li, Y.; Wang, N.; Bleris, L.; et al.
Mechanistic insights into host adaptation, virulence and epidemiology of the phytopathogen Xanthomonas.
FEMS Microbiol. Rev. 2019, 44, 1–32. [CrossRef] [PubMed]
29. European Food Safety Authority (EFSA). Update of the Xylella spp. host plant database. EFSA J. 2018, 16.Sustainability 2020, 12, 4920 14 of 14
30. Hopkins, D.L.; Purcell, A.H. Xylella fastidiosa: Cause of pierce’s disease of grapevine and other emergent
diseases. Plant Dis. 2002, 86, 1056–1066. [CrossRef]
31. Ryan, R.P.; Vorhölter, F.-J.; Potnis, N.; Jones, J.B.; Van Sluys, M.-A.; Bogdanove, A.J.; Dow, J.M. Pathogenomics
of Xanthomonas: understanding bacterium–plant interactions. Nat. Rev. Microbiol. 2011, 9, 344–355.
[CrossRef] [PubMed]
© 2020 by the authors. Licensee MDPI, Basel, Switzerland. This article is an open access
article distributed under the terms and conditions of the Creative Commons Attribution
(CC BY) license (http://creativecommons.org/licenses/by/4.0/).You can also read


