Hidden Link Prediction in Criminal Networks Using the Deep Reinforcement Learning Technique - MDPI
←
→
Page content transcription
If your browser does not render page correctly, please read the page content below
computers
Article
Hidden Link Prediction in Criminal Networks Using
the Deep Reinforcement Learning Technique
Marcus Lim 1, *, Azween Abdullah 1 , NZ Jhanjhi 1        and Mahadevan Supramaniam 2
 1   School of Computing and IT (SoCIT), Taylor’s University, 47500 Subang Jaya, Selangor, Malaysia;
     azween.abdullah@taylors.edu.my (A.A.); NoorZaman.Jhanjhi@taylors.edu.my (NZ.J.)
 2   Research and Innovation Management Center, SEGI University, 47810 Petaling Jaya, Selangor Darul Ehsan,
     Malaysia; mahadevans@segi.edu.my
 *   Correspondence: marcus@gbisns.com; Tel.: +60-11-1005-5838

 Received: 23 October 2018; Accepted: 21 December 2018; Published: 11 January 2019

 Abstract: Criminal network activities, which are usually secret and stealthy, present certain difficulties
 in conducting criminal network analysis (CNA) because of the lack of complete datasets. The
 collection of criminal activities data in these networks tends to be incomplete and inconsistent,
 which is reflected structurally in the criminal network in the form of missing nodes (actors) and
 links (relationships). Criminal networks are commonly analyzed using social network analysis
 (SNA) models. Most machine learning techniques that rely on the metrics of SNA models in the
 development of hidden or missing link prediction models utilize supervised learning. However,
 supervised learning usually requires the availability of a large dataset to train the link prediction
 model in order to achieve an optimum performance level. Therefore, this research is conducted
 to explore the application of deep reinforcement learning (DRL) in developing a criminal network
 hidden links prediction model from the reconstruction of a corrupted criminal network dataset. The
 experiment conducted on the model indicates that the dataset generated by the DRL model through
 self-play or self-simulation can be used to train the link prediction model. The DRL link prediction
 model exhibits a better performance than a conventional supervised machine learning technique,
 such as the gradient boosting machine (GBM) trained with a relatively smaller domain dataset.

 Keywords: hidden link prediction; deep reinforcement learning; criminal network analysis; social
 network analysis

1. Introduction
     Research related to graph theory and network analysis in the field of social science [1] pioneered
the development of social network analysis (SNA) methodologies. Graph theory provides the
conceptual constructs, methods, and techniques in graph analysis. The SNA methodologies combine
graph theory with the application of analytical techniques and visualization tools developed specifically
for the analysis of social networks and other networks [2]. The methodologies and techniques of
criminal network analysis (CNA) are mainly adopted and adapted from SNA analytical models and
metrics [3]. Some commercial social networks, such as Facebook and recommender systems, introduce
potential friends based on an SNA link prediction technique [4].
     Criminal networks, in particular, exhibit a relatively high propensity to have hidden or missing
links because of the covert and stealthy nature of criminal activities [3]. This characteristic of criminal
networks is often due to incomplete, incorrect, and inconsistent captured data, either caused by
deliberate deception on the part of criminals or unintentional human error by law enforcement
personnel. Therefore, the common practise and techniques of predicting potential links between nodes

Computers 2019, 8, 8; doi:10.3390/computers8010008                         www.mdpi.com/journal/computers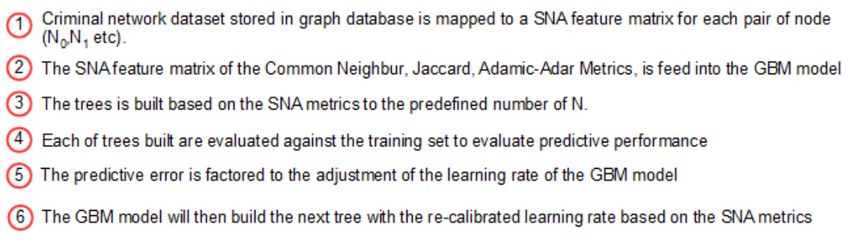
Computers 2019, 8, 8                                                                                2 of 13

within most social networks have become highly relevant and critical in the discovery of missing or
hidden links within criminal networks.
     Social network analysis metrics used in link prediction may be derived from either structural
or content-related measures of a network. The typical structural and content-based measures
are neighbourhood-based metrics, Katz-based metrics, and random walk-based metrics. The
neighbourhood-based measures include the common neighbour, Jaccard index, and Adamic-Adar
index [5]. Deep reinforcement learning (DRL) refers to the machine learning technique of incorporating
deep neural networks into the framework of reinforcement learning (RL) to achieve a general artificial
intelligence capable of self-learning [6]. Deep neural network or deep learning is one of the fields
of machine learning methods based on the representation learning of structural patterns from a
large dataset in contrast to predefined task algorithms. Representation learning can be supervised,
semi-supervised, or unsupervised [7–9]. Reinforcement learning is a technique in machine learning
where programs, known as agents, interact with familiar or new environments in which the agents
continuously adapt and learn based on points awarded upon completion of a task. The points awarded
are labelled as rewards or punishments if positive or negative, respectively [9]. This approach is
different from the usual supervised machine learning approach as it does not rely on the use of
training datasets [6].
     The design of an RL agent involves defining the policy learning and value learning functions.
Policy learning relates to the modelling of the domain rules into the agent algorithm that maximizes
the rewards from each action, while value learning relates to the modelling of the agent algorithm that
maximizes the expected future returns of an action by generalizing from the values aggregated from all
prior iterations of states and action pairs [9]. Both policy and value learning functions can be trained
using neural networks, which then form the policy and value networks of the RL agent, respectively.
     One of the challenges of incorporating RL in the development of a hidden link prediction and
reconstruction model is identifying suitable features of the dataset to train the value network to perform
the task of function approximation [10]. Function approximation is a method of supervised learning,
the application of which can be found in the fields of machine learning, artificial neural networks,
pattern recognition, and statistical learning [11,12]. The value network is designed to provide weights
to the edges of the network dataset based on the probability of hidden links being an edge calculated
using link prediction metrics. For the purpose of this research, RL and neural network techniques
are leveraged upon to provide a DRL approach in the construction of the function approximator [6].
The value network function approximator will identify the node pairs with the highest probability of
having missing or hidden links to initiate a tree search in a network traversal.

Problem Definition
      Supervised machine learning models usually require large datasets for training to achieve an
optimum level of predictive performance. The significance of using a large dataset to assess the
predictive performance of link prediction models has been demonstrated by Emrah Budur et al. [13]
using the supervised learning technique known as the gradient boosting machine (GBM). The primary
objective of this current research is to develop a criminal network link prediction and reconstruction
model that can be trained on a relatively smaller dataset using the DRL technique without any
significant deterioration in the predictive performance. The performance of the criminal networks link
prediction model depends on the efficiency of the algorithms developed for both the deep learning
and RL in the DRL technique.
      In this research, the performance of the DRL technique is benchmarked against the performance
of a conventional GBM model, which has been investigated by Emrah Budur et al. [13], in the domain
of criminal networks link prediction. The respective performances of the hidden link prediction
models based on GBM and DRL are evaluated using the accuracy metrics of area under the curve
(AUC) and the confusion matrix. The criminal network dataset used for this research is based on the
UCINET cocaine smuggling dataset, which contains a dichotomous adjacency matrix of drug users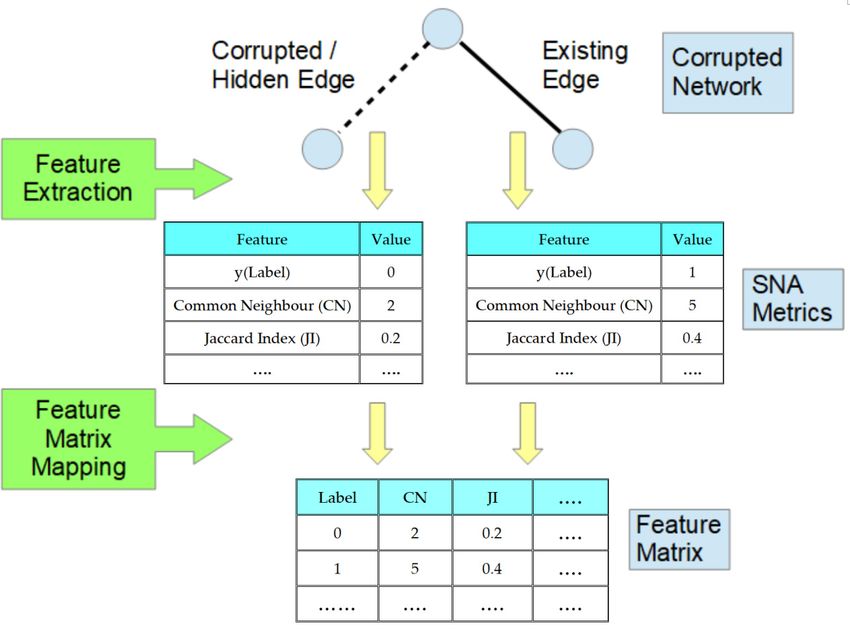
Computers 2019, 8, 8                                                                              3 of 13

in Hartford [5]. The relatively small dataset used in this research is intended to exhibit that a DRL
model with an acceptable predictive performance can be constructed, compared with a conventional
supervised learning model such as GBM, which strongly depends on the availability of a large dataset.

2. Related Work
      Emrah Budur et al. [13] conducted research on link prediction of criminal networks with the
application of SNA models and metrics based on machine learning techniques. They examined the
machine learning techniques using the GBM supervised learning method to enhance the performance
of hidden link prediction in a large dataset. An experiment was conducted with statistical models
and probability link prediction metrics derived from the sampling of the criminal network dataset to
assess the performance of the supervised link prediction model constructed by the GBM algorithm.
The sample size used in the research consists of approximately 1.5 million nodes and four million
undirected edges, which represent a significantly larger dataset size compared to sample sizes used
in other research papers. The larger sample size used was expected to better represent the real
characteristics of criminal networks. The use of a large size of sample dataset also demonstrated that
the applied under-sampling technique improved the accuracy of the sampling method adopted in
this research, as collaborated by the high performance of the trained link prediction model, indicated
by the computed AUC metric. The AUC metric of a machine learning model indicates the predictive
accuracy of the model and has a value that lies between 0 and 1, where a higher value indicates a better
predictive accuracy.
      Furthermore, the survey of research papers has provided considerable assistance in the feature
selection from the criminal networks dataset and identification of a few models of link prediction
metrics [13] (i.e., Table 1), which were ensembled to improve the training of the GBM link prediction
model. The research conducted by Emrah Budur et al. has contributed to the link prediction model
in the identification of the mathematical machine language models, and the applied link prediction
metrics are relevant and provide supportive evidence to the research methodology and trajectory of
the current research work. The authors also stated that the lack of temporal data and information
on suitable weights provided to the edges of criminal network datasets may have caused some
restrictions in the effectiveness of the SNA and link prediction modelling. The significantly large size
of the criminal network sample dataset used in the research, compared to the other research papers
surveyed [14], was also analysed, and analytical metrics that are more accurate in profiling the real
characteristics of criminal networks were provided.

                                    Table 1. Link prediction metrics [13].

                                 Metrics                            Definition
                           Common neighbour                   Sxy = | φ( x ) ∩ φ(y)|
                                                                       |φ( x )∩φ(y)|
                             Jaccard index                      Sxy = |φ( x)∪φ(y)|
                                                                         |φ( x )∩φ(y)|
                                Hub index                        Sxy =    min(k x, k y )
                       Preferential attachment index              Sxy = k x × k y
                                                                                   1
                           Adamic-Adar index                  Sxy =     ∑        log k z
                                                                     z∈φ( x )∩φ(y)
                                                                          ∞        (t)
                                   Katz                          Sxy = ∑ βt .n xy
                                                                         t =1

     The research methodology, however, did have some limitations, considering that criminal
network analysis is a critical and specialized area in law enforcement. Therefore, because of the
absence of the engagement of experts from the domain of law enforcement and criminal intelligence
analysis, the accuracy of the supervised machine learning technique applied in the link prediction
model constructed from the reconstruction of the corrupted criminal network dataset cannot be
ascertained conclusively.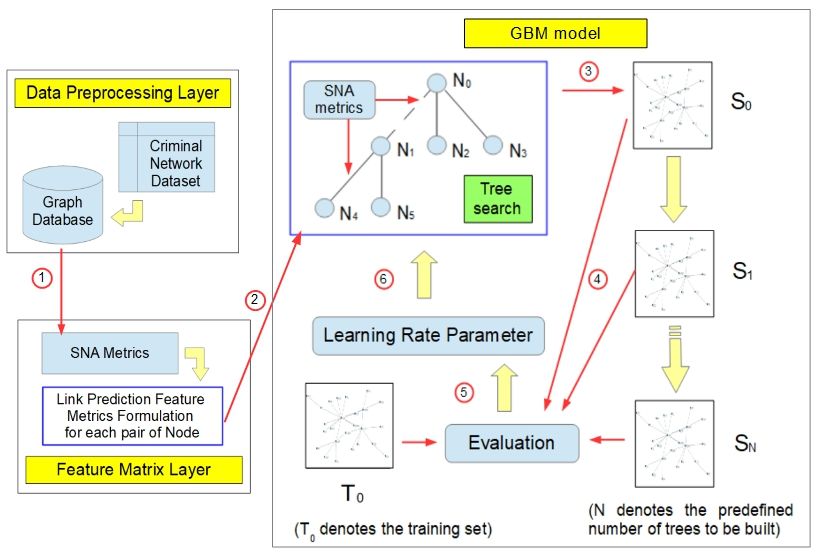
Computers 2019, 8, 8                                                                            4 of 13

      Bellemare et al. [15] investigated the optimisation of DRL algorithms using modern computing
hardware specifications, combining central processing units (CPUs) and graphics processing units
(GPUs), specifically NVIDIA DGX-1. They adapted both policy gradient and Q-learning algorithms
in machine learning models, leveraging on parallel, synchronous, and asynchronous computing
techniques. In their paper, two deep RL algorithm techniques are identified: the policy gradient
method, which is trained on on-policy samples and the Q-value learning method, which involves
off-policy training, an example of which is Deep Q-Networks (Mnih et al., 2015) [16], trained using
a GPU.
      In the work of Bellemare et al., the two methods were combined in an experimentation under
the same framework for scaling. While most of the experimentation conducted was based on
synchronous, asynchronous, and parallel computing techniques using GPU, the initial baseline
performance simulation of the RL algorithm was performed on multiple CPU cores. The experiments
were conducted in the Atari-2600 domain to study the scaling characteristics of highly parallelised
RL with three objectives: to determine the efficiency of the synchronized sampling engine and the
speed that it can achieve; to confirm if the policy gradient and Q-learning algorithms can be adapted
to learn based on parallel simulation without diminishing the learning performance; and to verify that
large-batch training and/or asynchronous methods can improve optimisation without worsening the
sample complexity. Although this paper introduced a unified framework to apply parallel computing
with deep RL to achieve efficient feature learning mainly based on the use of hardware accelerators,
the framework is relevant to a range of algorithms, including policy-gradient and Q-value learning
methods. The experiments conducted demonstrated the ability of leading algorithms to learn a
range of Atari games running in parallel computation without the loss of sample complexity and at
unprecedented clock times.
      Thomas Anthony et al. [17] incorporated imitation learning methods with RL algorithms in the
context of the game of Hex to improve the performance of the RL algorithms. The research was
conducted in reference to the seminal research work on DRL by D. Silver et al. [18] in the development
of a program capable of playing the game of Go, named AlphaGo, in the field of artificial general
intelligence. David Silver et al. made a significant breakthrough in their research on DRL [19], where
the program they developed, AlphaGo Zero, was, through DRL, capable of entirely mastering the
ancient strategic game of Go by self-play. The program managed to attain a superhuman performance
by defeating the top grandmasters of the game from South Korea and China. The AlphaGo program
was successfully built using a trailblazing DRL technique of incorporating a neural network and RL.
AlphaGo initially uses a neural net that is only coded with the basic rules of the game of Go. It then
simulates millions of self-played games against various versions of itself. The knowledge gained
from this self-play is then fed back to the neural network to recalibrate the hyper-parameters. The
recalibrated neural network is then used to improve the efficiency of the Monte Carlo tree search
(MCTS) algorithm by serving as a function approximator. The performance of AlphaGo Zero is thus
increased minimally in each iteration. However, through millions of self-play experience in a day, the
program could simulate the accumulation of decades of human knowledge of Go and performed like
a top-level grandmaster in only three days.
      While knowledge in the fields of both the neural network and RL was already known before the
development of AlphaGo Zero, the key to the leap in the research by David Silver et al. was due to
the novel design of the algorithm and vast improvement in the GPU parallel computing power. The
development of the DRL technique first involves the configuration of a neural network to predict the
best move in a given position and then to fine-tune this neural network with RL through self-play
with different versions of the program. This neural network, which constitutes the policy network of
AlphaGo, was found to be capable of beating the most advanced pure-play MCTS Go programs 85% of
the time. This was a very significant breakthrough compared to the 10% that was previously achieved.
      The research was then continued to enhance the performance by incorporating MCTS into the
policy network. However, the policy network performed too slowly in the evaluation of each move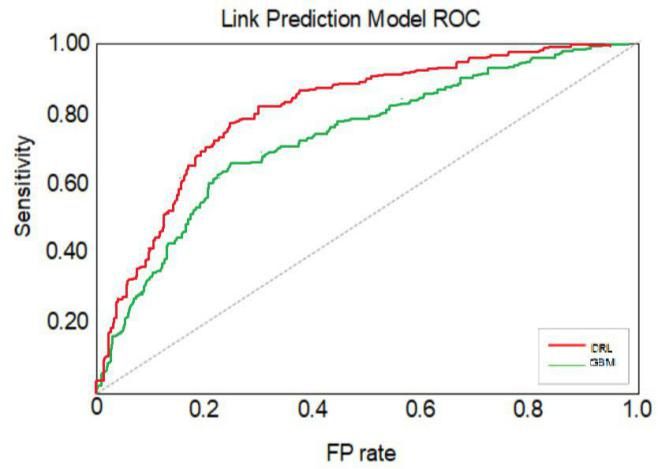
Computers 2019, 8, 8                                                                                 5 of 13

branching from the millions of possible outcomes in the simulation of the game roll outs computed
with MCTS. Therefore, a second value network was trained using the data generated through self-play;
this could evaluate the outcomes faster, i.e., the roll-out network. The value network could evaluate
a position faster based on the estimated probability of the game being won from a specific position.
The combined policy network is only used once to obtain an estimate on an initial move with the
highest winning probability. The faster roll-out policy network is then executed to traverse quickly
using MCTS, through the many possible branches of moves needed to reach a decisive outcome of the
game. This technique improves the selection of the initial move for a search algorithm in a simulation
rather than via random selection and then leverages on the fast MCTS algorithm to complete the
roll-out of each simulation. The key reason MCTS works efficiently for the game of Go is that it
removes the difficult necessity of coding human-defined evaluation algorithms for specific patterns of
positions in the game. As a result, the AlphaGo algorithm comprises a value network that is capable
of predicting moves with the highest winning probability, which is then evaluated via simulation
roll-outs using the MCTS policy network. The combination of the neural networks resulted in a huge
leap in performance compared to the individual performance of each neural network. To optimize
the AlphaGo performance, the program was then deployed using eight GPUs for the neural network
parallel computing. The search threads of MCTS were executed on 48 CPUs.
      Deep learning techniques based on a neural network have always been dependent on big data for
accurate representation learning [20]. Therefore, David Silver et al. have significantly contributed to the
advancement of general artificial intelligence [18], as was demonstrated by the AlphaGo performance.
AlphaGo simulates the cognitive intuition of humans with the DRL algorithm, which automates the
self-learning process by generating data simulated through self-play. Therefore, this DRL technique
has removed the need for complex domain-related patterns to be programmed by humans and opened
up possibilities of application in other domains where the lack of domain data is a limiting factor in
training supervised or unsupervised machine learning.
      Chen et al. explored an ensemble technique by integrating a few RL algorithms into an agent to
enhance the learning efficiency and performance of the DRL technique [21]. However, the experiment
was conducted in a controlled environment that did not utilize a real world dataset, and the DRL
models designed were not for the domain of a social or criminal network.
      Therefore, one of the purposes of the current research paper is to close the gap in the development
of a hidden or missing link prediction model for a criminal network based on SNA metrics by
leveraging on DRL techniques. The DRL techniques that have been investigated by David et al. [18]
and found capable of being trained with relatively smaller datasets with self-simulation are relevant to
the characteristics of a criminal network that has a large number of missing or hidden edges [3].

3. Results
     An experiment was conducted to compare the performance of the link prediction DRL model
(Figure 1) against the GBM model (Figure 2), both of which are based on a binary classification task.
The GBM model was used as the baseline model in comparison with the DRL model for link prediction.
This is because the GBM model was used in the work by Emrah Budur et al. on link prediction [13],
and it is among the most commonly applied tree-search machine learning techniques.
Computers 2019, 8, 8 6 of 13
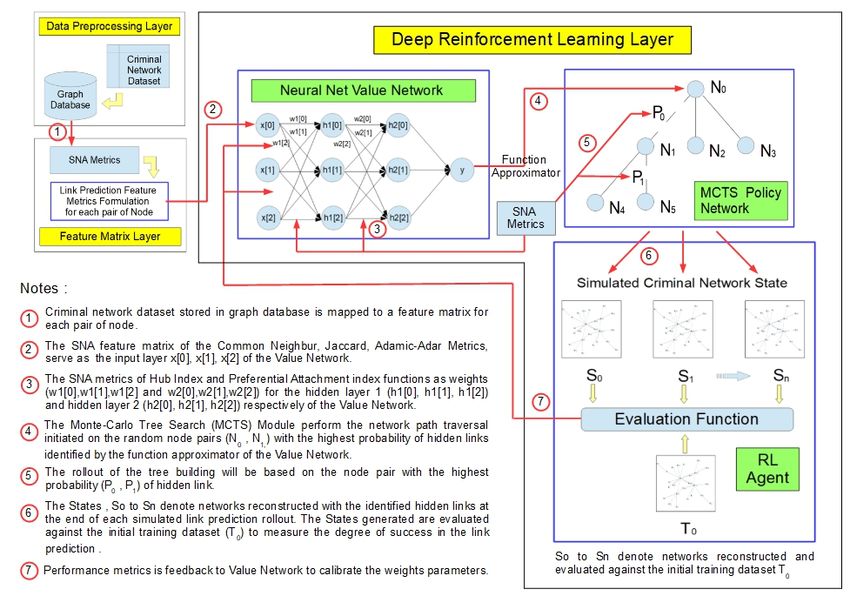
Figure 1.
Figure Proposed criminal
1. Proposed criminal network
network reconstruction
reconstruction model.
model.
Computers 2019, 8, x; doi: FOR PEER REVIEW www.mdpi.com/journal/computers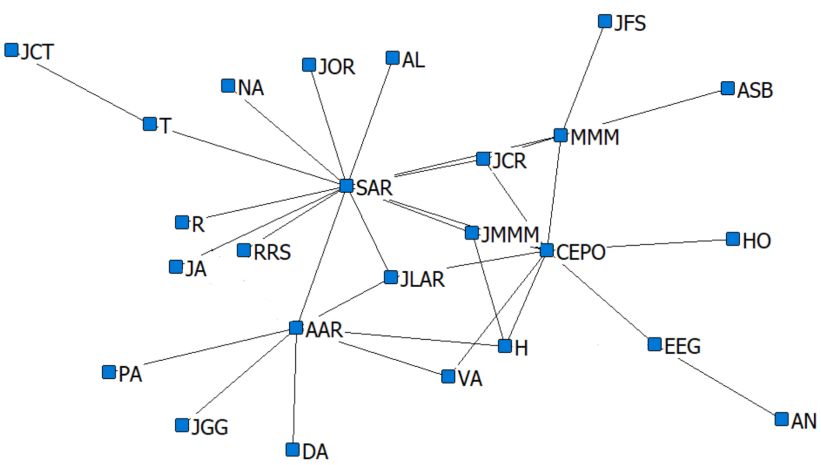
Computers 2019, 8, 8                                                                                 7 of 13
Computers 2019, 8, x FOR PEER REVIEW                                                                1 of 14

                              Figure  2. 2.
                                 Figure  Gradient
                                            Gradientboosting  linkprediction
                                                     boosting link prediction model.
                                                                             model.

  3.1. Experiment Setup
        The criminal network dataset used for this research is based on the UCINET cocaine smuggling
  dataset, which contains a dichotomous adjacency matrix of drug users in Hartford [5]. The cocaine
  smuggling dataset from UCINET [5] contains four criminal network groups, i.e., JUANES, MAMBO,
  JAKE, and ACERO, which have 51, 62, 22, and 11 nodes, respectively. The AUC is used as the
  evaluation metric, as it is indifferent to class imbalance and is a commonly used technique to evaluate
  the classifier performance. The ACERO network group is illustrated in Figure 3. Each criminal group
  dataset is divided into the training and test sets following a ratio of 75:25. The training set was used to
  build both the GBM and DRL link prediction model. The test set was applied in the evaluation of the
  final model in terms of the performance of the binary classification function.
        Some of the nodes in the criminal network (e.g., Figure 3) were then removed to simulate a
  corrupted criminal network dataset with missing links (e.g., Figure 4) for the subsequent testing of the
  trained link prediction models. The corrupted criminal network dataset was then converted into a
  feature matrix and rebuilt through     both3.the
                                      Figure       GBMnetwork
                                                ACERO   and DRL  criminal network reconstruction models.
                                                               graph.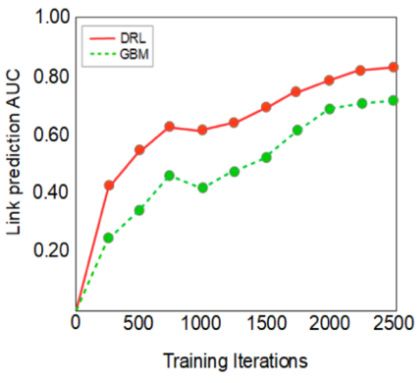
Computers 2019, 8, 8 8 of 13
Figure 2. Gradient boosting link prediction model.
Computers 2019, 8, x FOR PEER REVIEW Figure 3.
Figure 3. ACERO
ACERO network
network graph.
graph. 2 of 14
Figure 4. ACERO
Figure 4. ACERO simulated
simulated corrupted
corruptednetwork
networkgraph.
graph.
The SNA metrics used in the construction
Table 1. Linkofprediction
the feature matrix
metrics are as depicted in Table 1. In Table 1:
[13].
ϕ(i) denotes the nodes within a network that are neighbours of the node i; ki denotes the degree in
relation to the node i; n denotesMetrics Definition
(t)
ij the number of walks of length t between the nodes i and j; and β
represents the discounting factor on walks of a longer length.
Common neighbour S xy = | ϕ ( x) ∩ ϕ ( y ) |
The SNA link prediction metrics for the criminal network were mapped into a feature matrix to
train both the GBM and DRL link prediction models. The mapping process is as follows. First, the
| ϕ ( x) ∩ ϕ ( y ) |
criminal network dataset is structured S xy = into a dictionary of a list comprising
with a Python routine
Jaccard index
| ϕ ( x) ∪ ϕ ( y ) |
nodes and edges. The nodes representing the entities within the network are then tagged with a
sequence code. Following this, the dictionary of the list is moved into a Python NumPy matrix using
| ϕ ( x) ∩ ϕ ( y ) |
Networkx and stored into an OrientDb graph database. The
Hub index = prediction metrics identified in Table 1
S xylink
min(k x , k y features
are then computed for the respective nodes and edges to extract the relevant
) from the criminal
dataset, which are then used in the construction of the link prediction model. The respective features
and values computed forPreferential
each nodeattachment index as depicted
are then tabulated,
S xy = kinx Figure
x k y 5.
The tabulated features and link prediction metrics of the nodes are then converted into the feature
1
matrix, which is used to build the link prediction
Adamic-Adar S xy = 5).
index model (Figure
z∈ϕ ( x ) ∩ϕ ( y ) log k z
3.2. Experiment Results
∞
= β t . n xy
on the corruptedSxy
(t )
Katz
After 500 iterations were performed network, the initial outcome of the
t =1
reconstructed network was as depicted in Figure 6.
The SNA metrics used in the construction of the feature matrix are as depicted in Table 1. In
Table 1: φ(i) denotes the nodes within a network that are neighbours of the node i; ki denotes the
(t )
degree in relation to the node i; nij denotes the number of walks of length t between the nodes i and
j; and β represents the discounting factor on walks of a longer length.
The SNA link prediction metrics for the criminal network were mapped into a feature matrix to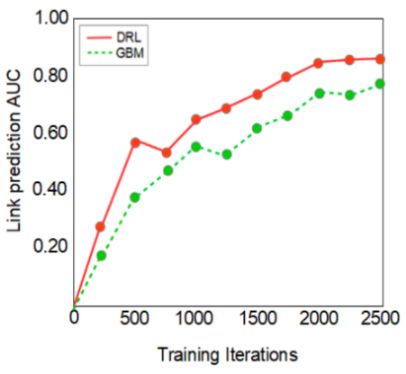
Computers 2019, 8, 8 9 of 13
Computers 2019, 8, x FOR PEER REVIEW 3 of 14
Figure 5. Criminal network feature matrix mapping process [13].
The tabulated features and link prediction metrics of the nodes are then converted into the
feature matrix, which is used to build the link prediction model (Figure 5).
3.2. Experiment Results
After 500 iterations were performed on the corrupted network, the initial outcome of the
reconstructed networkFigure
was as
Figuredepicted
5. Criminal
in
5. Criminal Figure
network
network
6. matrix
feature
feature matrix mapping
mapping process
process[13].
[13].
The tabulated features and link prediction metrics of the nodes are then converted into the
feature matrix, which is used to build the link prediction model (Figure 5).
3.2. Experiment Results
After 500 iterations were performed on the corrupted network, the initial outcome of the
reconstructed network was as depicted in Figure 6.
Figure 6.6.ACERO
Figure ACEROnetwork
networkgraph
graph reconstructed withDRL
reconstructed with DRLlink
linkprediction
prediction model.
model.
The
The edges
edges ofofthe
thenodes
nodesH, H,VA,
VA, and
and JLAR
JLAR (Figure
(Figure6) 6)could
couldbebereconstructed
reconstructed with
withthethe
DRLDRLSNASNA
model developed for criminal network link prediction and
model developed for criminal network link prediction and reconstruction. reconstruction.
However,
However, it itcan
canalso
alsobebeseen
seenthat
thatsome
some edges
edges ofof nodes
nodesJA JAand
andRRS
RRSwere
werenotnotfully reconstructed,
fully reconstructed,
Figure
and further iterations of6.the
ACERO
modelnetwork
weregraph reconstructed
needed with
to further DRL link the
calibrate prediction
valuemodel.
and policy networks.
and further iterations of the model were needed to further calibrate the value and policy networks.
However, this initial testing of the link prediction model for criminal networks indicates that the
However, thisTheinitial
edgestesting of theH,link
of the nodes VA,prediction model6)for
and JLAR (Figure criminal
could networkswith
be reconstructed indicates
the DRLthat
SNAthe DRL
DRL technique can be incorporated to train the model with a relatively small dataset. To evaluate
model
technique candeveloped for criminal
be incorporated to network linkmodel
train the prediction
withand
a reconstruction.
relatively small dataset. To evaluate the
the performance of the
However, link
it can alsoprediction
be seen thatmodel constructed
some edges of nodeswith theRRS
JA and DRLwere
technique
not fullyagainst that of the
reconstructed,
GBM-based model, larger datasets of the JAKE, JUANES, and MAMBO network groups were
and further iterations of the model were needed to further calibrate the value and policy networks. used.
Figure 7 shows the AUC score from the JUANES network (a) dataset of the DRL and
However, this initial testing of the link prediction model for criminal networks indicates that the DRL GBM
link prediction models
technique can in relation to
be incorporated to train
the frequency
the model of training
with iterations.
a relatively The AUC
small dataset. To scores from
evaluate the the
MAMBO network (b) dataset of the link prediction models based on DRL and GBM exhibited a smaller
performance gap, compared to the result of the JAKE network. This could be due to the larger size of
the MAMBO network. The experimental result as reflected in the JAKE network (c) shows that the DRL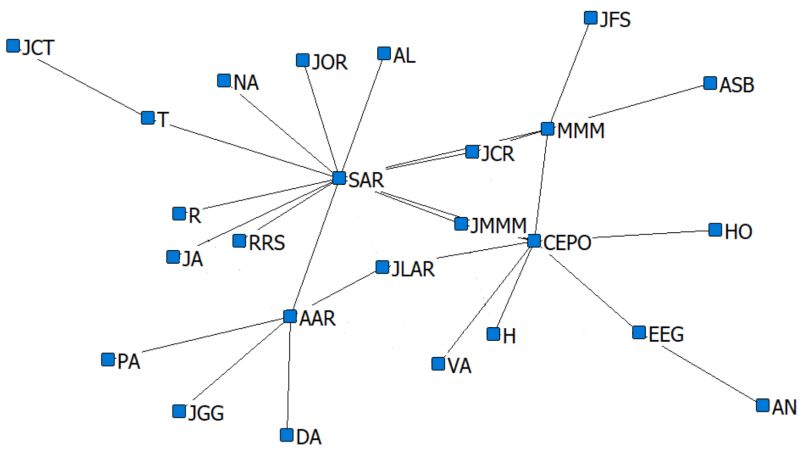
GBM-based model, larger datasets of the JAKE, JUANES, and MAMBO network groups were used.
     Figure 7 shows the AUC score from the JUANES network (a) dataset of the DRL and GBM link
prediction models in relation to the frequency of training iterations. The AUC scores from the
MAMBO network (b) dataset of the link prediction models based on DRL and GBM exhibited a
smaller performance
Computers 2019, 8, 8      gap, compared to the result of the JAKE network. This could be due to the 10   larger
                                                                                                            of 13
size of the MAMBO network. The experimental result as reflected in the JAKE network (c) shows that
the DRL model exhibited a faster gradual increase in link prediction performance and finally
model exhibited
outperformed          a faster
                    the        gradual
                         baseline  GBMincrease
                                         model in linksubsequent
                                                after  prediction performance
                                                                     increases in and
                                                                                    the finally
                                                                                         number outperformed
                                                                                                   of training
iterations. The AUC scores from the three criminal networks in Figure 7 seem to indicateThe
the baseline   GBM      model  after subsequent increases  in the  number   of training  iterations.      AUC
                                                                                                       that  the
scores from the
performance      ofthree  criminal
                     the GBM       networkslearning
                                supervised  in Figuremodel
                                                       7 seemgenerally
                                                               to indicate that thefrom
                                                                         suffered   performance    of the small
                                                                                          the relatively  GBM
supervised learning model generally suffered from the relatively small dataset.
dataset.

                  (a)                                     (b)                                      (c)

     Figure 7. AUC metrics of DRL and GBM link prediction models for (a) JUANES network; (b) MAMBO
     Figure 7. AUC metrics of DRL and GBM link prediction models for (a) JUANES network; (b) MAMBO
     network; (c) JAKE network.
     network; (c) JAKE network.

     Table 2 shows that the DRL link prediction model outperformed the GBM baseline model in the
     Table 2 shows that the DRL link prediction model outperformed the GBM baseline model in the
three criminal network datasets.
three criminal network datasets.
                           Table 2. AUC scores of DRL and GBM link prediction model.
                           Table 2. AUC scores of DRL and GBM link prediction model.
                                  Dataset       GBM      DRL       Iterations
                                  Dataset        GBM              DRL        Iterations
                                   Juanes
                                  Juanes          0.71
                                                 0.71           0.82
                                                                   0.82       2500
                                                                                2500
                                  Mambo
                                   Mambo         0.77
                                                  0.77             0.85
                                                                0.85            2500
                                                                              2500
                                   Jake
                                     Jake        0.70
                                                  0.70             0.76
                                                                0.76            2500
                                                                              2500

      The classification performance results of the number of correct and incorrect link predictions
      The nodes
between    classification  performance
                  of the network    were results  of the number
                                          also measured            of correct
                                                           using the          andmatrix
                                                                      confusion   incorrect
                                                                                         rate,link
                                                                                                andpredictions
                                                                                                     a receiver
between    nodes   of the network   were  also measured    using the  confusion  matrix
operating characteristic (ROC) curve was plotted. The plot of the true positive (TP) raterate,  andagainst
                                                                                                     a receiver
                                                                                                            the
operating   characteristic  (ROC)   curve  was  plotted.  The plot of the true positive (TP)   rate
false positive (FP) rate in the ROC curve (Figure 8) was based on the JUANES network group, which   against the
false
is thepositive (FP) rateamong
       largest dataset    in the ROC   curve
                                 the four    (Figurenetworks.
                                          criminal    8) was based on the JUANES network group, which is
the largest dataset among the four criminal networks.
         Computers 2019, 8, x FOR PEER REVIEW                                                              5 of 14

                                         Figure
                                      Figure    8. ROCcurve
                                             8. ROC    curvefor
                                                             for JUANES
                                                                 JUANESnetwork.
                                                                        network.

         4. Discussion
              The TP rate (also known as sensitivity rate) is the proportion of the actual missing links that are
         predicted as such by the models. The FP rate (1—specificity) represents the proportion of the non-
         existing links that are identified as such by the models. However, the experimental results also seem
         to indicate that the DRL model became less advantageous compared to the GBM model as the data
         size and feature number increased (Figure 7). One possible reason is that supervised learning models
Computers 2019, 8, 8 11 of 13
4. Discussion
The TP rate (also known as sensitivity rate) is the proportion of the actual missing links that
are predicted as such by the models. The FP rate (1—specificity) represents the proportion of the
non-existing links that are identified as such by the models. However, the experimental results also
seem to indicate that the DRL model became less advantageous compared to the GBM model as the
data size and feature number increased (Figure 7). One possible reason is that supervised learning
models such as the GBM predictive performance tend to improve with larger training datasets.
5. Materials and Methods
The deep reinforcement learning technique involves incorporating machine learning techniques
of deep learning (multi-layered neural network) and RL. Therefore, the performance of DRL for link
prediction of criminal networks depends on a few factors and is evaluated based on the formulation of
the SNA metrics (Table 1) and DRL techniques.
The prediction of the probability of the presence or absence of hidden links between nodes within
a criminal network is formulated with a supervised learning technique as a binary classification
problem. The development of the link prediction model for criminal networks in this research involves
mapping a criminal network structure into a matrix of features for each pair of nodes derived from the
metrics of SNA models. The metrics selected to populate the feature matrix consist of the common SNA
metrics from neighbourhood-based, Katz-based, and random walk-based measures [13]. Therefore, for
every pair of nodes, an array of feature metrics is created as a data record. These data records are used
for training purposes in supervised machine learning as a binary classification of positive-negative
pairs of nodes. The pair of nodes where an edge exists is labelled as positive, and the pair where the
edge is non-existent is labelled as negative.
During the training phase, the link prediction algorithm will generate a dataset where each data
record with multiple features represents either a pair of nodes with a link between them or a pair of
nodes without a link between them. The multiple features consist of the SNA link prediction metrics
applicable to the pair of nodes. As a result of the construction of the training model from the data, the
class label is indicative of the existence or absence of a link between the nodes. In the testing phase,
every sample pair of nodes used is converted into a record with multiple features from which binary
classification of the existence of an edge will be predicted by the model.
A deep neural network will be utilized as a function approximator to take the initial corrupted
network structure, S0 , as an input and output a vector of probabilities of edges. These probabilities
of edges are derived based on the SNA metrics for each node, and the probability of hidden links is
estimated from the initial network structure, S0 .
The neural network learns the probabilities of the hidden edges and value estimates based
entirely on RL by self-simulation based on SNA metrics scoring. These values are then used to
guide the network traversal search. The proposed criminal network reconstruction model (Figure 1)
uses a general-purpose MCTS algorithm (Figure 1). Each search consists of a series of simulated
reconstruction of self-scoring edges that traverse a tree from a root leaf. Each simulation proceeds by
selecting, in each network structure, S, a hidden edge of high probability and high value according to
the current neural network.
The search returns a vector representing a probability distribution over edges. The parameters of
the value network are trained based on the dataset generated through self-simulation by RL, which
is initially initialised by random parameters. The MCTS search function is based on SNA metrics
with the highest probability approximated during a tree-search algorithm of the value network. The
network structure simulations are repeated in the algorithm in order to derive an estimate of the value
of states. The tree search will then be expanded further, traversing through the network with a higher
probability of hidden edges. The explored edge with the highest probability is then identified.Computers 2019, 8, 8 12 of 13
In every simulation of the tree search, the probable hidden edges between nodes based on the
tree search policy network will first be generated while the network path is being traversed. Second,
in the roll-out phase, when the simulation reaches the end of the traversal of the network structure
based on the default policy, the result obtained will then be used to adjust the estimates of the value of
each pair of nodes derived during the first phase while the network is being traversed. Every traversal
between nodes during the tree search represents a possible state of the network structure. The root
node of the tree search represents the current state, and each child node represents an instance of the
state from the current state as a result of a single probable hidden edge. The probable hidden edge
identified from state S1 to S2 represents an action taken in order to reach S2 from S1 . The number of
states, N, will be generated through self-simulation until an acceptable AUC score is achieved.
Simulated network structures are constructed by selecting edges based on SNA metrics
scoring. At the end of each simulation run, the reconstructed network structure is compared to
the non-corrupted network structure derived from the original dataset. The hyper-parameters of the
policy network are then adjusted to minimize the error between the predicted and actual missing
edges. During this process, the similarity of the policy values compared to the search probabilities
will be maximized. The parameters are then specifically adjusted by gradient descent based on a
loss function. The loss function is aggregated over the mean-squared error and cross-entropy losses
accordingly. The parameters that have been updated will then be used in the next iteration of the
reconstruction of edges through self-simulation (Figure 1).
The value network (Figure 1) was constructed with two hidden layers of the neural net, utilizing
the preferential attachment index and Hub index to evaluate the probability distribution of the nodes
and edges from which the tree search function commences its search.
The RL policy network (Figure 1) will compute the scoring based on the link prediction metrics of
common neighbours, the Jaccard index, and the Adamic-Adar index to simulate link prediction at each
state of the network. The scores achieved by each state of the network based on the RL policy network
are then applied to train the value network of the model by adjusting the parameters to enhance the
model performance.
The GBM is a supervised machine learning model that utilizes a decision tree algorithm and
improves (boosts) the learning performance by gradually reducing the prediction error from the prior
iteration of the decision tree. The GBM model was constructed for the purpose of criminal networks
link prediction based on SNA metrics (Figure 2) [13]. The performance of the DRL link prediction
model is then evaluated by comparing it against the GBM model.
6. Conclusions
In this research, an experiment was conducted to demonstrate that a criminal network link
prediction model based on the DRL is capable of outperforming the GBM model with a relatively
smaller dataset. This is exhibited by the higher AUC scores of 0.85, 0.82, and 0.76 of the DRL criminal
network link prediction model in comparison with the GBM model for JUANES, MAMBO, and JAKE,
respectively. A DRL value network was used to predict the splitting feature at each node and trained
with RL to search for decision trees with a better performance. While the experiments indicate that
the DRL method is capable of a better predictive performance compared to conventional supervised
learning under the same hyper-parameter setting, further experiments need to be conducted to confirm
if the predictive precision of the supervised learning technique will be better over a larger dataset and
number of training iterations.
Author Contributions: Conceptualization & Investigation, M.L.; Supervision, Review & Editing A.Z.; and NZ.J.;
Funding acquisition, M.S.
Funding: This research received the funding under Taylor’s Flagship Project under project # (TUFR/2017/004/06).
We are thankful to Taylor’s University Malaysia.
Conflicts of Interest: The authors declare no conflict of interest.Computers 2019, 8, 8 13 of 13
References
1. Cheliotis, G. Social Network Analysis. 2014. Available online: https://wiki.nus.edu.sg/download/
attachments/57742900/Social+Networks+-+Social+Capital.pdf (accessed on 19 October 2018).
2. McAndrew, D. The structural analysis of criminal networks. In The Social Psychology of Crime: Groups, Teams,
and Networks; Offender Profiling Series; ACM: Aldershot, UK, 1999; Volume III.
3. Xu, J.; Chen, H. Criminal Network Analysis and Visualization. Commun. ACM 2005, 48, 100–107. [CrossRef]
4. Campana, M.G.; Delmastro, F. Recommender Systems for Online and Mobile Social Networks: A survey.
Online Soc. Netw. Media 2017, 3, 75–97. [CrossRef]
5. Borgatti, S.P.; Everett, M.G.; Freeman, L.C. Ucinet for Windows: Software for Social Network Analysis; Analytic
Technologies: Harvard, MA, USA, 2002; Volume 1.
6. Li, H.; Kumar, N.; Chen, R.; Georgiou, P. A Deep Reinforcement Learning Framework for Identifying Funny
Scenes in Movies. In Proceedings of the 2018 IEEE International Conference on Acoustics, Speech and Signal
Processing (ICASSP), Calgary, AB, Canada, 15–20 April 2018; pp. 3116–3120.
7. Dzmitry, B.; Chorowski, J.; Serdyuk, D.; Brakel, P.; Bengio, Y. End-to-end attention-based large vocabulary
speech recognition. In Proceedings of the 2016 IEEE International Conference on Acoustics, Speech and
Signal Processing (ICASSP), Shanghai, China, 20–25 March 2016.
8. Zeiler, M.D.; Fergus, R. Visualizing and Understanding Convolutional Networks. In Proceedings of the
European Conference on Computer Vision (ECCV), Sweden, UK, 6–12 September 2014; Volume 1.
9. Yao, K.; Zweig, G.; Hwang, M.Y.; Shi, Y.; Yu, D. Recurrent neural networks for language understanding.
Interspeech 2013, 2013, 2524–2528.
10. Li, X.; Du, N.; Li, H.; Li, K.; Gao, J.; Zhang, A. A deep learning approach to link prediction in dynamic
networks. In Proceedings of the 2014 SIAM International Conference on Data Mining, Society for Industrial
and Applied Mathematics, Philadelphia, PA, USA, 22–29 January 2014; pp. 289–297.
11. Williams, R.J. Simple statistical gradient-following algorithms for connectionist reinforcement learning.
Mach. Learn. 1992, 8, 229–256. [CrossRef]
12. James, G.; Witten, D.; Hastie, T.; Tibshirani, R. Statistical learning. In An Introduction to Statistical Learning;
Springer: New York, NY, USA, 2013; pp. 15–57.
13. Budur, E.; Lee, S.; Kong, V.S. Structural Analysis of Criminal Network and Predicting Hidden Links using.
Mach. Learn. 2015.
14. Hasan, M.A.; Zaki, M.J. A Survey of Link Prediction in Social Networks. Soc. Netw. Data Anal. 2011, 1,
243–275.
15. Bellemare, M.G.; Dabney, W.; Munos, R. A Distributional Perspective on Reinforcement Learning.
Mach. Learn. 2017.
16. Mnih, V.; Kavukcuoglu, K.; Silver, D.; Rusu, A.A.; Veness, J.; Bellemare, M.G.; Graves, A.; Riedmiller, M.;
Fidjeland, A.K.; Ostrovski, G.; et al. Human-level control through deep reinforcement learning. Nature 2015,
518, 529–533. [CrossRef] [PubMed]
17. Anthony, T.; Tian, Z.; Barber, D. Thinking fast and slow with deep learning and tree search. Adv. Neural Inf.
Process. Syst. 2017, 5360–5370.
18. Silver, D.; Schrittwieser, J.; Simonyan, K.; Antonoglou, I.; Huang, A.; Guez, A.; Chen, Y. Mastering the game
of Go without human knowledge. Nature 2017, 550, 354. [CrossRef] [PubMed]
19. Silver, D.; Huang, A.; Maddison, C.J.; Guez, A.; Sifre, L.; van den Driessche, G.; Schrittwieser, J.;
Antonoglou, L.; Panneershelvam, V.; Lanctot, M.; et al. Mastering the game of Go with deep neural
networks and tree search. Nature 2016, 529, 484–489. [CrossRef] [PubMed]
20. Duan, Y.; Chen, X.; Houthooft, R.; Schulman, J.; Abbeel, P. Benchmarking Deep Reinforcement Learning for
Continuous Control. ICML 2016, 1.
21. Chen, X.-L.; Cao, L.; Li, C.X.; Xu, Z.X.; Lai, J. Ensemble Network Architecture for Deep Reinforcement
Learning. Math. Probl. Eng. 2018. [CrossRef]
© 2019 by the authors. Licensee MDPI, Basel, Switzerland. This article is an open access
article distributed under the terms and conditions of the Creative Commons Attribution
(CC BY) license (http://creativecommons.org/licenses/by/4.0/).You can also read


