Deliverable D5 within 19ENG08 - Physikalisch-Technische ...
←
→
Page content transcription
If your browser does not render page correctly, please read the page content below
Deliverable D5 within 19ENG08

 - Report on the technical requirements for the electrical power
 measurements and definition of the measurands for nacelle test
 benches -

Authors: Alexander Dubowik (PTB), 2021
 Enrico Mohns (PTB)
 Christian Mester (METAS)
 Marcel Heller (FhG)
 Maximilian Zweiffel (RWTH)
 Juan Manuel Quintanilla Crespo (CENER)
 Jari Hällström (VTT)
 Paula Weidinger (PTB)
19ENG08 – WindEFCY: Report Deliverable D5

This report has been produced within the EMPIR project entitled Traceable Mechanical and Electrical
Power Measurement for Efficiency Determination of Wind Turbines or 19ENG08 WindEFCY. More
information about this collaborative research project can be found on the project’s website
https://www.ptb.de/empir2020/windefcy/home/. This report lists the technical requirements for the
electrical power measurements and the definition of the measurands for nacelle test benches.

 Disclaimer
Any mention of commercial products within this report is for information only; it does not imply
recommendation or endorsement by the partners in this project.

The views expressed in this report are those of the authors and of the EMPIR 19ENG08 WindEFCY
project team.

 Acknowledgement of funding
The production of this project and, therefore, this report was funded by the European Metrology
Programme for Innovation and Research (EMPIR). The EMPIR initiative is co-funded by the European
Union’s Horizon 2020 research and innovation programme and the EMPIR Participating States.

 Authorship
The preparation of this guide was led by Alexander Dubowik of the Physikalisch-Technische
Bundesanstalt (PTB), Braunschweig (Germany) with extensive input from all members of the EMPIR
19ENG08 project team. The discussion and input of all the partners in the project and their colleagues
are greatly appreciated.

 Suggestion for the quotation of the references
A Dubowik et al, 2021. Deliverable D5 within 19ENG08: Report on the technical requirements for the
electrical power measurements and definition of the measurands for nacelle test benches. DOI:
10.5281/zenodo.4726089

This document and all parts contained therein are protected by copyright and are subject to the Creative
Commons user license CC by 4.0 (https://creativecommons.org/licenses/by/4.0/).

 Project logo
All copyright and related or neighbouring rights to this logo are waived using the CC0 Public Domain
Dedication (https://creativecommons.org/publicdomain/zero/1.0/).

DOI: 10.5281/zenodo.4726089

 1 DOI: 10.5281/zenodo.4726089
19ENG08 – WindEFCY: Report Deliverable D5

Content
1 Introduction 3
2 State of the art 4
 2.1 Energy conversion in wind turbines 4
 2.2 Overview of electrical systems in wind turbines 4
 2.2.1 Synchronous generators operating on variable-speed 5
 2.2.2 Squirrel cage induction generators operating on variable-speed 5
 2.2.3 Wound rotor induction generators operating on variable-speed 6
 2.3 Concept of nacelle test benches 7
3 Electrical requirements for nacelle test benches 9
 3.1 FhG IWES 9
 3.1.1 Electrical power supply equipment in the NTB 9
 3.1.2 Environmental conditions at FhG IWES laboratory 11
 3.2 RWTH Aachen 12
 3.2.1 Electrical power supply equipment in the NTB 13
 3.2.2 Environmental conditions at RWTH Aachen laboratory 14
 3.3 CENER 15
 3.3.1 Medium-speed generator test bench 16
 3.3.2 High-speed generator test bench 17
 3.3.3 Electrical power supply equipment in the test benches 17
 3.3.4 Environmental conditions at CENER laboratory 19
 3.4 Technical requirements for electrical power measurements in NTBs 19
 3.4.1 Definition of the measurands for NTBs 19
 3.4.2 Electrical characteristics of current and voltage sensors 20
 3.4.3 Electrical characteristics of the power analyser 20
 3.4.4 Torque and rotational speed sensor signal 21
 3.4.5 Environmental conditions 21
4 Conclusion and future work 22
I Bibliography 23
II Acronyms 24
III Acknowledgements 25

 DOI: 10.5281/zenodo.4726089 2
19ENG08 – WindEFCY: Report Deliverable D5

1 Introduction
The EU must reduce greenhouse gas emission by at least 40 % by 2030 compared to 1990 to tackle
climate change and to reach the goal of the Paris Agreement [1]. This can be achieved by an energy
transition towards renewable energy sources. Wind energy has much potential and, together with hydro
power, the highest share of the total electricity generated from renewable sources. As the renewable
energy sector is still competing with fossil energy sources in terms of energy production costs, the
efficiency of wind turbine drive trains is to be ameliorated and reliably determined. Moreover, to ensure
resilience, security and a high reliability of the power production, extensive testing of wind turbine drive
trains and their components on test benches is of great importance. Many tests and validation methods
to assure the quality of wind turbines are already standardised [2]. However, all these standardised tests
are to be performed in the field. A standard on traceable efficiency determination of wind turbines on
test benches based on traceable mechanical and electrical power measurement does not yet exist.

Prior to developing an advanced framework for reliable efficiency determination of wind turbine drive
trains on test benches, the electrical power measurement in test benches is to be traced to national
standards. To consider all influences in such a special environment, the best way of calibrating the
electrical power measurement is on-site via a transfer standard. So far, there is neither such a transfer
standard nor a good practice guide about how to perform such a calibration. Before a reference power
measurement system (RPMS) can be commissioned, the requirements on typical electrical power
measurement systems (EPMSs) used in test benches and, consequently, the requirements on an RPMS
must be identified.

This report was generated in Work Package 3 (WP3) of the EMPIR project 19ENG08 “Traceable
mechanical and electrical power measurement for efficiency determination of wind turbines” short
WindEFCY. Firstly, an insight into energy conversion in wind turbines followed by an overview of the
manifold electrical systems in wind turbines and the general set-up of test benches for wind turbines is
given. The aim of this report is to create a general overview of energy conversion in wind turbines and,
based on this complexity, to identify the requirements on an RPMS. Secondly, the technical
specifications of test benches are gathered from stakeholders, such as test bench operators, via a
survey. To plan the installation of the RPMS on-site, practical aspects such as available space, expected
signal shapes, bandwidth as defined by switching frequency of the frequency converter, accessibility of
the individual parts, and environmental conditions are listed in the following. Based on that, the
measurands, such as active power as well as the required uncertainty limits of these measurands, are
defined.

 3 DOI: 10.5281/zenodo.4726089
19ENG08 – WindEFCY: Report Deliverable D5

2 State of the art
Wind turbines harness kinetic wind energy to generate mechanical power and, hence, clean and
renewable electrical energy. Today, commonly used wind turbines have three-bladed horizontal rotors
installed upwind. To optimise power generation under variable speed, modern wind turbines are stall-
or pitch-regulated. A wind turbine consists of three main parts: the rotor, the tower, and the nacelle. The
nacelle connects the rotor to the tower and is housing the drive train, the main bearing, depending on
the wind turbine type the gearbox, the generator, the converter, the transformer, and the entire control
and supervisory system. This section is giving an insight into energy conversion in wind turbines, the
complexity of electrical systems in wind turbines, and consequently the complexity of nacelle test
benches.

2.1 Energy conversion in wind turbines
In a wind turbine (Figure 1), the rotor converts a maximum proportion of the fluctuating wind energy into
uniform torsion that propels the drive train and, eventually, the generator to produce electrical energy.
[3]

There are two main types of wind turbines on the market: direct-drive wind turbines and wind turbines
with gearboxes. In direct-drive wind turbines the rotor of the synchronous generator is directly powered
by the wind turbine rotor, while in medium- or fast-speed wind turbines the rotor speed on the low-speed
shaft (LSS) from typically up to 25 rpm is increased by a gearbox to up to 1600 rpm on the high-speed
shaft (HSS). The high-speed values are more favourable to drive an induction generator. The HSS is
directly coupled with the generator’s rotor. To generate the required electricity and maintain its
uniformity, an exciter controlled by the turbine controller based on the predominant wind speed is
needed. The current of the generator power is variable, as are voltage and frequency. Because of the
very noisy quality of the generator power, it is fed into a power converter. The power converter first
rectifies the generator voltage to DC and, afterwards, it converts this DC into a stabilised AC output
(trafo power) by a line converter. The sinusoidal trafo power has a frequency of either 50 Hz or 60 Hz
depending on the country where the electricity is generated and is directly fed into the transmission grid
via a transformer. [4]

 Mechanical Power LSS Mechanical Power HSS

 Rotor Nacelle

 Power Converter Trafo

 ~ =
 = ~
 Gearbox Generator Grid

 Generator Power Intermediate Circuit Trafo Power Point of common
 Current: variable Current: DC Current: variable Coupling
 Voltage: variable (< 690 V) Quality: ? Voltage: 690 V or 400 V Current: variable
 Frequency: variable Frequency: 50 Hz or 60 Hz Voltage: 10 000 V/20 000 V
 Quality: very noisy Quality: sinusoidal Frequency: 50 Hz or 60 Hz
 6 lines with 3 phases each 18 lines Quality: sinusoidal
 (~500 A per line) 3 lines

Figure 1: Schematic overview of a wind turbine. Based on [5].

2.2 Overview of electrical systems in wind turbines
Wind turbines are demanded to produce grid-compatible electric current. This criterion can be met by
several combinations of generators and transformers. If the generator is used with power electronic
converters, the wind turbine will be able to operate at variable-speed yielding an increased energy
 DOI: 10.5281/zenodo.4726089 4
19ENG08 – WindEFCY: Report Deliverable D5

capture. In variable-speed mode, wind turbines operate on variable wind speeds starting at a certain
cut-in speed, where the generator produces enough energy to power the wind turbine’s controller, up to
a cut-out speed, where the entire system is shut down to protect itself from damage due to too high wind
loads. However, operation in variable-speed mode makes the generation of AC power at a constant
frequency difficult. A constant frequency of power generated in variable-speed operation can be
achieved either mechanically or electrically. Several generator types are feasible of power generation
by operating on variable-speed: synchronous generators, induction generators (squirrel cage), and
wound rotor induction generators (WRIGs). As DC producing generators are expensive, heavy, and
feature several other disadvantages, current wind turbines are equipped with three-phase AC
generators. Different combinations of generators and power electronics, such as current distribution, the
connection to the grid, and monitoring and control, are listed in the following. [3] and [6]

2.2.1 Synchronous generators operating on variable-speed
For all synchronous generators, with separately excited fields as well as with fields provided by
permanent magnets, the number of poles and the generator speed define the output frequency. When
operating on variable-speed, the generator output is fed into a power converter to be rectified to DC and
then converted back to good quality AC (Figure 2). In case a multipole synchronous generator is used,
the rotor and generator can be connected directly without any gearbox. This is called a direct-drive
generator and, consequently, a direct-drive wind turbine. [6] As aforementioned, these direct-drive
generators are heavy and large and feature several more drawbacks. In the industry, synchronous
generators in connection with a gearbox are used by several wind turbine manufacturers in the onshore
and offshore sector. Direct-drive generators are used by Siemens Gamesa Renewable Energy (SGRE),
GE Renewable Energy, Shanghai Electrics, Goldwind and other manufacturers.

 ~ =
 ~
 = ~
 Gearbox Generator Power Converter Grid

 Rotor

Figure 2: Wind turbine with synchronous generator working on variable-speed. Components listed from
left to right: rotor, gearbox (not available in direct-drive systems), synchronous generator, rectifier (AC /
DC), DC link, inverter (DC / AC), and grid [6]. Own illustration according to [6] p. 247.

2.2.2 Squirrel cage induction generators operating on variable-speed
To deploy a squirrel cage induction generator (SQIG) in wind turbines, a reactive power source is
needed. This can be provided by a power electronic converter. Reducing the fatigue damage to most
parts of a wind turbine by operating it on variable-speed is the only benefit of this concept as the required
power converters are costly and bring along losses that compensate the extra electricity gain of variable-
speed operation. In Figure 3, the pulse-width modulation power converter on the left (PWM1) supplies
the reactive power for the generator and controls the generator speed. It also accepts the real power
from the generator and converts it to DC. This DC power is again converted by the grid side PWM power
converter (PWM 2) to suitable AC power.

 5 DOI: 10.5281/zenodo.4726089
19ENG08 – WindEFCY: Report Deliverable D5

 PWM PWM
 1 2

 Gearbox SQIG Power Converter Grid

 Rotor

Figure 3: Wind turbine with SQIG working on variable speed. Components listed from left to right: rotor,
gearbox, induction generator, two PWM power converters with DC link, and grid. Own illustration according
to [6] p. 248.

2.2.3 Wound rotor induction generators operating on variable-speed
WRIGs are like SQIGs, they can also be operated on variable-speed whereas the required power
converters are smaller in capacity which makes them smaller in dimension and less cost-intensive. One
main difference between WRIGs and SQIGs is the rotor which has copper wire windings in WRIGs
instead of metal bars as in SQIGs.

WRIGs can be operated in high slip operation (Figure 4), slip power recovery (Figure 5), and true
variable-speed operation (Figure 6). In the following, the main features, and advantages and
disadvantages of all three operation modes are mentioned. More and detailed information can be found
in [6], [3], and [7].

High slip operation
Because of the accessibility of the rotor windings and the rotor circuit in WRIGs, the winding could be
short circuited (act like SQIG) and resistance could be changed respectively. In Figure 4, WRIG’s outer
circle approaches the stator, while the inner circle is connected with the rotor. With the external, variable
resistor, the rotor circuit resistance can be increased. As a consequence, the operating speed range
increases as well. In case the slip power (rotor power) cannot be recovered, greater losses occur in a
high-resistance rotor. The main advantage of this set-up is the ditching of excess power, e.g. evoked by
wind gusts, that would otherwise overload the generator.

 WRIG Grid

 Gearbox

 Rotor

Figure 4: Wind turbine with WRIG and external rotor resistance operating on variable-speed. Components
from left to right: rotor, gearbox, WRIG, and grid. Own illustration according to [6] p. 249.

Slip power recovery
In high-slip operation mode, the rotor power (slip power) is lost. One way on how to recover the slip
power is introduced in the following. The frequency of the AC power coming off the rotor, which is the
slip frequency times line frequency, can neither be used directly by AC devices nor directly fed into the
grid. To rectify this, the slip power can be rectified to DC and, afterwards, inverted to grid frequency AC
power by a set-up as shown in Figure 6. Here, the power flows only out of the rotor and its effective
resistance is changed. [6]

 DOI: 10.5281/zenodo.4726089 6
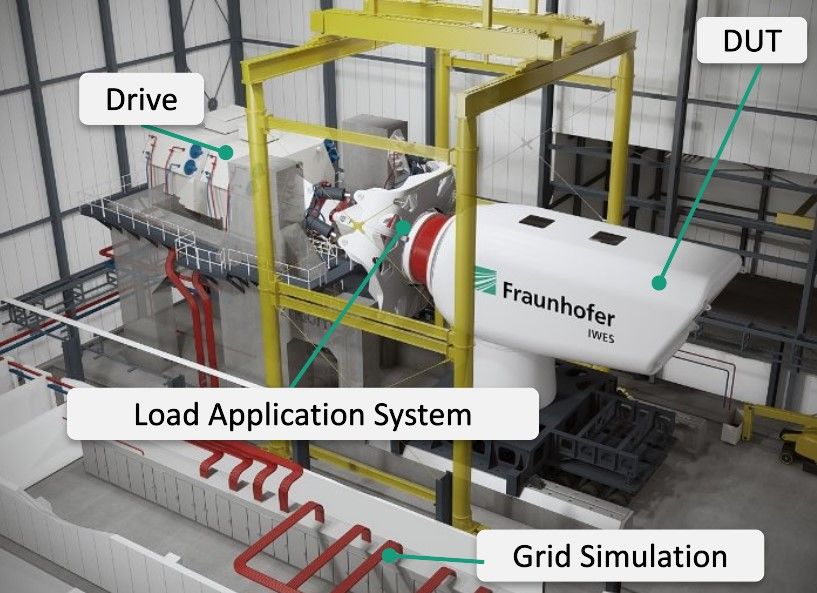
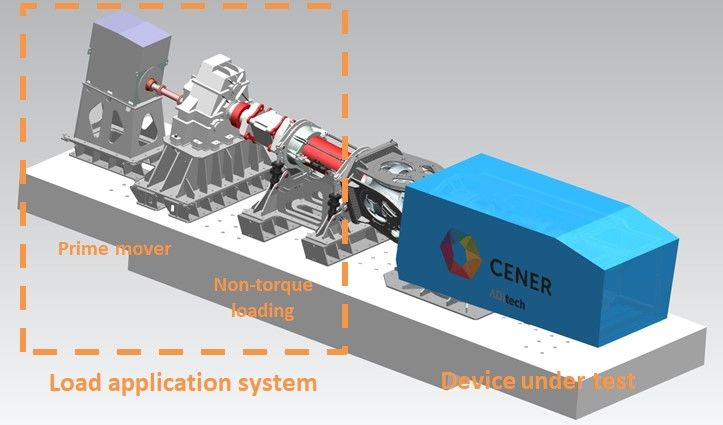
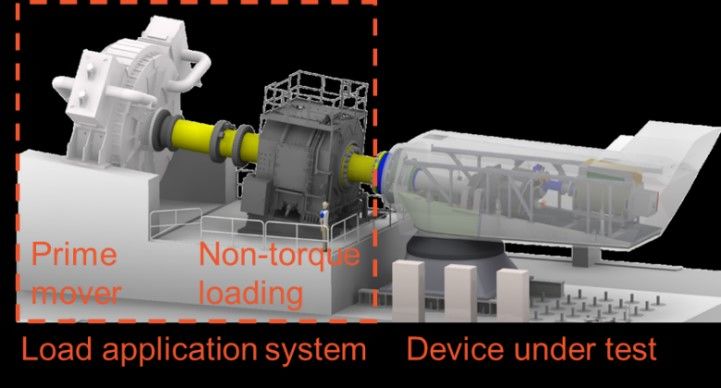
19ENG08 – WindEFCY: Report Deliverable D5

 WRIG Grid

 Gearbox =
 ~
 = ~
 Rotor Power Converter

Figure 5: Wind turbine with WRIG and slip power recovery working on variable-speed. Components listed
from left to right: rotor, gearbox, WRIG, rectifier (AC / DC), DC link, inverter (DC / AC), and grid. Own
illustration according to [6] p. 251.

True variable-speed operation
Moreover, power can be fed into the rotor to enable sub-synchronous speeds. This operation mode is
called true variable-speed and the components are depicted in Figure 6. For this set-up two power PWM
converters with a DC link are needed. The rotor-side converter can interact directly with the rotor’s AC
to feed power into it or convert power coming out of it. In the super-synchronous mode, PWM 1 operates
as rectifier and PWM 2 as inverter. In the sub-synchronous mode, it is the other way around. As power
is transferred out of the rotor and the stator as well as into both, this entire system is also called doubly
fed induction generator (DFIG) and is the most common generator / converter combination in modern
wind turbines. DFIGs with PWM converters allow for many control options. [6]

 WRIG Grid

 Gearbox
 PWM PWM
 1 2

 Rotor Power Converter

Figure 6: Wind turbine with doubly fed WRIG working on variable-speed. Components listed from left to
right: rotor, gearbox, doubly fed WRIG, two PWM power converters with DC link, and grid. Own illustration
according to [6] p. 252.

2.3 Concept of nacelle test benches
As size and type of nacelles and their components vary a lot, so do test benches. In simple end of line
(EoL) tests, two nacelles are connected and operated back-to-back. To this end, the driving nacelle is
in speed-controlled mode and simple speed loading tests can be performed. For more detailed and
realistic tests, so-called nacelle system test benches (NTBs) conducting Hardware-in-the-Loop (HiL)
tests are used [8]. These NTBs (Figure 7) comprise a load application system (LAS), the device under
test (DUT), and electrical power supply equipment. The LAS replaces the rotor of a wind turbine and
consists of a motor and a non-torque loading (NTL). During HiL tests of entire nacelles wind load events,
such as gusts and wind shadow evoked by the tower, can be simulated with the help of external forces
and bending moments which are generated by the NTL. The electrical power supply equipment can
consist of a converter cabinet, a trafo, and an artificial grid. The converter cabinet houses a power
converter and an AC-filter. The electrical power supply equipment is used in case the DUT does not
bring along an inverter and the components behind it. Like real wind turbines, the inclination angle varies
between 4° and 6°. In [9], NTBs around the world with nominal power ranging from 1 MW at DTU
Danmarks Tekniske Universitet up to 25 MW at LORC Lindø Offshore Renewables Center are listed
[10].
 7 DOI: 10.5281/zenodo.4726089
19ENG08 – WindEFCY: Report Deliverable D5

 Line Filter
 Test-Bench Nacelle / DUT Converter Cabinet Power Generation

 Power Converter AC-Filter Trafo

 ~ = ~~
 Motor NTL Gearbox Generator
 = ~ ~ Grid

 LAS

Figure 7: An NTB consists of a motor and an NTL (left) to drive the DUT and a converter cabinet and a line
filter (right) to rectify and transform the electricity for the artificial grid. Based on [5].

 DOI: 10.5281/zenodo.4726089 8

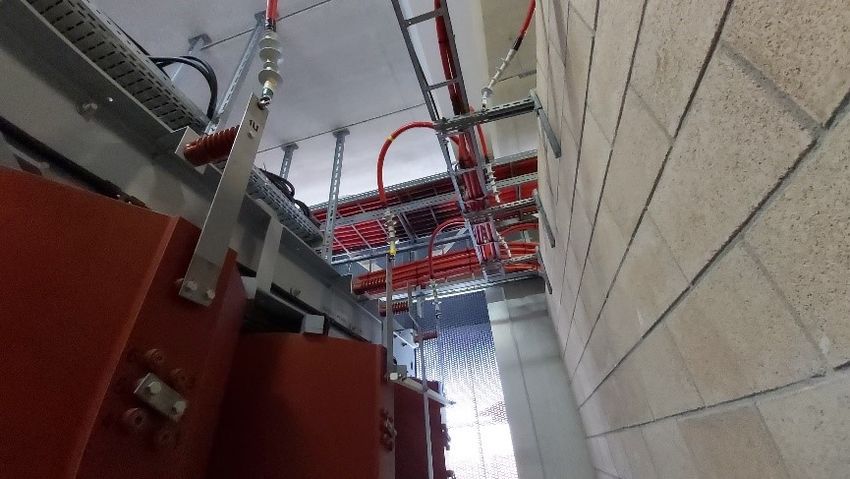
19ENG08 – WindEFCY: Report Deliverable D5

3 Electrical requirements for nacelle test benches
The currents and voltages depend on the NTB. Each NTB has different measuring points where different
current and voltage levels occur. Below, some details of the NTBs at FhG IWES, RWTH Aachen, and
CENER are introduced. Moreover, some information about the medium- and the high-speed generator
test bench at CENER can be found.

3.1 FhG IWES
The dynamic nacelle testing laboratory (DyNaLab) located at Fraunhofer IWES (FhG, institute for wind
energy systems) is an NTB for complete nacelle testing. DyNaLab (Figure 8) provides a realistic testing
environment consisting of mechanical tests and a grid emulator for multi-megawatt nacelles. The
artificial network of 44 MVA installed converter power allows for nacelle testing up to 10 MW. Using the
HiL method and the NTL, typical grid faults and other expected loadings can be simulated. [11] The
number of phases to be measured amounts to three. The maximum voltage level in the NTB is 36 000 V,
while the maximum current level is below 700 A.

In the entire NTB, a timewise synchronisation of all measuring devices is realisable via GPS timestamps,
precision time protocol (PTP), network time protocol (NTP), and inter range instrumentation group
timecode B (IRIG-B).

 Figure 8: NTB DyNaLab at FhG IWES in Bremerhaven, Germany. Modified based on [12].

3.1.1 Electrical power supply equipment in the NTB
A schematic overview of the DyNaLab is given in Figure 9. Besides the coupled motors (left) to drive
the DUT (specimen), the electrical power supply equipment (right) is shown. At the primary side of the
transformer (between transformer and junction box, two transformers being connected in parallel), three
phases with a maximum voltage level of 20 kV, a maximum current level of less than 126 A, and a
bandwidth of up to 20 kHz are to be measured. The harmonic components need to be determined during
test measurements at the beginning of the measurement campaign. At the secondary side of the
transformer (between specimen and transformer), two times three phases with a maximum voltage level
of 630 V and a maximum current level below 4 000 A are to be measured.

 9 DOI: 10.5281/zenodo.4726089
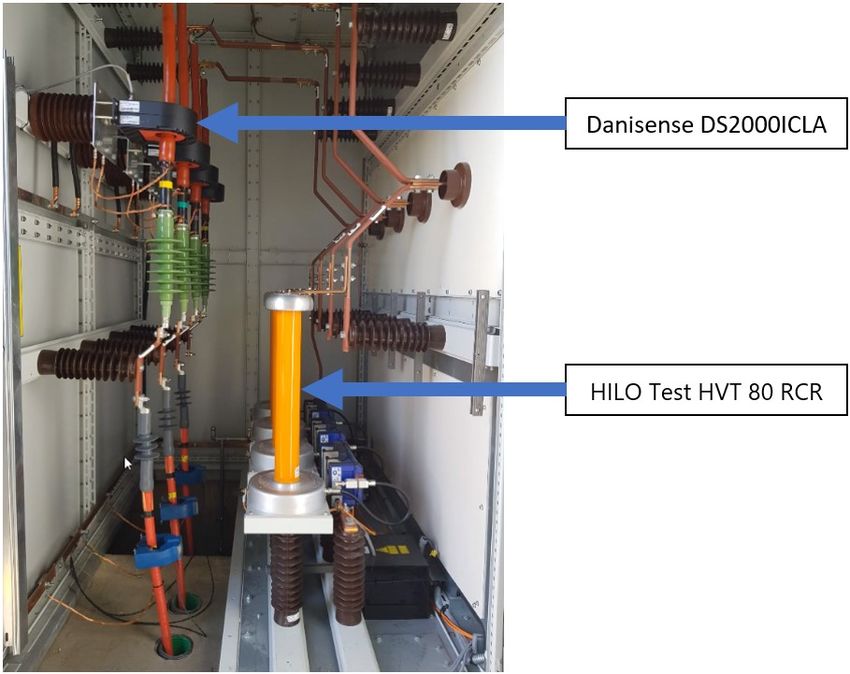
19ENG08 – WindEFCY: Report Deliverable D5

 Trafo-Container
 Mechanical Power LSS
 Client

 M M Specimen
 Grid

 Secondary side Primary side Junction Box
 Current: < 4 000 A Current: < 126 A Current: Danisense DS2000ICLA
 IPN= 2 000 A ISN= 1,33 A
 Voltage: 630 V Voltage: 20 000 V
 KN = 1 : 1 500
 Phases: 2x3 Phases: 3
 Voltage: HILO Test HVT 80 RCR
 VPN= 60 000 V VSN= 12 V
 KN = 5 000 : 1 1 %

Figure 9: Schematic overview of the DyNaLab, FhG IWES.

The EPMS is installed in the junction box (Figure 10). The current sensors (Danisense DS2000ICLA)
are located on the left and the voltage sensors (HILO Test HVT 80 RCR) on the right.

Figure 10: Inside of the junction box, medium voltage (FhG IWES).

 • Current measurement based on the Hall effect (Danisense DS2000ICLA, Figure 10)
 ▪ IPN Primary nominal current rms 2000 A
 ▪ ISN Secondary nominal current rms 1.33 A
 ▪ KN Conversion ratio 1 : 1500
 ▪ BW Bandwidth (-3dB, small signal 10 App) 300 kHz

 DOI: 10.5281/zenodo.4726089 10
19ENG08 – WindEFCY: Report Deliverable D5
Table 1: Accuracy specification of the current measurement.

 The accuracy specification is based on: sinusoidal current, ambient temperature +23±3 °C,
 calibration interval of one year, primary conductor in the middle of the transducer
 Frequency Accuracy specification for amplitude Accuracy specification for
 in % of nominal input current rms phase in °
 DC … 2 kHz ± 0.01 % ± 0.04 °
 2 kHz … 10 kHz ± 1.5 % ± 0.5 °
 10 kHz … 100 kHz ±3% ±3°

 • Voltage measurement (HILO Test HVT 80 RCR, Figure 10)
 ▪ VPN Primary nominal current rms 60 kV (AC, 50 Hz)
 ▪ VSN Secondary nominal current rms 12 V
 ▪ KN Conversion ratio 5000 : 1 ± 1 %
 ▪ BW Bandwidth, appr. 10 MHz
 • And HBK measuring card GN401 and GN610B

Available space for reference measuring devices for the calibration of installed measuring devices and
measuring sensors (EPMS):

 • Hall A around the machine carrier on a scaffold
 • Secondary side inside the container (LV) Rogowski coils for current measurements
 • Junction box medium-voltage (MV) in the right-hand switching field good installation option for
 U and I sensors; the data acquisition (DAQ) system can be placed in the low-voltage (LV) field

3.1.2 Environmental conditions at FhG IWES laboratory
At the DyNaLab of FhG IWES, the ambient conditions within the laboratory are monitored centrally at a
wind-protected place in the laboratory, which is a large-sized hall (Figure 8). The laboratory is neither
air-conditioned nor humidity controlled, only an exhaust air system is available. In general, the
temperature can vary between 15 °C and 35 °C, normally the temperature is between 15 °C and 18 °C,
but in summer times it can get as high as 23 °C to 25 °C due to high temperature outside. In winter
times, a heating system can raise the temperature inside the hall to about 16 °C. All heat-generating
aggregates of the test bench itself and of DUTs are fluid-cooled if not requested differently. Air cooled
systems can be integrated individually if needed for a sufficient DUT cooling. The measurement data in
Figure 11 shows temperature and humidity data of the DyNaLab gathered on 22/05/2019. At an outside
temperature of about 12 °C and a relative humidity of 83 %, the temperature inside was stable to 3 K
between 20.6 °C and 23.73 °C and the relative humidity inside was stable to 9 % between 45.06 % rH
and 36.06 % rH.

 11 DOI: 10.5281/zenodo.4726089
19ENG08 – WindEFCY: Report Deliverable D5

Figure 11: Environmental data temperature and humidity recorded at FhG IWES on the ground of the
DyNaLab hall next to the DUT on 22/05/2019. On that day, the outside temperature was 12 °C and the
humidity fell from 83 % rH at 1016 hPa down to 68 % rH at 1018 hPa.

3.2 RWTH Aachen
The Center for Wind Power Drives (CWD) at RWTH Aachen University owns a 4 MW NTB to examine
nacelles of onshore wind turbines and their components, such as gearboxes, main bearings, and entire
drive trains. The NTB uses a permanent-magnet motor to drive the DUT directly. As it is a system NTB,
HiL grid and wind load tests can be performed whereas wind loads are simulated by an NTL (Figure
12). For research purposes, RWTH has a research nacelle on hand. This nacelle has a rated power of
Pnom = 2.75 MW and is owned by the Forschungsvereinigung Antriebstechnik e. V (FVA). It is generically
neutralised to be able to investigate every detail of the nacelle deeply and to publish all the results. [13]
and [14]

 DOI: 10.5281/zenodo.4726089 12
19ENG08 – WindEFCY: Report Deliverable D5

Figure 12: NTB at CWD of RWTH University in Aachen, Germany. Modified based on [15].

3.2.1 Electrical power supply equipment in the NTB
The typical measuring points for mechanical and electrical power are shown in Figure 13 and Figure 14.
Moreover, Figure 13 and Figure 14 list the prevailing current, voltage, frequency, and quality of the
signals between all electrical components in the FVA nacelle.

The DAQ system consists of amplifiers from the HBK QuantumX Modules Series. Used QuantumX
Module amplifiers are MX410B, MX840B, MX1601B, and MX1615B.

All measuring devices are synchronised in a timewise manner by PTP.

Figure 13: Research set-up at CWD of RWTH Aachen University. 4 MW NTB housing the 2.75 MW research
nacelle of FVA.

 13 DOI: 10.5281/zenodo.4726089
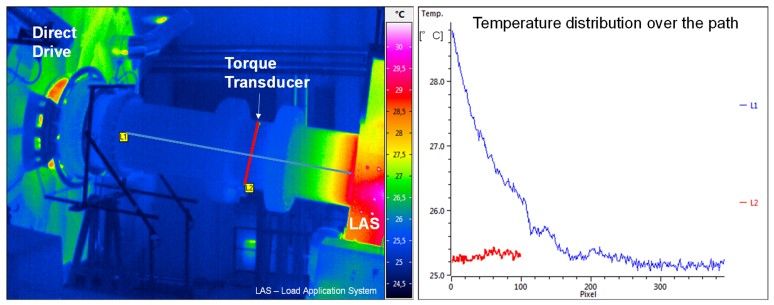
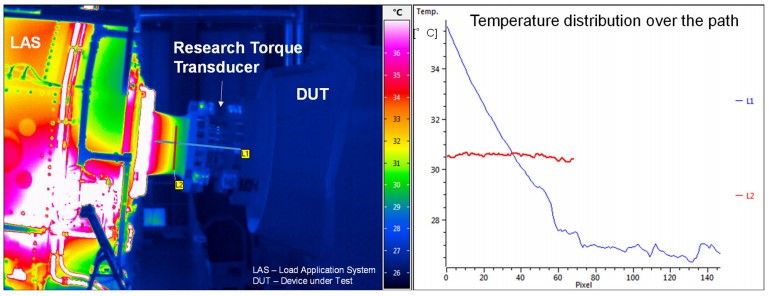
19ENG08 – WindEFCY: Report Deliverable D5

Figure 14: Research set-up at CWD of RWTH Aachen University. 4 MW NTB housing the 2.75 MW research
nacelle with a DFIG.

3.2.2 Environmental conditions at RWTH Aachen laboratory
For a research project, the temperature distribution along the drive train of RWTH’s NTB was measured
using a thermographic camera. According to [15], the temperature at the torque transducer, which is
mounted between the prime mover and the LAS (NTL) (Figure 15a) increases by 4 K during a full-load
operation lasting ten hours. Same applies for the region between the LAS and the DUT (Figure 15b).
The surrounding temperature inside the testing hall is typically between 15 °C and 25 °C.

To minimise electromagnetic interference, the converter of the motor is spatially separated from the rest
of the NTB in a specially dedicated room. Moreover, all cables are shielded, and signal and power wiring
are separated from each other. Cable ducts are additionally shielded. The electronics of the DUT are
housed in three electric cabinets.

 (a) Temperature distribution between the direct drive (left) and the LAS / NTL (right).

 DOI: 10.5281/zenodo.4726089 14
19ENG08 – WindEFCY: Report Deliverable D5

 (b) Temperature distribution between the LAS / NTL (left) and the DUT (right).
Figure 15: Temperature distribution along the drive train of RWTH’s NTB measured by a thermographic
camera [15].

3.3 CENER
The National Renewable Energies Centre (CENER) in Spain owns a powertrain test laboratory that
includes facilities for electrical testing. The test benches are designed to perform functional, load and
accelerated lifespan tests on wind turbines and their components up to 6 MW. Besides a medium-speed
and a high-speed generator test bench with equipment for LV and MV measurements, CENER operates
a 6 MW NTB (Figure 16 and Figure 17). The NTB uses a motor / gearbox combination to generate the
required power to drive the nacelle under test. Moreover, HiL wind loads can be simulated by the
available NTL. For a timewise synchronisation of all the equipment in the test laboratory, NTP is used.

Figure 16: 6 MW NTB of CENER located in Sangüesa, Spain. [16]

 15 DOI: 10.5281/zenodo.4726089
19ENG08 – WindEFCY: Report Deliverable D5

Figure 17: 6 MW NTB of CENER located in Sangüesa, Spain.

3.3.1 Medium-speed generator test bench
In the medium-speed generator test bench, motor and generator are directly coupled (Figure 18). The
rotational speed in this test bench ranges from 0 rpm up to 773 rpm. The maximum torque that can be
generated amounts to 190 kN m.

 Test-Bench DUT Transformer Cabinet
 Full Power Connection Trafo Grid
 Converter Cabinet 0.69 / 20 kV 20 kV
 ~ =
 = ~
 Motor Generator

 Low Voltage Medium Voltage
 Voltage: 690V or 400V Voltage: 20.000V
 Frequency: 50Hz or 60Hz Frequency: 50Hz or 60Hz
 Fixed point measurement Quality: sinusoidal
 Watt – grid analyser Measuring device: oscilloscope

Figure 18: Medium-speed generator test bench at CENER in Sangüesa, Spain. The motor (left) is directly
coupled with the generator under test (right).

 DOI: 10.5281/zenodo.4726089 16
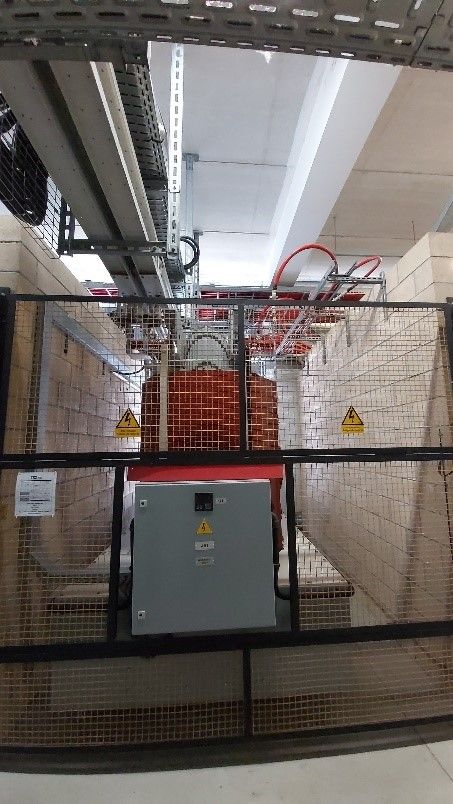
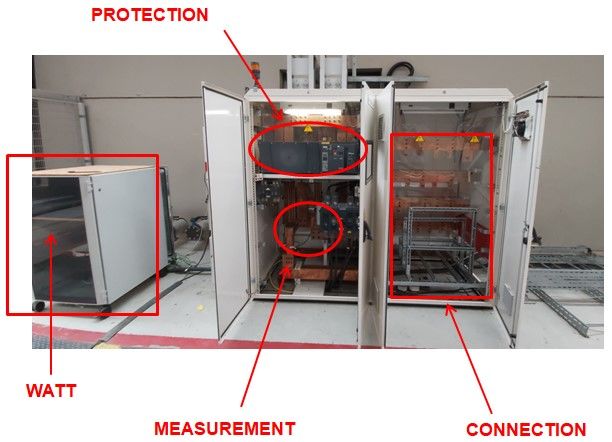
19ENG08 – WindEFCY: Report Deliverable D5

3.3.2 High-speed generator test bench
On the high-speed generator test bench (Figure 19) of CENER, the motor and the DUT are coupled
through a gearbox. The rotational speed ranges from 0 rpm to 2320 rpm with a maximum torque of
63 kN m.

 Test-Bench DUT Transformer Cabinet
 Generator Connection Trafo Grid
 Cabinet 0.69 / 20 kV 20 kV

 Motor PWM PWM
 1 2

 Rotor Converter

 Low Voltage Medium Voltage
 Voltage: 690V or 400V Voltage: 20.000V
 Frequency: 50Hz or 60Hz Frequency: 50Hz or 60Hz
 Fixed point measurement Quality: sinusoidal
 Watt – grid analyser Measuring device: oscilloscope

Figure 19: High-speed generator test bench at CENER in Sangüesa, Spain. The motor (left) drives the DUT
(right), which is a high-speed generator.

3.3.3 Electrical power supply equipment in the test benches
The electrical power supply equipment has available LV and MV measurement devices.

Low voltage measurement
LV measurement is only possible at a specific point. It is located in the connection cabinet (Figure 20)
and can automatically be switched. With the power analyser deployed, direct voltage measurement and
harmonic analysis is feasible.

 17 DOI: 10.5281/zenodo.4726089
19ENG08 – WindEFCY: Report Deliverable D5

Figure 20: Connection cabinet to measure LV at CENER.

Medium voltage measurement
For MV, points of measurement are also available. The measuring equipment is placed in a separate
transformer cabinet (Figure 21). MV probes and differential voltage probes are available to be used with
an oscilloscope.

Figure 21: Transformer cabinet for MV measurements at CENER.

Table 2: Equipment for electrical measurements.

 MEASUREMENT SYSTEM VOLTAGE PROBES CURRENT PROBES

LOW VOLTAGE Yokogawa WT-1600 N/A - Direct measurement Chauvin Arnoux P01120509

MEDIUM VOLTAGE Yokogawa DL750p Yokogawa 700224 Chauvin Arnoux P01120505

 DOI: 10.5281/zenodo.4726089 18
19ENG08 – WindEFCY: Report Deliverable D5

3.3.4 Environmental conditions at CENER laboratory
Inside CENER laboratory, both temperature and humidity are recorded continuously but are not
controlled in any way. The temperature ranges from 5 °C to 35 °C, while the humidity varies between
40 % to 80 % rH. In most cases, it is defined that all components need to be fully warmed up before any
non-torque loads are applied. The warming up is done by setting the prime mover to the nominal speed
and increasing the torque stepwise afterwards. Each step is operated for about 15-20 min.
Consequently, the entire warming up process takes approximately one hour. The thermal equilibrium is
defined by means of the temperature of the gearbox’s lubricant oil. The temperature is not measured
directly along the drive train, but through the cooling system fluids, lubrication system fluids, covers of
the generators and the power converters and the air inlets and outlets of the nacelle cooling systems.
These temperatures are used to calculate the different losses of nacelle sub-systems, such as the
gearbox and the generator.

In order to minimise electromagnetic interference, the power electronic converters and transformers are
located in a special separated room. Moreover, different grounding systems for power wiring and control
wiring are available.

3.4 Technical requirements for electrical power measurements in NTBs
The technical requirements for power measurement in NTBs are based on a previously conducted
survey among test bench operators.

The electrical power1 Pe is calculated with:

 1 e
 e = ∫ ( ) ∙ ( )d (1)
 e 0

While u(t) and i(t) are voltage and current respectively, the time interval e should ideally be chosen to
be an integer multiple of the signal period and the mechanical rotation period.

The aim is to develop a metrological framework for the measurement of the electrical part of the whole
nacelle as well as of individual parts (e.g. generator, frequency converter, auxiliary systems, filter etc.).
The measurand is power at 50 Hz, because only power at 50 Hz is desirable in the grid within the EU.
However, the relevant signals are rich in harmonics and interharmonics. These are disturbances. The
power measurement should be immune to them. It is common practice to measure up to the 50th
harmonic of 50 Hz (i.e. 2.5 kHz) or the second harmonic of the switching frequency of the frequency
converter (e.g. 5 kHz), whichever is higher. The measurement of this parameter is made traceable.

The electromagnetic environment of an NTB is challenging. It affects the behaviour of common
measuring systems. Due to the size of an NTB, grounding is not trivial. The design and calibration of
the measuring system needs to account for this.

3.4.1 Definition of the measurands for NTBs
In order to determine the efficiency in an NTB, the following measurands were defined. The RPMS must
be able to record and process these.

 • Current • Active power
 • Voltage • Power factor
 • Total Harmonic Distortion (THD) • Frequency
In addition, the apparent power, reactive power, energy and the spectrum (harmonic content) can be
measured.

1
 For simplification, the calculated electrical power is shown assuming a single-phase system.
 19 DOI: 10.5281/zenodo.4726089
19ENG08 – WindEFCY: Report Deliverable D5

3.4.2 Electrical characteristics of current and voltage sensors
The current and voltage sensors must meet the requirements of the survey above (sections 3.1 to 3.3).
The relevant signals (Table 2) are rich in harmonics and interharmonics. Therefore, the reference
sensors should have a 3 dB bandwidth of 20 kHz. The actual calibration of the individual sensors is
aimed at up to 5 kHz, since the RPMS should have a bandwidth of up to 5 kHz. To calibrate the reference
sensors, a suitable generation must be available. Each test bench has different measuring points.
Therefore, the requirements for the measurement sensors are different. The calibration of the EPMS in
test benches is performed at a fundamental frequency of 50 Hz. To determine the efficiency of a nacelle
under test, a mechanical input power and an electrical output power is required. This electrical output
power can be measured on the MV side of the MV transformer. The voltage there is less than 20 kV and
the current is less than 300 A. Another possible measuring point would be on the LV side of the
transformer. At this point the voltage is less than 1 000 V and the current is less than 3 000 A. In some
test benches, it is not possible to measure on the secondary side because there is no space for
measuring equipment. Some commercial sensors require an external power supply. A 230 V connection
must be available in the test benches.

Table 2: Overview of available signals in NTBs.

Signal Sinusoidal distorted multi-level waveforms
 below 10 kHz
LV side < 700 V rms (1 000 V peak)
 < 2 000 A rms (3 000 A peak)
MV side < 20 000 V phase to phase (12 kV phase to ground)
 < 300 A rms
Calibration frequency 50 Hz
Bandwidth reference current transformer 20 000 Hz (-3 dB bandwidth)
Bandwidth reference voltage divider 20 000 Hz (-3 dB bandwidth)
Bandwidth RPMS 5 000 Hz
Electrical supply voltage 230 V
Electrical interface measuring lead (spring-loaded), D-SUB 9 pins

3.4.3 Electrical characteristics of the power analyser
The power analyser must meet the requirements of the survey above (sections 3.1 to 3.3) when used
with suitable sensors (section 3.4.2). The relevant signals (Table 3) are rich in harmonics and
interharmonics. Therefore, the bandwidth of the power analyser should be larger than that of the
sensors. The actual calibration of the power analyser is aimed at up to 5 kHz since the RPMS should
have a bandwidth of up to 5 kHz. To calibrate the power analyser, a suitable generator must be available.
While each test bench has different measuring points requiring different sensors, their secondaries will
be very similar. Therefore, the requirements for the power analyser do not depend on the measuring
points. The calibration of the EPMS in test benches is performed at a fundamental frequency of 50 Hz.
To determine the efficiency of a nacelle under test, a mechanical input power and an electrical output
power is required. This electrical output power can be measured behind on the MV side of the MV
transformer. The voltage occurring there is larger than 1 000 V, requiring the use of voltage sensors.
Another possible measuring point would be on the secondary LV side of the transformer. At this point
the voltage is less than 1 000 V and can be measured directly. At both points, the current exceeds the
specifications of commercial power analysers; sensors or transformers need to be used. A 230 V
connection must be available in the test benches.

 DOI: 10.5281/zenodo.4726089 20
19ENG08 – WindEFCY: Report Deliverable D5
Table 3: Overview of available signals in NTBs.

Signal Sinusoidal distorted multi-level waveforms
 below 10 kHz
Inputs for direct connection ≤ 1000 V rms
 ≤ 10 A rms
Input for sensor connection ≤4 V rms (proportional to primary voltage)
 ≤4 V rms (proportional to primary current)
Calibration frequency 50 Hz
Bandwidth power analyser 100 kHz
Electrical supply voltage 230 V
Electrical interface Ethernet
Additional inputs mandatory for synchronisation
 optional for mechanical measurements
 (e.g. torque or speed)

3.4.4 Torque and rotational speed sensor signal
Table 4: Measurement technology to gather torque and rotational speed signals.

 Strain gauges on surface of the test specimen
 Torque sensor
 Absolute encoder
 Rotational speed sensor
 Incremental encoder
More details about measuring and calibrating rotational speed will be explained in Deliverable D2 within
19ENG08: Report describing the requirements of tachometers such as the evaluation of existing
tachometer measuring principles and their capabilities, and the procedure developed to calibrate
tachometers with an uncertainty of 0.01 %. More information about measuring torque in the MN m range
traceably will be provided in Deliverable D3 within 19ENG08: Report describing the calibration of the
5 MN m torque transfer standard partially up to 1.1 MN m with an uncertainty < 0.1 % and in the full
range up to 5 MN m with an uncertainty < 0.5 % with synchronised measurements of rotational speed
up to 20 min-1 on the low-speed shaft respectively torque measurements up to 100 kN m with
synchronised measurements of rotational speed up to 1600 min-1 on the high-speed shaft.

3.4.5 Environmental conditions
Table 5: Ambient conditions in NTBs.

 Temperature in the hall 15 - 25 °C
 Relative humidity in the hall 40 - 60 %
The next step is to define and set up the RPMS for all relevant electrical parts of the nacelle. This system
is composed of a suitable multi-channel power analyser and wideband current and voltage sensors that
meet the aforementioned requirements.

 21 DOI: 10.5281/zenodo.4726089
19ENG08 – WindEFCY: Report Deliverable D5

4 Conclusion and future work
To trace the electrical power measurement in NTBs to national standards under consideration of various
influences via a transfer standard, the requirements for a RPMS are defined within this report. The
overview of manifold electrical systems in wind turbines and both the general and the specific set-up of
NTBs gives an insight into the complexity of the requirements for an RPMS and the definition of the
measurands in an NTB. Not only practical aspects such as available space, but also expected signals
shapes and maximum current and voltage are gathered and defined for the further course of the project
WindEFCY.

Within the WindEFCY project, the electrical power supply equipment of two different NTBs will be
calibrated using the RPMS developed based on the requirements defined in this report: at (1) DyNaLab
of FhG IWES in Bremerhaven and at (2) CWD of RWTH in Aachen, both in Germany. As an overall aim,
an advanced metrological framework for the measurement of the electrical part of the whole nacelle as
well as of individual parts including a Good Practice Guide on the calibration procedure for traceable
electrical power measurement at the generator, converter and the filter using a reference power
measurement system will be developed.

 DOI: 10.5281/zenodo.4726089 22
19ENG08 – WindEFCY: Report Deliverable D5

I Bibliography
[1] N. Quental, D. Buttle, S. Abrar, K. Firkaviciuté, J. J. Mingo, D. Sofianopoulos, A. Kontoudakis and C.
 S. Agut, "The strategic energy technology (SET) plan: At the heart of energy research and innovation
 in Europe," 10 January 2021. [Online]. Available:
 https://setis.ec.europa.eu/sites/default/files/setis%20reports/2017_set_plan_progress_report_0.pdf.

[2] IEC 61400-12-1:2017 Wind energy generation systems - Part 12-1: Power performance
 measurements of electricity producing wind turbines, 2017.

[3] E. Hau and H. E. v. Renouard, Wind Turbines: Fundamentals, Technologies, Application, Economics,
 Berlin, Heidelberg (Germany): Springer Berlin Heidelberg, 2013.

[4] "What is the Working Principle of Wind Turbine?," Electrical 4 U, [Online]. Available:
 https://www.electrical4u.com/working-principle-of-wind-turbine/. [Accessed 08 April 2021].

[5] T. Duda, G. Jacobs and D. Bosse, "Investigation of dynamic drivetrain behaviour of a wind turbine
 during a power converter fault," in J. Phys.: Conf. Ser. 1037 052031, 2018.

[6] J. F. Manwell, J. G. McGowan and A. L. Rogers, Wind energy explained - theory, design and
 application, John Wiley & Sons Ltd, 2010.

[7] F. D. Bianchi, H. De Battista and R. J. Mantz, Wind Turbine Control Systems: Principles, Modelling
 and Gain Scheduling Design, London, UK: Springer-Verlag London, 2007.

[8] U. Jassmann, Hardware-in-the-Loop Wind Turbine System Test Benches and their Usage for
 Controller Validation, RWTH Aachen University: Dissertation, 2018.

[9] "https://www.cwd.rwth-aachen.de/iea-wind/downloads/," [Online]. Available: https://www.cwd.rwth-
 aachen.de/fileadmin/images/content/Projekte/IEA_Wind_Task35/Downloads/2016_05_IEA_Wind_T
 ask_35_-_Test_Center_Capabilities__fact_sheet_.pdf. [Accessed 08 April 2021].

[10] "Lindø Offshore Renewables Center," [Online]. Available: https://www.lorc.dk/test-facilities.
 [Accessed 30 04 2021].

[11] "Nacelle Testing and Examination of Electrical Characteristics," [Online]. Available:
 https://www.iwes.fraunhofer.de/en/test-centers-and-measurements/nacelle-testing-and-certification-
 of-electrical-characteristics.html. [Accessed 20 04 2021].

[12] "IDOM Advanced Engineering," [Online]. Available: https://www.idom.com/project/dynalab-test-
 laboratory/. [Accessed 14 03 2021].

[13] "FVA research nacelle," [Online]. Available: https://fva-net.de/aktuelles/detail/projektstart-fva-gondel-
 71/. [Accessed 20 04 2021].

[14] "FVA research nacelle at CWD RWTH Aachen University," [Online]. Available: https://www.cwd.rwth-
 aachen.de/projekte/abgeschlossene-projekte/fva-gondel/. [Accessed 20 04 2021].

[15] S. Kock, G. Jacobs and D. Bosse, "Precise MN m Torque Measurement in Wind Turbine Test Benches
 - High-End Thermograhy with VarioCAM HD research 700," InfraTec GmbH, 2019.

[16] "CENER - The National Renewable Energies Centre in Spain," [Online]. Available:
 http://www.cener.com/en/wind-turbine-test-laboratory-lea/powertrain-test-laboratories-and-electrical-
 testing/. [Accessed 20 04 2021].

 23 DOI: 10.5281/zenodo.4726089
19ENG08 – WindEFCY: Report Deliverable D5

II Acronyms
AC alternating current
CENER National Renewable Energies Centre
CWD Center for Wind Power Drives
DAQ data acquisition
DC direct current
DFIG doubly fed induction generator
DTU Danmarks Tekniske Universitet
DUT device under test
DyNaLab dynamic nacelle testing laboratory
EMPIR European Metrology Programme for Innovation and Research
EoL end of line
EPMS electrical power measurement system
EU European Union
FhG IWES Fraunhofer Gesellschaft - Institut für Windenergiesysteme
FVA Forschungsvereinigung Antriebstechnik e. V.
HiL Hardware-in-the-Loop
HSS high-speed shaft
IRIG-B inter range instrumentation group timecode B
LAS load application system
LORC Lindø Offshore Renewables Center
LSS low-speed shaft
LV low-voltage
MV medium-voltage
NTB nacelle system test bench
NTL non-torque loading
NTP network time protocol
PTB Physikalisch-Technische Bundesanstalt
PTP precision time protocol
PWM pulse-width modulation
RPMS reference power measurement system
RWTH Rheinisch-Westfälische Technische Hochschule Aachen
SQIG squirrel cage induction generators
THD total harmonic distortion
VTT Technical Research Centre of Finland Ltd.
WindEFCY Wind efficiency
WP3 Work Package 3
WRIG wound rotor induction generator

DOI: 10.5281/zenodo.4726089 24
19ENG08 – WindEFCY: Report Deliverable D5

III Acknowledgements
The project 19ENG08 – WindEFCY has received funding from the EMPIR programme co-financed by
the Participating States and from the European Union’s Horizon 2020 research and innovation
programme.

 25 DOI: 10.5281/zenodo.4726089
You can also read


