Ultrasonographic Assessment of Extravascular Lung Water in Hospitalized Patients Requiring Hemodialysis: A Prospective Observational Study
←
→
Page content transcription
If your browser does not render page correctly, please read the page content below
Research Article

                                                             Cardiorenal Med 2021;11:151–159                                                Received: 02 11, 2021
                                                                                                                                            Accepted: 04 8, 2021
                                                             DOI: 10.1159/000516474                                                         Published online: June 4, 2021

Ultrasonographic Assessment of Extravascular
Lung Water in Hospitalized Patients Requiring
Hemodialysis: A Prospective Observational Study
Jing Miao a Janina Paula T. Sy-Go a Meltiady Issa b Hussam Jenad c
Sandhya Manohar a Ziad Zoghby a Kianoush B. Kashani a, c James R. Gregoire a
aDivision
         of Nephrology and Hypertension, Mayo Clinic, Rochester, MN, USA; bDivision of Hospital Internal Medicine,
Mayo Clinic, Rochester, MN, USA; cDivision of Pulmonary and Critical Care Medicine, Mayo Clinic, Rochester, MN, USA

Keywords                                                                                         showing a bias of 0.06 (TBLN = 1.2) between devices. The
Handheld ultrasound machine · Portable ultrasound                                                slope and intercept of the Deming regression in IVC mea-
machine · Lung B-lines · Inferior vena cava · Hemodialysis                                       surements were 0.77 and 0.46, respectively; Bland-Altman
                                                                                                 plot showed a bias of −0.07. Compared with predialysis,
                                                                                                 TBLN significantly (p < 0.001) decreased after dialysis, while
Abstract                                                                                         IVC was unchanged (p = 0.16). Univariate analysis showed
Introduction: Sonographic technologies can estimate extra-                                       that cardiovascular disease (odds ratio [OR] 8.94 [2.13–
vascular lung water (EVLW) in hemodialysis (HD) patients.                                        61.96], p = 0.002), smoking history (OR 5.75 [1.8–20.46], p =
This study investigated the suitability of a handheld scanner                                    0.003), and right pleural effusion (OR 5.0 [1.2–25.99], p = 0.03)
in contrast to a portable scanner for quantifying EVLW in                                        were strong predictors of EVLW indicated by TBLN ≥ 4. Con-
hospitalized patients requiring HD. Methods: In this pro-                                        clusion: The lung and IVC findings obtained from handheld
spective study, 54 hospitalized HD patients were enrolled.                                       and portable ultrasound scanners are comparable and con-
Bedside lung ultrasound was performed within 30 min be-                                          cordant. Cardiovascular disease and smoking history were
fore and after dialysis using handheld (phased array trans-                                      strong predictors of EVLW. The use of TBLN to assess EVLW
ducer, 1.7–3.8 MHz) and portable (curved probe, 5–2 MHz)                                         in hospitalized HD patients is feasible. Further studies are
ultrasound devices. Eight lung zones were scanned for total                                      needed to determine if TBLN can help guide volume remov-
B-lines number (TBLN). The maximum diameter of inferior                                          al in HD patients.                      © 2021 The Author(s)
vena cava (IVC) was measured. We performed Passing-                                                                                        Published by S. Karger AG, Basel

Bablok regression, Deming regression, Bland-Altman, and
logistic regression analysis. Results: The 2 devices did not
differ in measuring TBLN and IVC (p > 0.05), showing a high                                          Introduction
correlation (r = 0.92 and r = 0.51, respectively). Passing-
Bablok regression had a slope of 1.11 and an intercept of 0                                         Hemodialysis (HD) can efficiently achieve extracor-
for TBLN, and the slope of Deming regression was 1.02 with-                                      poreal removal of waste products and water from the
in the CI bands of 0.94 and 1.11 in the full cohort. TBLN was                                    blood [1]. While achieving optimal volume status is cru-
logarithmically transformed for Bland-Altman analysis,                                           cial for patients undergoing HD, assessing the dry weight

karger@karger.com      © 2021 The Author(s)                                                      Correspondence to:
www.karger.com/crm     Published by S. Karger AG, Basel                                          James R. Gregoire, jgregoire @ mayo.edu
                       This is an Open Access article licensed under the Creative Commons
                       Attribution-NonCommercial-4.0 International License (CC BY-NC)
                       (http://www.karger.com/Services/OpenAccessLicense), applicable to
                       the online version of the article only. Usage and distribution for com-
                       mercial purposes requires written permission.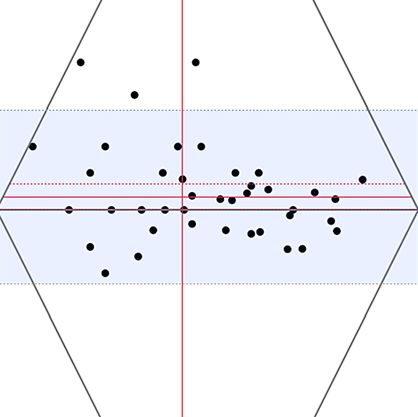
remains challenging. There is no consensus regarding the one used as vascular access for the HD session that could interfere
optimal method of extracellular volume assessment in with ambulatory blood pressure monitoring, (iii) known severe
mental disorder, and (iv) positive coronavirus disease (CO
HD patients [2, 3]. Volume assessment is usually based VID-19).
on clinical judgment [4], but dry weight estimation is sub- The demographic, clinical, and biochemical information was
jective and can often be inaccurate and differ significant- collected from the medical record of each patient. The investiga-
ly from the actual dry weight. tors were not involved in managing these patients, and the infor-
Lung ultrasound is a novel, reliable, and noninvasive mation collected on B-lines and IVC dimensions was not provided
to the treating physicians. The HD and fluid removal prescription
approach to objectively quantify extravascular lung wa- were determined by the nephrologist caring for the patients.
ter (EVLW) by detecting B-lines [5]. B-lines are defined
as vertical bands of hyperechoic artifacts that originate at Ultrasound Protocol
the pleural line and traverse the entire ultrasound screen We performed lung ultrasound in the supine position at the
vertically to the bottom of the screen, and multiple B- bedside within 30 min before and after each dialysis session in a
quiet room with controlled air temperature (∼22°C) by 2 inde-
lines are considered the sonographic sign of interstitial pendent nephrology fellows who received prior training (J.M.
edema [6]. Additionally, ultrasound measurements of and J.P.T.S.). The examinations were done without prior knowl-
the inferior vena cava (IVC) diameter have been used to edge of the patient’s clinical data. At predialysis, ultrasound im-
assess intravascular volume status in HD patients [7]. aging was first performed using a handheld ultrasound device
Portable ultrasound machines on wheels, typically the equipped with a 1.7- to 2.8-MHz phased array transducer (Vscan
Extend; GE Healthcare) by one of the examiners. This was im-
size of a laptop computer, are commonly used for point- mediately followed with ultrasound imaging using a portable ul-
of-care applications in clinical practice [8]. Handheld ul- trasound machine equipped with a 5- to 2-MHz curved probe
trasound scanners can also be used for the same purpos- (Sonosite M-Turbo; FUJIFILM) by the other examiner. The de-
es. Some comparative studies of handheld ultrasound de- vice was exchanged between the 2 examiners at postdialysis to
vices with high-end sonographic systems have been avoid or decrease interobserver and interdevice variations. The
examiners were mutually blinded. Time-gain compensation and
reported. The majority of these studies focused on ab- the depth were adjusted to obtain B-line and IVC measurements.
dominal and pleural applications when evaluating asci- In general, depth was set up at 18 cm for image captures but ad-
tes, hydronephrosis, pleural cavities, abdominal aortic justed to the patient’s body size. When scanning with the portable
aneurysms, and obstetric and gynecological pathologies ultrasound machine, tissue harmonic imaging was on. Tissue
[9]. A few studies showed good overall agreement for de- harmonic imaging is not supported with the handheld ultra-
sound device.
tecting B-lines in patients with heart failure [10] or in TBLN was obtained by scanning 8 lung zones, which consist-
pulmonary ICU patients [11, 12]. However, a handheld ed of 4 zones in each hemithorax upper and lower anterior chest
ultrasound machine’s accuracy and performance in eval- in the midclavicular and midaxillary lines on either side (Fig. 1a),
uating B-lines in HD patients compared to a convention- as in the method previously described [13]. Although detection
al sonographic machine remains unknown. In this study, of B-lines is enhanced by carrying out scans in multiple inter-
spaces [14, 15], scanning 8 lung sites is considered a reasonable
we planned to test and validate the clinical applicability approach [2, 13]. This method was used as it would be time-sav-
of the handheld device in B-lines quantification and IVC ing and less cumbersome and hence have a greater potential for
measurements in hospitalized patients requiring HD by routine clinical use. B-lines were defined as an echogenic, coher-
comparing it with a conventional portable ultrasound ent, dynamic, wedge-shaped signal with a narrow origin in the
machine. near field of the image arising from the pleural line and extending
to the screen’s edge [6]. TBLN ≥4 suggests increased EVLW [4].
In this study, we performed the analyses using the full cohort and
a subcohort in which participants were found to have ≥4 TBLN
Materials and Methods at predialysis. As previously described [7], the maximum diam-
eter of IVC was measured in the supine position using the M
Patients mode at 2 cm below the inferior cavoatrial junction by tracking
The Mayo Clinic IRB approved the study protocol. We con- the distance between anterior and posterior walls of IVC during
ducted this prospective observational single-center study from passive respiration.
July 1, 2020, to October 15, 2020, at Mayo Clinic Hospital, Saint
Marys Campus in Rochester, Minnesota. Non-ICU patients were Statistical Analysis
enrolled in this study if they were (i) ≥18 years old, (ii) currently Data handling and statistical analysis were performed using
hospitalized for any reason, (iii) requiring HD during the hospi- JMP Pro software version 14.0 (SAS Institute Inc., Cary, NC,
talization, and (iv) agreeing to provide informed consent for ultra- USA). Results are expressed as the mean ± standard deviation
sound scans before and after HD. We excluded patients with (i) (SD) for normally distributed data and the median (25th, 75th
known pregnancy at study entry or during the study period, (ii) percentiles) for data not showing normal distribution. Statistical
nonfunctional arteriovenous fistula in the contralateral arm of the significance was determined by the unpaired t test (2-tailed) and
152 Cardiorenal Med 2021;11:151–159 Miao/Sy-Go/Issa/Jenad/Manohar/
DOI: 10.1159/000516474 Zoghby/Kashani/GregoirePre Post
AAL STN AAL
PAL PAL
1 2 2 1
3 4 4 3
Handheld
R L
a
Pre Post
Handheld
Portable
Portable
c b
Fig. 1. An overview of B-lines and IVC obtained from handheld trasound machines at before and after dialysis. Representative im-
and portable sonographic machines. a The 8 areas of thoracic ul- ages of B-line showing vertical artifacts fanning out from the lung-
trasonography used for B-line searching in the study. Areas 1 and wall interface and spreading up to the edge of the screen from a
3: upper lateral and basal lateral. Areas 2 and 4: upper anterior and hospitalized patient requiring hemodialysis. c The maximum di-
lower anterior. Each area was the same on the right and left side. ameter of IVC was measured using ultrasound machines during
PAL, posterior axillary line; AAL, anterior axillary line; STN, ster- exhalation in a hospitalized patient requiring hemodialysis. IVC,
num. b B-line was searched using both handheld and portable ul- inferior vena cava.
Fisher or χ2 (2-sided) test, respectively. Logistic regression model Data were tested for normal distribution using classical methods
was used when evaluating the probability of detecting TBLN ≥4. such as the Shapiro-Wilk test or Kolmogorov-Smirnov test, and the
The odds ratios (ORs) and 95% confidence interval (CI) were pre- normality test was passed with the p value >0.05.
sented. A p value ofTable 1. Patients’ demographic, clinical, and laboratory characteristics
Variables All TBLN 0.99
Cardiovascular disease 36 (67) 17 (52) 19 (91) 0.99
Indication for hemodialysis, n (%)
End-stage kidney disease 35 (65) 22 (67) 13 (62) 0.78
Acute kidney injury 19 (35) 11 (33) 8 (38)
Hemodialysis access, n (%)
Arteriovenous fistula 14 (26) 8 (24) 6 (29) 0.49
Tunneled 34 (63) 20 (61) 14 (67)
Temporary 6 (11) 5 (15) 1 (5)
Ultrafiltration
Planned ultrafiltration, mLb 2,126±1,218 1,982±1,241 2,351±1,175 0.27
Actual ultrafiltration, mLb 2,025±1,193 1,946±1,257 2,148±1,102 0.54
Differences, mLc, d 0 (−3, 141) 0 (−3, 38) 0 (−3, 216) 0.56
24-h urinary volume, mLc 100 (0, 355) 0 (0, 400) 100 (0, 342.5) 0.45
≥400 mL, n (%) 12 (22) 8 (24) 4 (19) 0.75
Total output, mLb, e 2,364±1,203 2,270±1,323 2,512±999.8 0.48
Estimated dry weight, kgc 78 (73, 106) 81 (72, 115) 76.3 (72, 96) 0.34
Physical examination, n (%)
Pedal edemaf 22 (43) 10 (32) 12 (60) 0.08
Jugular venous pressureg 3 (7) 2 (8) 1 (6) >0.99
Abnormal lung auscultation 16 (29) 8 (24) 8 (38) 0.36
Pleural effusion, n (%)
Left 10 (19) 4 (12) 6 (29) 0.17
Right 10 (19) 3 (9) 7 (33) 0.04
Laboratoryb
BUN, mg/dL 44.2±25.5 42.5±26.1 46.9±24.9 0.40
Creatinine, mg/dL 5.1±2.3 5.3±2.5 4.7±2.0 0.40
Hb, g/dL 8.9±1.1 8.8±1.2 8.9±1.1 0.81
Bicarbonate, mmol/L 24.9±3.2 25.2±3.1 24.6±3.4 0.53
Lactate, mmol/L 1.3±0.6 1.2±0.5 1.4±0.8 0.50
Na+, mmol/L 136.0±3.7 135.4±4.1 137±2.8 0.09
K+, mmol/L 4.6±0.5 4.5±0.4 4.7±0.7 0.17
Cl−, mmol/L 96.4±3.8 95.7±3.7 97.6±3.6 0.07
Albumin, g/dL 3.5±0.6 3.4±0.6 3.5±0.6 0.56
TBLN, total B-lines number; BUN, blood urea nitrogen; Hb, hemoglobin. a p values derived from a 2-sample test either a t test or χ2/
Fisher’s exact test for comparison of characteristics in subjects with TBLNTable 2. Comparisons of TBLN and IVC diameters obtained by with an R2 of 0.33. The slope and intercept of the Deming
handheld and portable ultrasound machines regression were 0.77 and 0.46, respectively. The orthogo-
nal fit ratio was found to be 0.50, with a moderate corre-
Handheld Portable p
lation of 0.57 between both machines. In the Bland-Alt-
TBLNa man plot, the bias was found to be −0.07 (95% CI: −0.26
Predialysis 5.5±7.6; 3 (0, 8) 4.8±7.1; 1.5 (0, 6.3) 0.16 to 0.06, p = 0.21) with an SD of 0.43, displaying an accept-
Postdialysis 3.8±5.8; 1 (0, 5) 3.1±6.1; 0 (0, 3) 0.47 able agreement between handheld and portable machines
IVC diameter, cmb
(95% CI: −0.94 to 0.74).
Predialysis 1.8±0.4 2.0±0.5 0.50
Postdialysis 1.8±0.3 1.8±0.5 0.76
Change of TBLN and IVC Diameters after Dialysis
TBLN, total B-lines number; IVC, inferior vena cava. a Values Since TBLN and IVC obtained from handheld and
are expressed as mean ± standard deviation, followed by median portable ultrasound machines were comparable and con-
(25th, 75th percentiles). b Values are expressed as mean±standard
deviation.
cordant, the average TBLN and IVC diameters from both
devices were calculated and compared before and after
dialysis, respectively. Compared with predialysis, the val-
ue of TBLN, not IVC diameters, was significantly (p <
0.001) decreased at postdialysis both in the full cohort and
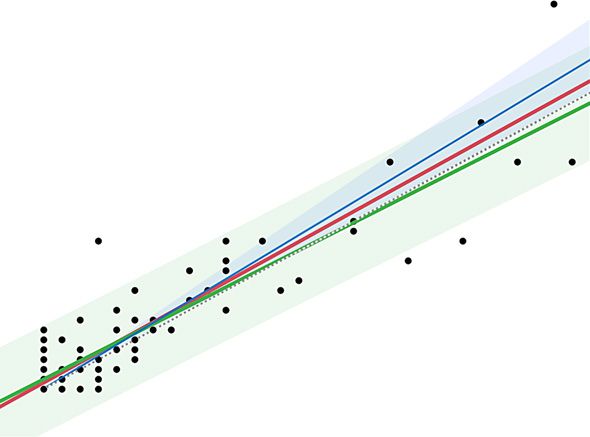
In the full cohort, regression was performed to com- in the subcohort (Table 3).
pare B-lines measurements between handheld and por-
table ultrasound analysis. We observed that the values ob- Clinical Predictors for Detection of EVLW
tained from handheld and portable machines were ran- A comparison of patients’ baseline characteristics in
domly scattered around the line of equality, and the 2 those with TBLN40
Linear fit
Handheld = 1.005 + 0.933*Portable
35 RSquare 0.838
RSquare Adj. 0.837
Root mean square error 2.736
30
Mean of response 4.676
Observations (or Sum Wgts) 108
25 Passing-Bablock regression
Parameter Estimate Lower CL Upper CL
20 Intercept 0 0 0
Handheld
Slope 1.111 1 1.25
Tau 0.721
15
Orthogonal fit ratio = 1.038
Parameters Handheld Portable
10 Mean 4.676 3.935
Std. deviation 6.768 6.642
Variance ratio 1.038
5
Equality Correlation 0.916
Passing-Bablok Intercept 0.666
0 Slope 1.019
Orthogonal fit
Lower CL 0.936
Linear fit
Upper CL 1.109
–5
0 5 10 15 20 25 30 Alpha 0.050
a Portable
1.0
Difference: (Handheld[Log] – Portable[log]
0.5
Bland-Altman
Parameter Estimate Lower CL Upper CL
0 Std. deviation 0.210 0.169 0.252
Upper limit 0.476 0.374 0.578
Lower limit –0.348 –0.451 -0.246
Parameter Value Parameter Value
–0.5 Mean difference 0.064 t-ratio 2.152
Std. error 0.029 DF 49
Upper 95% 0.124 Prob > ItI 0.036
Lower 95% 0.004 Prob > t 0.018
N 50 Prob < t 0.982
Correlation 0.864
–1.0
0 0.5 1.0 1.5
b Mean: (Handheld[log] + Portable[log])/2
Fig. 2. Method comparison between handheld and portable ultra- cohort study. Dashed gray lines indicate the limit of agreement
sound analysis of TBLN. a Passing-Bablok and orthogonal (Dem- (mean ± 1.96 SD), the solid gray line is the line of equality, the
ing) regression analysis of TBLN between handheld and portable solid red line shows the mean difference (bias), and the dashed red
ultrasound machines in the full cohort. b Bland-Altman plot of the lines show the 95% CI around the mean difference. TBLN, total B-
differences in TBLN between handheld and portable ultrasound lines number.
machines versus the mean value of both measurements in the full
156 Cardiorenal Med 2021;11:151–159 Miao/Sy-Go/Issa/Jenad/Manohar/
DOI: 10.1159/000516474 Zoghby/Kashani/GregoireTable 3. Comparisons of TBLN and IVC diameters before and after dialysis
Full cohort (n = 54) Subcohort with ≥4 TBLN (n = 21)
predialysis postdialysis p value predialysis postdialysis p value
TBLNa 5.2±7.2; 2.3 (0, 7.1) 3.5±5.8; 1.0 (0, 3.4)180 100
160 * * *
* 80
Diastolic BP, mm Hg
Systolic BP, mm Hg
140
120 60
100 40
80
20
60
40 0
a Pre 1h 2h 3h 4h Post b Pre 1h 2h 3h 4h Post
Fig. 3. Dynamic changes of blood pressure levels during dialysis. a Systolic BP decreased significantly at 3 h after
dialysis compared to predialysis. b Diastolic BP decreased significantly since 3 h after dialysis compared to pre-
dialysis. *p < 0.05 versus predialysis. BP, blood pressure.
0.92 in the full cohort suggested a significant correlation the 2 ultrasound machines, despite small differences
of TBLN between both ultrasound machines. We demon- among them. Based on our results, the 2 ultrasound ma-
strated that the agreement in quantifying B-lines between chines could be used interchangeably for TBLN and IVC
devices is acceptable. In the Deming and Passing-Bablok measurements.
regressions, this is indicated by an intercept that is not Our study has several limitations. First, this is a single-
confidently different from 0 and a slope that is not confi- center study, and the findings should be interpreted with-
dently different from 1 both in the full cohort. The or- in the context of the study design. Second, although many
thogonal fit ratio of 1.04 in the full cohort for TBLN subjects were enrolled in the study, the majority of pa-
proved that both ultrasound machines did not have re- tients did not have significant EVLW, and the number of
markably different measurement uncertainties. To deter- patients having more B-lines (TBLN ≥4) was small. Third,
mine the limits of agreement between the 2 devices, we the comparison of IVC measurements between the 2 de-
performed Bland-Altman analysis. Our analysis showed vices is limited by its small sample size. Last, the image
a small difference in TBLN between both machines. The quality of the B-lines and IVC measurements from the 2
bias might have been caused by interexaminer variation devices was comparable; however, we did not directly as-
as interdevice variation was mitigated by the exchanging sess the image quality.
device protocol after dialysis. Therefore, TBLN measure- Taken together, we demonstrated the feasibility and
ments between handheld and portable ultrasound ma- accuracy of handheld ultrasound machine in B-lines as-
chines were in agreement. The mean bias of 1.2 and limits sessment and IVC measurements when compared with
of agreement (95% CI: −0.35, 0.48) were also acceptable. the portable ultrasound device. Our data also showed that
Platz et al. [10] also found that there were no significant cardiovascular disease and smoking history were strong
differences among a small number (n = 21) of patients predictors of EVLW, and that B-lines assessment for dry
with heart failure in the number of detectable B-lines be- weight estimation in hospitalized patients requiring HD
tween the Vscan pocket device and high-end ultrasound is feasible. Nevertheless, further investigation is needed
systems. In their study, only B-lines number was com- on how to guide volume removal using TBLN in HD pa-
pared between the 2 devices, while method comparison tients.
analysis was not performed [10]. In addition, their find-
ings indicated a substantial difference based on clip dura-
tion, with a significantly greater number of B-lines in lon- Statement of Ethics
ger compared with shorter clips [10]. Of note, we used the
Vscan Extend, a newer version handheld device, to scan The Mayo Clinic IRB approved the study protocol. Informed
consent for participation was obtained from each participant. The
B-lines, and the B-lines number used in our study was not research was conducted ethically in accordance with the World
based on clip duration. In addition, we showed a moder- Medical Association Declaration of Helsinki.
ate interdevice correlation in IVC measurements between
158 Cardiorenal Med 2021;11:151–159 Miao/Sy-Go/Issa/Jenad/Manohar/
DOI: 10.1159/000516474 Zoghby/Kashani/GregoireConflict of Interest Statement Author Contributions
The authors have no conflicts of interest to declare. J.R.G. conceived and designed the study. J.M. and J.P.T.S. con-
ducted the study and contributed data acquisition. J.M. performed
statistical analysis and manuscript drafting. K.B.K., Z.Z., M.I.,
S.M., and H.J. contributed important intellectual content during
Funding Sources manuscript drafting. Each author was involved in the approval of
the final version of the manuscript.
The authors did not receive any funding.
References
1 Agarwal R, Toto RD, Weir MR. Extravascular 10 Platz E, Pivetta E, Merz AA, Peck J, Rivero J, 18 Giavarina D. Understanding Bland Altman
lung water assessment by ultrasound to guide Cheng S. Impact of device selection and clip analysis. Biochem Med. 2015 Jun; 25(2): 141–
dry weight changes: ready for prime time? Am duration on lung ultrasound assessment in 51.
J Kidney Dis. 2020 Jan;75(1):1–3. patients with heart failure. Am J Emerg Med. 19 Passing H, Bablok W. Comparison of several
2 Sinha AD, Agarwal R. Can chronic volume 2015 Nov;33(11):1552–6. regression procedures for method compari-
overload be recognized and prevented in he- 11 Güney T, Gürsel G, Özdemir U, Tekin Ö, Çi- son studies and determination of sample siz-
modialysis patients? The pitfalls of the clinical men M, Mamadova A, et al. Are pocket sized es. Application of linear regression proce-
examination in assessing volume status. Se- ultrasound devices sufficient in the evaluation dures for method comparison studies in Clin-
min Dial. 2009 Sep–Oct;22(5):480–2. of lung ultrasound patterns and aeration scor- ical Chemistry, Part II. J Clin Chem Clin
3 Malha L, Fattah H, Modersitzki F, Goldfarb ing in pulmonary ICU patients? J Clin Monit Biochem. 1984 Jun;22(6):431–45.
DS. Blood volume analysis as a guide for dry Comput. 2020 Nov 10: 1–9. Epub ahead of 20 Covic A, Siriopol D, Voroneanu L. Use of
weight determination in chronic hemodialy- print. lung ultrasound for the assessment of volume
sis patients: a crossover study. BMC Nephrol. 12 Bedetti G, Gargani L, Corbisiero A, Frassi F, status in CKD. Am J Kidney Dis. 2018 Mar;
2019 Feb;20(1):47. Poggianti E, Mottola G. Evaluation of ultra- 71(3):412–22.
4 Arun Thomas ET, Mohandas MK, George J. sound lung comets by hand-held echocar- 21 Zoccali C, Torino C, Tripepi R, Tripepi G,
Comparison between clinical judgment and diography. Cardiovasc Ultrasound. 2006 D’Arrigo G, Postorino M, et al. Pulmonary
integrated lung and inferior vena cava ultra- Aug;4:34. congestion predicts cardiac events and mor-
sonography for dry weight estimation in he- 13 Volpicelli G, Mussa A, Garofalo G, Cardinale tality in ESRD. J Am Soc Nephrol. 2013 Mar;
modialysis patients. Hemodial Int. 2019 Oct; L, Casoli G, Perotto F, et al. Bedside lung ul- 24(4):639–46.
23(4):494–503. trasound in the assessment of alveolar-inter- 22 Saad MM, Kamal J, Moussaly E, Karam B,
5 Kalantari K, Chang JN, Ronco C, Rosner MH. stitial syndrome. Am J Emerg Med. 2006 Oct; Mansour W, Gobran E, et al. Relevance of B-
Assessment of intravascular volume status 24(6):689–96. lines on lung ultrasound in volume overload
and volume responsiveness in critically ill pa- 14 Donadio C, Bozzoli L, Colombini E, Pisanu G, and pulmonary congestion: clinical correla-
tients. Kidney Int. 2013 Jun;83(6):1017–28. Ricchiuti G, Picano E, et al. Effective and tions and outcomes in patients on hemodialy-
6 Lichtenstein DA, Mezière GA, Lagoueyte JF, timely evaluation of pulmonary congestion: sis. Cardiorenal Med. 2018 Nov;8(2):83–91.
Biderman P, Goldstein I, Gepner A. A-lines qualitative comparison between lung ultra- 23 Loutradis C, Sarafidis PA, Ekart R, Papado-
and B-lines: lung ultrasound as a bedside tool sound and thoracic bioelectrical impedance poulos C, Sachpekidis V, Alexandrou ME, et
for predicting pulmonary artery occlusion in maintenance hemodialysis patients. Medi- al. The effect of dry weight reduction guided
pressure in the critically ill. Chest. 2009 Oct; cine. 2015 Feb;94(6):e473. by lung ultrasound on ambulatory blood
136(4):1014–20. 15 Gargani L, Sicari R, Raciti M, Serasini L, pressure in hemodialysis patients: a random-
7 Brennan JM, Ronan A, Goonewardena S, Passera M, Torino C, et al. Efficacy of a re- ized controlled trial. Kidney Int. 2019 Jun;
Blair JE, Hammes M, Shah D, et al. Handcar- mote web-based lung ultrasound training for 95(6):1505–13.
ried ultrasound measurement of the inferior nephrologists and cardiologists: a LUST trial 24 Trezzi M, Torzillo D, Ceriani E, Costantino G,
vena cava for assessment of intravascular vol- sub-project. Nephrol Dial Transplant. 2016 Caruso S, Damavandi PT, et al. Lung ultraso-
ume status in the outpatient hemodialysis Dec;31(12):1982–8. nography for the assessment of rapid extra-
clinic. Clin J Am Soc Nephrol. 2006 Jul; 1(4): 16 Shrestha L, Kulig B, Moscetti R, Massantini R, vascular water variation: evidence from he-
749–53. Pawelzik E, Hensel O, et al. Comparison be- modialysis patients. Intern Emerg Med. 2013
8 Niyyar VD, O’Neill WC. Point-of-care ultra- tween hyperspectral imaging and chemical Aug;8(5):409–15.
sound in the practice of nephrology. Kidney analysis of polyphenol oxidase activity on 25 Basso F, Milan Manani S, Cruz DN, Teixeira
Int. 2018 May;93(5):1052–9. fresh-cut apple slices. J Spectroscopy. 2020; C, Brendolan A, Nalesso F, et al. Comparison
9 Rykkje A, Carlsen JF, Nielsen MB. Hand-held 2020:10. and reproducibility of techniques for fluid
ultrasound devices compared with high-end 17 Doğan NÖ. Bland-Altman analysis: a para- status assessment in chronic hemodialysis pa-
ultrasound systems: a systematic review. Di- digm to understand correlation and agree- tients. Cardiorenal Med. 2013 Jul; 3(2): 104–
agnostics. 2019 Jun;9(2):61. ment. Turk J Emerg Med. 2018 Sep; 18(4): 12.
139–41.
Ultrasonographic Assessment of Cardiorenal Med 2021;11:151–159 159
Extravascular Lung Water DOI: 10.1159/000516474You can also read