DenseNet-Based Classification of MRI Images for Detecting the Difference before and after Treating Liver Cancer
←
→
Page content transcription
If your browser does not render page correctly, please read the page content below
Hindawi
Scientific Programming
Volume 2021, Article ID 4609256, 8 pages
https://doi.org/10.1155/2021/4609256

Research Article
DenseNet-Based Classification of MRI Images for Detecting the
Difference before and after Treating Liver Cancer

          Jianbo Peng
          Department of Radiology, Fengdu People’s Hospital, 33 Lutang Street, Sanhe Street, Fengdu County, Chongqing 408200, China

          Correspondence should be addressed to Jianbo Peng; 150511128@stu.sxit.edu.cn

          Received 16 June 2021; Revised 2 August 2021; Accepted 16 August 2021; Published 31 August 2021

          Academic Editor: Gustavo Ramirez

          Copyright © 2021 Jianbo Peng. This is an open access article distributed under the Creative Commons Attribution License, which
          permits unrestricted use, distribution, and reproduction in any medium, provided the original work is properly cited.

          This study aimed to explore the evaluation of Adriamycin-loaded microspheres in the treatment of liver cancer under DenseNet-
          based magnetic resonance imaging (MRI) image classification algorithm. According to different treatment methods, the research
          objects were classified into a normal saline (saline) group, a doxorubicin raw material (DOX) group, and a chitosan cross-linked
          pectin-doxorubicin conjugate macromolecular (CS-PDC-M) group. DenseNet’s migration learning was employed to analyze the
          dynamic enhanced MRI characteristics and classify the MRI images. The CS-PDC-M-targeted nanotransfer system was examined
          with its apparent morphology, drug absorption, and cytotoxicity. Tumor volume was monitored using MRI, and alanine
          aminotransferase (ALT) and creatine kinase isoenzyme (CK-MB) values were detected. Results showed that the classification
          accuracy of liver cancer MRI image based on DenseNet model reached 80% at the arterial hepatobiliary stage. The DOX and CS-
          PDC-M group had obviously smaller tumor volume than that of the saline group (P < 0.05) with a statistical meaning. The
          mortality in the DOX group was 30%, while there was no death in the saline and CS-PDC-M groups. Compared with the saline
          and CS-PDC-M groups, ALT and CK-MB from the DOX group increased substantially (P < 0.05). Therefore, DOX had an
          inhibitory effect on tumor but damaged the heart and liver. DOX was used to construct CS-PDC-M that could maintain the
          original treatment effect of DOX and inhibit its side effects on the body, so CS-PDC-M had a clinical application value. In
          conclusion, Adriamycin-loaded microspheres could not only maintain the original therapeutic effect of Adriamycin but also
          inhibit its toxic and side effects on the body. The DenseNet model was applied in the liver cancer MRI dynamic image clas-
          sification algorithm, and the normalization algorithm could improve the accuracy of the liver cancer microvessel classification,
          thus promoting the diagnostic efficiency of liver cancer diagnosis, which had clinical application value.

1. Introduction                                                        terminal-stage cancer treatment [2] and improves the tumor
                                                                       local drug concentration. What is more, it couples with slow-
Cancer is a disease that seriously harms human health in               release and controlled-release effects to increase the drug
today’s society, and there are 14 million new cancer patients          effect time, so as to play the efficacy of chemotherapy drugs
(782,000 new liver cancer patients) and about 8.2 million              to an extreme. The local drug delivery can reduce the side
deaths (745,000 deaths with liver cancer) worldwide each               and toxic effects of chemotherapy drugs in other tissues of
year [1]. Therefore, high mortality makes wary of scientists           the body, which provides a hope for patients with inter-
in the treatment of cancer research. Although surgical                 mediate and terminal-stage cancer. The interventional
radical treatment is generally preferred in the early stage of         therapy mainly includes renal artery chemoembolization,
cancer, there are no obvious symptoms in the early stage of            tumor microwave ablation, and cryoablation. In recent
cancer, and it cannot be detected in a timely manner. When             years, the cancer treatment research has become a hot topic
a patient is diagnosed with cancer that is mostly at the               due to the rise of molecular biology and the emergence of
middle and late stage, the cancer cells have spread or de-             new theory, technology, and knowledge. Drug-loaded mi-
teriorated, so that the patient cannot be cured by surgery. At         crosphere is a new embolism material, and microsphere
present, interventional therapy is the main method of                  technology has long-term slow-release or targeted effect
2 Scientific Programming
which can greatly improve the convenience and compliance concentrated solution was washed in anhydrous ethanol
of drug delivery for patients. Drug-loaded microsphere is a several times until the liquid supernatant was colorless.
kind of potential dosage form which achieves the remarkable Then, the dark red solid was obtained and freeze-dried to get
curative effect on the malignant tumor treatment of liver the pectin-DOX prodrug. Light should be avoided during
cancer [3]. DOX is one of the antitumor drugs with high the process.
anticancer activity and an effective broad spectrum and The pectin-DOX prodrug was dissolved in the double-
works on a variety of tumors, which belongs to the cycle distilled water under the appropriate pH and temperature.
nonspecific drug. It can destroy a variety of tumor cells that Then, the dissolved solution was poured with 1 mg/mL
grow in the cycles [4–6]. Moreover, DOX (a drug for the chitosan solution at a constant speed, stirred for 8 hours, and
treatment of liver cancer) is widely applied in clinical disease loaded in to a dialysis bag. Besides, it was dialyzed in double-
diagnosis [7, 8], but its side and toxic effects are also high on distilled water for 48 hours to get a CS-PDC-M solution. A
the normal tissues of the body. The main side and toxic effect 0.45 μm filter membrane was used to filter the residue to
is cardiac toxicity, and it can cause heart failure in severe obtain a chitosan cross-linked pectin-DOX nano-
cases. Then, the second is the damage to the medullary microspheres.
hematopoietic function, which reduces the number of
platelets and white blood cells [9–11].
Medical imaging plays an important role in clinical 2.2. Detection of Drug-Loading Capacity and Encapsulation
disease diagnosis [12], and an imaging classification algo- Rate of Doxorubicin Nanoparticle-Loaded Chitosan. In
rithm has good application value in the detection, nature, Section 2.1, anhydrous ethanol included nonencapsulated
positioning, and staging of liver tumor cells [13]. The DOX, which was obtained from washing the pectin-DOX
convolutional neural network (CNN) is a kind of feed- prodrug. After repeated centrifugation, all the liquid su-
forward neural network with deep structure, which contains pernatant was collected and blended. The ultraviolet (UV)
convolution computation. DenseNet, as a kind of CNN with absorption spectrophotometer was employed to detect the
the number of deeper layers, has high computational effi- absorbance of liquid supernatant at the maximum absorp-
ciency and storage efficiency, while greatly reducing the tion wavelength DOX, so as to calculate the content of free
number of network parameters. Thus, the doctor combines DOX. The dose of encapsulated DOX was the difference
the MRI images with clinical symptoms and serum bio- between total and free dose of DOX. The drug-loading
chemical indexes in the daily work, which can increase the capacity (LC%) was the ratio of the amount of encapsulated
accuracy of cancer diagnosis. Interventional treatment of DOX to the mass of the carrier chitosan, and the encap-
liver cancer requires high imaging requirements [14–16] and sulation rate (EE%) was the ratio of the amount of encap-
also determines the formulation of treatment plans and the sulated DOX to the total amount of DOX.
determination of treatment results. With the continuous
development of science and technology, imaging technology 2.3. Characterization Analysis of Doxorubicin Nanoparticle-
is becoming more and more complex, and treatment plans Loaded Chitosan. About 10 μL of CS-PDC-M solution was
and results are becoming more and more sophisticated and pipetted out onto a clean aluminum foil. Then, it was dried
scientific. and sprayed with gold, and the morphology and size of the
The interventional treatment of liver cancer was the nanoparticles were observed under an electron microscope.
research object to prepare the chitosan cross-linked pectin- Dynamic diffusion method was applied to determine the
DOX nano-microspheres that were applied to the tumor drug release of CS-PDC-M in vitro. Specific experiments
cells of mice to investigate its curative effect and adverse were as follows. Hydrochloric acid and Tris buffer salt were
reaction. The results of this study were designed to provide used to prepare buffer solutions with pH 7.4, 6.8, and 5.0.
the theoretical basis for related research of DOX nano- About 2 mL of CS-PDC-M solution was put into a dialysis
microspheres in the clinical treatment of liver cancer. bag, added to a 30 mL buffer solution, and vibrated in a
thermostatic water bath at 37°C. Samples were taken at the
2. Materials and Methods 0th, 2th, 4th, 6th, 8th, 12th, 24th, 48th, 72th, 96th, 120th,
144th, 168th, 192th, 216th, and 240th hours. After sampling,
2.1. Preparation of Doxorubicin-Loaded Chitosan the buffer was changed. The UV absorbance spectropho-
Nanoparticles. About 0.05 g of pectin was added to 25 mL of tometry was adopted to measure the absorbance to draw the
distilled water and dissolved by heating. Then, 5 mg/mL standard curve diagram and calculate the cumulative
sodium hydroxide was added to the aforementioned solu- concentration.
tion to adjust the pondus Hydrogenii (pH) to 5.0. The so-
lution was stirred for 30 minutes and added with 0.06 g of
N-Hydroxysuccinimide (NHS), and then, the mixed solu- 2.4. Cytotoxicity of Doxorubicin Nanoparticle-Loaded
tion was stirred again for 30 minutes. About 0.025 g of DOX Chitosan. The human hepatocellular carcinoma HepG2 cell
hydrochloride was weighed and added to 25 mL of distilled was used as the tumor cell model, and the toxicity of DOX
water to dissolve, so as to prepare a 5 mg/mL DOX hy- preparation on human hepatocellular carcinoma HepG2
drochloride solution. The solution was added to the pectin cells was evaluated by MTT assay. The cells in growth phase
solution and stirred for 48 hours. After the reaction was were collected and counted, and the cell suspension con-
completed, the solution was concentrated to 10 mL. The centration was adjusted. The solution was inoculated on theScientific Programming 3
96-hole cell culture plate with 100 μL per hole, and the channel of medical imaging. Second, with the advantage of
marginal holes were filled with sterile phosphate buffer DenseNet, the network theme adopted DenseBlock to
saline (PBS). The culture plate was placed in an environment construct the flowchart (Figure 1). Finally, a convolutional
with 5% CO2 at 37°C to cultivate for 24 hours. A 10% CS- layer with the size of 1 × 1 × 1 was added at the end of the
PDC-M Dulbecco’s modified Eagle’s medium (DMEM) network to reduce the number of full connections and
culture solution was prepared and taken in an Eppendorf further decrease the risk of network overfitting as shown
(EP) tube with the amount of 3,600 mL. Then, 400 μL of CS- in Figure 2. Finally, the data were processed as follows.
PDC-M solution with 19, 38, 76, 152, and 304 μg/mL was The part of tumor data were for normalization operation,
added into the EP tube. The tube was placed in an incubator all the tumor data with large range difference were
at 30°C with 5% CO2 and taken out at the 24th, 48th, and normalized to 0 to 1, and the equation was expressed as
72th hours. The culture solution was removed, 100 μL of x � (X − min/max − min) ×255. In the aforementioned
0.5 μg/mL MTT solution was added in the tube, and the tube equation, X stood for any pixel value in the tumor of a
was cultured again for 4 hours. Then, liquid supernatant was mouse, min represented the minimum pixel value in the
taken, and the absorbability of each hole was determined by tumor pixel value, and max expressed the maximum pixel
enzyme-labeled instrument to calculate the relative survival value in the tumor pixel value.
rate. The process of image segmentation is as follows: (1)
input liver cancer image; (2) preprocessing of liver cancer
images, adjusting the image size to 126 × 126, and using RGB
2.5. Establishment and Imaging Examination of Liver Cancer
color processing method to adjust the image color; (3) the
Animal Model. The mice bred in the animal Center of XXX
objects of this study were 18 hepatocellular carcinoma
University were selected in this study. Besides, they were
mouse models. A total of 23 hepatocellular carcinoma im-
aged about 6 to 7 weeks and weighed 28 to 33 g, with 12
ages were collected from each mouse, that is, 414 images,
males and 12 females, and fed with 0.5% ethyl methionine.
which were randomly divided into training sets (330 images)
They were administered drugs constantly for 8 to 9 months,
and verification sets (84 images) at a ratio of 4:1; (4) build the
so as to screen out the mice with symptoms of liver cancer as
DenseNet model for image classification and train the model
the experimental animal model. The selected mice were
with the training set image; (5) use the validation set data to
divided into three groups based on the different methods of
train the model validation; (6) the model gives the classi-
liver cancer treatment, namely the saline group (mice were
fication results and compares and analyzes the classification
treated with normal saline), the DOX group (mice were
effect of the model.
given with DOX solution), and the CS-PDC-M group (mice
The process of image segmentation was as follows. First,
were administered with DOX nano-microspheres). The
the liver cancer image was fed for processing. Second, the
experiment was started based on the experimental plan, the
image was preprocessed to adjust the image size to 126 × 126,
operation process was strictly regulated, and the ethical
and the red-green-blue (RGB) color processing method was
requirement was not violated.
applied to adjust the image color. Third, the research objects
GE3.0MR scanner and 8-channel head coil were applied
of this study were 18 liver cancer mice models. Twenty-three
to collect the magnetic resonance scanning parameters (fast-
liver cancer images were collected from each mouse, so the
relaxation fast-spin echo (FRFSE) sequence, repetition time
total was 414 images that were randomly divided into
(TR) � 4600 ms, time of echo (TE) � 107 ms, layer thick-
training sets (330 images) and validation sets (84 images) at a
ness � 2.0 mm, field of view (FOV) � 24 cm × 18 cm, and
ratio of 4:1. Fourth, the DenseNet model was established for
matrix � 448 × 256). After image acquisition, signal intensity
image classification, and the training set image was used for
(SI) of T2-weighted imaging (T2WI) was calculated at
training the model. Fifth, the validation set image was
different reagent doses of AFP-ultrasmall super-
adopted to validate whether the model was trained well.
paramagnetic iron oxide (USPIO) and USPIO (150, 100, and
Sixth, the model produced the classification results, and the
50), and signal-to-noise ratio (SNR) was calculated
classification effect of the model was compared and
(SNR � SI/SIbackground noise ).
analyzed.
2.6. Construction of Image Classification Algorithm for Liver
Cancer Based on DenseNet Model. DenseNet was a con- 2.7. In Vivo Experiments with Doxorubicin-Loaded
volution neural network with deep network levels, which Nanoparticles. The selected tumors were all about 3.5 mm in
was out of deepening the ResNet network layers and in- diameter, and their volume was uniform. There were 18 well-
ception network structure to improve the fixed thinking grown mice (the ratio of male and female was 1:1) and
pattern of network performance. There were the advan- divided evenly into three groups (the saline group, the DOX
tages of DenseNet as follows. It had less number of pa- group, and the CS-PDC-M group). There were 6 mice in
rameters compared with ResNet. The bypass strengthened each group (3 male and 3 female mice). Besides, they re-
the reuse of characteristics, so that the network was easier ceived intravenous injection with the aforementioned
to train. What is more is that it had a reliable regularization preparation every 2 days (0.1 mL of the preparation was
effect to alleviate the gradient vanishing and model deg- injected each time) and were weighed every 2 days. Their
radation. First, the input of the network was designed as a tumor size was measured, and mice were sacrificed at the
single channel based on the characteristics of the single 23th day to calculate the tumor volume.4 Scientific Programming
Start
Input medical image
Preprocessing
Training set Validation set
Model Training
Dense Net model
Output classify result
End
Figure 1: Flowchart of imaging classification.
In Out
Global 4×4Pooling
Pooling 2×2 Pooling
Figure 2: Basic structure of the DenseNet model.
2.8. Statistical Methods. SPSS version 19.0 statistical soft- irregular dispersion state with a diameter of about 200 nm,
ware was used to analyze the research data processing in this which met the quality standards of nano-microspheres.
study, and the measurement data could be expressed as
mean ± standard deviation (x ± s). In addition, count data
were represented by percentage (%). The analysis of variance 3.2. Detection Results of the Drug-Loading Capacity and
was used for pairwise comparison on the cell data of mice Encapsulation Rate of CS-PDC-M. The amount of free DOX
from the saline, DOX, and CS-PDC-M group. P < 0.05 was determined by UV, so as to calculate the drug-loading
meant that the results were statistically significant. Origin, capacity and encapsulation rate of three batches of CS-PDC-
version 7.5, was adopted to construct the graphs. M. The results of drug-loading capacity are shown in
Tables 1 and 2, which indicated the results of encapsulation
rate.
3. Results
3.1. Detection of CS-PDC-M. The surface characteristics of 3.3. Drug Release Analysis of CS-PDC-M In Vitro. The in
CS-PDC-M were observed by scanning electron microscope vitro drug release characteristics of CS-PDC-M were de-
(SEM), as shown in Figure 3. The CS-PDC-M presented tected by dynamic diffusion method. Figure 4 shows theScientific Programming 5
hepatobiliary phase, and different network classification
accuracy affects the classification effect of medical im-
ages. The imaging classification algorithm with higher
accuracy could improve the screening efficiency, reduce
the manpower cost, and decrease the misdiagnosis and
missed diagnosis. Thus, the liver cancer imaging clas-
sification algorithm had good diagnostic efficiency in the
diagnosis of liver cancer.
3.6. Antitumor Effects of CS-PDC-M. Figure 7 indicates the
200nm
change of mice tumor volume during the experiment and the
survival rate of mice. At the 23rd day, the tumor volume of
mice in the saline group was greater than that of CS-PDC-M
Figure 3: The SEM image of CS-PDC-M. group. It was proved that the CS-PDC-M had obvious in-
hibition for the tumor of mice. However, the tumor volume
Table 1: Determination results of drug-loading capacity (n � 3). of mice in the DOX group was obviously smaller than that of
the saline and CS-PDC-M, but several mice of the DOX
Batch Drug-loading capacity RSD (%)
group began to die at the 7th day. Moreover, they started to
P1 21.51 ± 1.33 lose weight at the 10th day, which might be caused by the
P2 22.03 ± 1.13 3.11
serious side and toxic effects of DOX. Thus, it could be
P3 23.05 ± 1.57
concluded that the CS-PDC-M not only had inhibitory effect
on tumor but also reduce its side and toxic effects.
Table 2: Determination results of encapsulation rate (n � 3).
Batch Encapsulation rate RSD (%) 3.7. Effects of CS-PDC-M on Damage of Organs.
P1 53.43 ± 3.12 Anthracycline-based drugs could often lead to cardiac
P2 55.15 ± 2.93 2.21 toxicity. After the treatment effects were compared, clinical
P3 52.74 ± 3.04 biochemical indexes of mice were collected, and the results
are shown in Figure 8. There were increases on ALT and CK-
cumulative release curves of DOX nanotransfer system at MB of mice serum in the DOX group, indicating that DOX
different values of pH. The release rate of CS-PDC-M had damage to the heart and liver at the early phase. Some
nanotransfer system was 68% at the 240th hour, and the mice still died when reducing the dosage; thereby, it sug-
CS-PDC-M nanotransfer system could realize the con- gested that death was not caused by the size of the dose.
trollability of drug release to make blood drug concen- Perhaps, the side and toxic effects of DOX resulted in death.
tration reach a stable level. However, the biochemical indexes of mice were normal in
the CS-PDC-M group, showing that DOX nano-spheres
could reduce the side and toxic effects of DOX on the body.
3.4. Cytotoxicity Experiment of CS-PDC-M In Vitro.
After the N1-S1 cells of all mice were processed, there were 4. Discussion
the flow cytometry detection results of cell necrosis rate in
Figure 5. The fatality rate of mice in the DOX group was 2.86 MRI is a relatively new medical imaging technology and
times that of the saline group, reaching a remarkable level of does not apply the harmful X-ray and hypersensitive con-
difference (P < 0.05). In addition, the fatality rate of mice in trast agents to the body. Furthermore, it can image in any
the DOX group was 2.17 times that of the CS-PFC-M group, direction, and various parameters of the imaging can pro-
showing a statistically extreme difference (P < 0.05). vide more diagnostic information. MRI has high sensitivity
and can fine contrast the differences between various tissues
to achieve the advantages of multifunctional imaging and
3.5. Analysis of Diagnostic Efficiency Based on DenseNet Liver greatly promote the diagnostic efficiency of cancer. There-
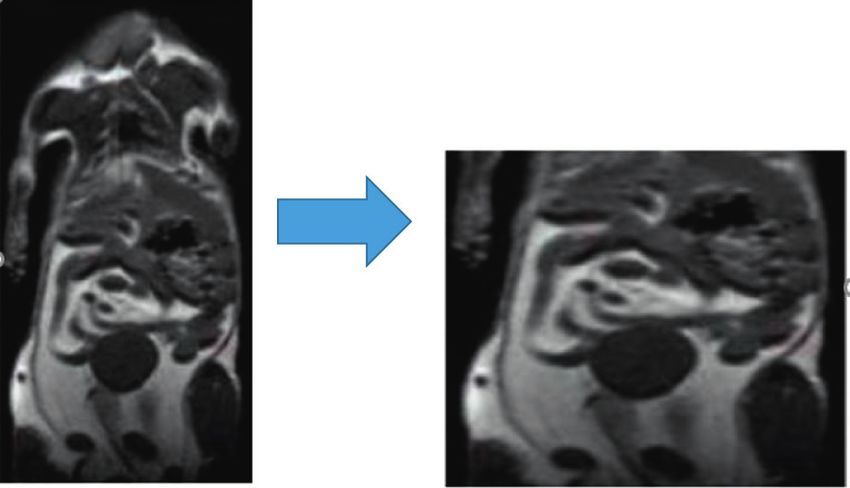
Cancer MRI Image Classification Algorithm. Figure 6 in- fore, MRI is one of the frequently used methods for the
dicates the comparison between the MRI images of clinical detection of liver cancer. At present, a large number
mouse liver cancer before and after the DenseNet model of studies have proved that MRI classification based on
processing, and the images after processing had a high tumor imaging classification algorithm has a high accuracy
resolution. Table 3 reveals the accuracy of training set rate in the treatment of liver cancer [17, 18].
and validation set in detecting microvascular invasion of DOX is an antitumor commonly applied drug in clinical
liver cancer at different periods. The classification ac- disease diagnosis, which can affect the activity of topo-
curacy of the constructed model was 80.05% and 76.51% isomerase II to play an antitumor role in the body. In ad-
in the training set and validation set at the hepatobiliary dition, DOX has toxic effects on peripheral nerves and can
phase, respectively. Therefore, imaging classification damage the heart and liver. Nano preparation is a new type
algorithm had a good classification performance of the of pharmaceutical preparation that is developed by6 Scientific Programming
80
70
Cumulative release (%)
60
50
40
30
20
10
0
0 2 4 6 8 12 24 48 72 96 120 144 168 192 216 240
Time (h)
pH7.4
pH6.8
pH5.0
Figure 4: In vitro release curves of CS-PDC-M under the environment with different values of pH.
80
70 #
60
Necrosis Rate %
50
40 *
30
20
10
0
Saline CS-PDC-M DOX
Figure 5: Statistical chart of cell necrosis rate of mice in each group. Note: ∗ indicated that the difference was statistically obvious compared with
the saline group (P < 0.05); # expressed that there were statistically significant differences in contrast to the CS-PDC-M group (P < 0.05).
Before After
Figure 6: Comparison on the MRI images of mice before and after pretreatment.
Table 3: Classification accuracy of liver cancer images based on DenseNet model.
Training set Validation set
Stage
CNN (%) Our method (%) CNN (%) Our method (%)
Early arterial stage 65.92 75.98 55.87 62.46
Middle arterial stage 63.78 72.55 65.67 72.32
Late arterial stage 61.67 73.78 55.91 62.04
Hepatobiliary stage 71.23 80.05 68.45 76.51Scientific Programming 7
500
450
Cross tumor volume (mm)
400
350
300
250
200
150
100
50
0
0 3 6 9 15 20 23
Medication days (d)
Saline
DOX
CS-PDC-M
Figure 7: Tumor volume changes of mice after administration.
220 3500
200
3000
180 *#
160 2500
CK-MB (U/L)
140
ALT (U/L)
*# 2000
120
100 1500
80
60 1000
40
500
20
0 0
Saline DOX CS-PDC-M
ALT (U/L)
CK-MB (U/L)
Figure 8: Monitoring images of ALT and CK-MB in mice serum of the three groups. Note: ∗ indicated that the difference was statistically
substantial compared to the CS-PDC-M group (P < 0.05); # meant that there was a statistically great difference in contrast to the CS-PDC-M
group (P < 0.05).
nanocarrier technology. By comparing with the traditional What is more, the biochemical indexes of mice were
formulation, it can improve medication compliance, in- compared again. It was found that ALT and CK-MB of mice
crease the local blood drug concentration, enhance drug in the DOX group were much higher than those of the other
curative effect, and effectively decrease side effects. CS-PDC- two groups. Elevation of ALT meant liver damage, and
M was prepared in this study for the investigation of its in growth of CK-MB indicated there was impaired heart
vitro cell toxicity and treatment effect of tumor volume in function of mice. Besides, the biochemical indexes of mice in
mice, the results showed that CS-PDC-M reduced the the CS-PDC-M group tended to be normal, revealing that
toxicity of DOX to the heart and liver during the treatment the CS-PDC-M nanotransfer system could reduce the side
in contrast to the curative effect of traditional formulation. and toxic effects of DOX. It was consistent with the results of
ALT mainly exists in the liver cells, and the liver cells are Wang et al. [19] and Wang et al. [20]. Therefore, CS-PDC-M
seriously damaged when ALT increases. CK-MB is an im- had better application value in interventional therapy of liver
portant marker for the diagnosis of acute myocardial in- cancer.
farction, and CK-MB is released into the blood when the
myocardial tissue is damaged. 5. Conclusion
The tumor volume of mice in the CS-PDC-M group was
smaller obviously than that of the saline group, suggesting The liver cancer imaging classification algorithm could
that DOX had inhibitory effect on tumor cells. However, promote the accuracy of MRI in the diagnosis of liver cancer
mice of the DOX group died earlier than the CS-PDC-M treatment. The application of CS-PDC-M in tumor cells of
group. Some mice still died even when reducing the dosage. mice could effectively inhibit the growth of liver tumor,
Thus, excessive doses of DOX were not suspected to be the reduce the toxicity of DOX to other tissues, and avoid the
cause of death, and its side and toxic effects led to the death. heart and liver injury caused by DOX. The results could be a8 Scientific Programming
reference but could not completely explain that the mech- [11] C. Carvalho, R. X. Santos, S. Cardoso et al., “Doxorubicin: the
anism of CS-PDC-M in this study was completely consistent good, the bad and the ugly effect,” Current Medicinal
with that in the human body based on animal experiments Chemistry, vol. 16, no. 25, pp. 3267–3285, 2009.
and cytotoxic experiments. Therefore, it was necessary to [12] G. Litjens, T. Kooi, B. E. Bejnordi et al., “A survey on deep
learning in medical image analysis,” Medical Image Analysis,
further explore the therapeutic effect of CS-PDC-M in pa-
vol. 42, pp. 60–88, 2017.
tients with liver cancer to investigate its effects of inter-
[13] E. Sagrini, M. Iavarone, F. Stefanini et al., “Imaging of
ventional therapy of liver cancer, so as to better play its combined hepatocellular-cholangiocarcinoma in cirrhosis
clinical application value. This study provides a basis for and risk of false diagnosis of hepatocellular carcinoma,”
future clinical studies on Adriamycin nanoparticles in the United European Gastroenterology Journal, vol. 7, no. 1,
treatment of liver cancer. pp. 69–77, 2019.
[14] L. M. Wang, H. J. Qiao, W. Sun, and Z. Li, “Research on
correlations of magnetic resonance imaging features and
Data Availability pathological changes in liver cancer with Beclin1 expression,”
European Review for Medical and Pharmacological Sciences,
The data used to support the findings of this study are vol. 23, no. 6, pp. 2409–2416, 2019.
available from the corresponding author upon request. [15] S. Li, S. Shi, A. Li, H. Liu, and L. Cai, “Diffusion-weighted
magnetic resonance imaging in assessment of primary liver
cancer after HIFU treatment,” Journal of College of Physicians
Conflicts of Interest and Surgeons Pakistan, vol. 29, no. 4, pp. 305–308, 2019.
The authors declare no conflicts of interest. [16] R. Xu, J. Wang, X. Huang et al., “Clinical value of spectral CT
imaging combined with AFP in identifying liver cancer and
hepatic focal nodular hyperplasia,” Journal of Buon, vol. 24,
References no. 4, pp. 1429–1434, 2019.
[17] T. H. Kim, S. Y. Kim, A. Tang, and J. Lee, “Comparison of
[1] L. A. Torre, F. Bray, R. L. Siegel, J. Ferlay, J. Lortet-Tieulent, international guidelines for noninvasive diagnosis of hepa-
and A. Jemal, “Global cancer statistics, 2012,” CA: A Cancer tocellular carcinoma: 2018 update,” Clinical and Molecular
Journal for Clinicians, vol. 65, no. 2, pp. 87–108, 2015. Hepatology, vol. 25, no. 3, pp. 245–263, 2019.
[2] J. Kettenbach, A. Stadler, I. v. Katzler et al., “Drug-loaded [18] A. Carrillo, J. L. Duerk, J. S. Lewin, and D. Wilson, “Semi-
microspheres for the treatment of liver cancer: review of automatic 3-D image registration as applied to interventional
current results,” CardioVascular and Interventional Radiol- MRI liver cancer treatment,” IEEE Transactions on Medical
ogy, vol. 31, no. 3, pp. 468–476, 2008. Imaging, vol. 19, no. 3, pp. 175–185, 2000.
[3] C. H. Wu, C. H. Lan, K. L. Wu et al., “Hepatocellular car- [19] Q. Wang, L. Gao, X. Zhu et al., “Co-delivery of glycyrrhizin
cinoma-targeted nanoparticles for cancer therapy,” Interna- and doxorubicin by alginate nanogel particles attenuates the
tional Journal of Oncology, vol. 52, no. 2, pp. 389–401, 2018. activation of macrophage and enhances the therapeutic effi-
[4] Y. Liu, L. Liu, Y. Zhou et al., “CKLF1 enhances inflammation- cacy for hepatocellular carcinoma,” Theranostics, vol. 9,
mediated carcinogenesis and prevents doxorubicin-induced no. 21, pp. 6239–6255, 2019.
apoptosis via IL6/STAT3 signaling in HCC,” Clinical Cancer [20] H. Wang, M. Zheng, J. Gao et al., “Uptake and release profiles
Research, vol. 25, no. 13, pp. 4141–4154, 2019. of PEGylated liposomal doxorubicin nanoparticles: a com-
[5] T. Yang, G. Du, Y. Cui et al., “pH-sensitive doxorubicin- prehensive picture based on separate determination of en-
loaded polymeric nanocomplex based on β-cyclodextrin for capsulated and total drug concentrations in tissues of tumor-
liver cancer-targeted therapy,” International Journal of bearing mice,” Talanta, vol. 208, Article ID 120358, 2020.
Nanomedicine, vol. 14, pp. 1997–2010, 2019.
[6] K. T. Brown, R. K. Do, M. Gonen et al., “Randomized trial of
hepatic artery embolization for hepatocellular carcinoma
using doxorubicin-eluting microspheres compared with
embolization with microspheres alone,” Journal of Clinical
Oncology, vol. 34, no. 17, pp. 2046–2053, 2016.
[7] D. Chen, X. Pan, F. Xie et al., “Codelivery of doxorubicin and
elacridar to target both liver cancer cells and stem cells by
polylactide-co-glycolide/d-alpha-tocopherol polyethylene
glycol 1000 succinate nanoparticles,” International Journal of
Nanomedicine, vol. 13, pp. 6855–6870, 2018.
[8] T. Yang, Y. Lan, M. Cao et al., “Glycyrrhetinic acid-conju-
gated polymeric prodrug micelles co-delivered with doxo-
rubicin as combination therapy treatment for liver cancer,”
Colloids and Surfaces B: Biointerfaces, vol. 175, pp. 106–115,
2019.
[9] P. A. J. Speth, Q. G. C. M. Van Hoesel, and C. Haanen,
“Clinical pharmacokinetics of doxorubicin,” Clinical Phar-
macokinetics, vol. 15, no. 1, pp. 15–31, 1988.
[10] K. Renu, V Abilash, and P Tirupathi, “Molecular mechanism
of doxorubicin-induced cardiomyopathy-an update,” Euro-
pean Journal of Pharmacology, vol. 818, pp. 241–253, 2018.You can also read