Comparison of Psychological and Cognitive Characteristics between Professional Internet Game Players and Professional Baseball Players - MDPI
←
→
Page content transcription
If your browser does not render page correctly, please read the page content below
International Journal of
           Environmental Research
           and Public Health

Article
Comparison of Psychological and Cognitive
Characteristics between Professional Internet Game
Players and Professional Baseball Players
Jin Oh Kang 1 , Kyoung Doo Kang 1 , Jea Woog Lee 2 , Jae Jun Nam 3 and Doug Hyun Han 1, *
 1    Department of Psychiatry, College of Medicine, Chung-Ang University, Seoul 06973, Korea;
      kjo88815@naver.com (J.O.K.); cad344@gmail.com (K.D.K.)
 2    Department of Information & Technology in Sport, College of Sport Science, Chung-Ang University,
      Seoul 06974, Korea; yyizeuks@cau.ac.kr
 3    Department of Golf, Korea Golf University, Hoeng Seong, Gang won-do 25247, Korea;
      01197097765@nate.com
 *    Correspondence: hduk70@gmail.com; Tel.: +82-2-6299-3132

 Received: 17 June 2020; Accepted: 1 July 2020; Published: 3 July 2020

 Abstract: The esports industry is increasing in popularity and is now played at the professional level.
 We hypothesized that esports players may have a significant advantage over the general population
 in terms of psychological and cognitive characteristics, which may be similar to that of professional
 baseball players. We recruited three participant groups: esports players (n = 55), pro-baseball
 players (n = 57), and age- and sex-matched healthy comparison subjects (n = 60). We assessed
 psychological status using the Korean versions of Temperament and Character Inventory and State
 and Trait Anxiety Inventory and cognitive functions using the modified Tower of London, Emotional
 Perception, and Mental Rotation tests. Esports players had similar psychological characteristics
 to pro-baseball players (higher novelty seeking [p < 0.01 *, ŋ = 0.818], self-directedness [p < 0.01 *,
 ŋ = 0.757], and self-transcendence scores [p < 0.01 *, ŋ = 0.853], and decreased state anxiety scores
 [p < 0.01 *, ŋ = 0.808]), which differed from those of the general population. However, esports
 players showed higher working memory [p < 0.01 *, ŋ = 0.823] and slower emotional perception than
 pro-baseball players [p < 0.01 *, ŋ = 0.812]. In conclusion, esports and pro-baseball players had similar
 psychological but different cognitive characteristics.

 Keywords: esports players; pro-baseball players; character; temperament; anxiety; cognitive functions

1. Introduction

1.1. Esports Players and Professional Baseball Players
      The worldwide gaming industry is growing daily, and esports are a big part of it. The International
Esports Federation (IeSF) was launched in 2008, and the competition rules and player management
have since been systematized. Since esports are increasing in popularity, they are now played at a
professional level [1]. Esports players are trained systemically in a team, receive an annual salary,
and participate in three–five pro-gaming leagues every year. Each pro-team has one general manager,
two to four coaches, and several other staff members. As esports are now discussed alongside regular
sports, esports players are considered professionals and experts in their field. Recently, esports was
selected as the demonstration competition at the Jakarta Palembang Asian Games of 2018, organized by
the Asian Electronic Sport Federation (AESF). The event was successful and is expected to be adopted
as a formal event at the Hangzhou Asian Games of 2022.

Int. J. Environ. Res. Public Health 2020, 17, 4797; doi:10.3390/ijerph17134797    www.mdpi.com/journal/ijerph
Int. J. Environ. Res. Public Health 2020, 17, 4797 2 of 12
Professional baseball is one of the most representative professional sports in Korea, which as of
2020 has 10 professional baseball teams. Professional baseball players are trained systemically in a
team, receive an annual salary, and participate in one pro-baseball league per year. Each team has two
general managers, 20–30 coaches, 50–60 other managerial staff members, and around 90 players.
Although esports is an officially accepted professional sport, many still feel that esports players
should not be recognized as athletes, believing that esports professionals are no different from amateur
players who just enjoy the game or are simply addicted to gaming [2]. Many research studies on internet
gaming have focused on problematic internet game playing, and only a few clinical studies on internet
gaming were interested in the cognitive effects of internet game playing. Several studies suggested that
the cause of problematic internet game play is associated with psychological characteristics including
temperament [3,4]. Our aim was to qualify esports players as professional sports players in terms of
their psychological and cognitive characteristics by comparing them to the most popular professional
sports players (i.e., professional baseball players).
1.2. Psychological and Cognitive Characteristics of Esports Players and Professional Baseball Players
In studies examining the psychological characteristics of internet gaming players using the
Temperament and Character Inventory (TCI), internet players demonstrated higher scores in novelty
seeking than comparison subjects who did not play internet game [3,4]. However, there have
been no TCI studies of esports players. Esports game play is thought to engage several cognitive
domains including attention, perception and information processing, visuo-spatial working memory,
and hand-eye coordination [5–11]. In addition, emotion regulation during play was reported to be
an essential and necessary skill [12]. Several studies have suggested that esports players also have
excellent working memory abilities [13,14]. Han et al. [13] reported that esports players required fewer
trials and total errors to complete six categories of the Wisconsin Card Sorting Test, a task assessing
cognitive flexibility and task switching. Action video game players could detect changes in objects
faster and recognize the belonging of stimuli to their respective categories earlier, owing to enhanced
perpetual analysis abilities than comparison subjects who did not play internet games [14].
In several studies involving professional sports players, the Korean version of the TCI [15]
and the Korean version of the State-Trait Anxiety Inventory-Y (STAI-KY) were used to describe the
psychological characteristics of athletes such as soccer, baseball, and basketball players [16]. In the
comparison of two groups of national pro-basketball players, Japanese pro-basketball players showed
higher scores of self-directedness and cooperativeness than Korean pro-basketball players [17]. Korean
major league baseball players showed increased scores of novelty seeking and reward dependence
than healthy general people [18]. In addition, the state anxiety scores were negatively correlated with
the novelty seeking scores in the Korean major league baseball players [18]. The anxiety levels of
athletes, which can be measured using the STAI-KY, also have an important effect on performance
decline [19]. The novelty seeking score was thought to be associated with active and challenging
personality traits [15].
In addition to psychological characteristics, the cognitive aspects of athletes can be assessed using
the Tower of London test, the Emotional Perception test, and the Mental Rotation test, which measure
working memory, intuitive perception, and time-space perception ability, respectively. These faculties
are critical in the ability and performance of an individual athlete and many studies have focused on
these three cognitive aspects in athletes [20–22].
1.3. Hypotheses
In the current study, we aimed to qualify esports players as professional sports players in terms of
their psychological and cognitive characteristics. With respect to novelty seeking, we hypothesized
that esports players and professional baseball players might show similar psychological characteristics,
such as high novelty seeking, compared to the general population. We also hypothesized that esports
players would show better working memory than pro-baseball players and the general population.Int. J. Environ. Res. Public Health 2020, 17, 4797 3 of 12
2. Materials and Methods
2.1. Participants
We recruited 55 professional gamers (esports players), 57 professional baseball (pro-baseball)
players, and 60 age- and sex-matched healthy comparison subjects from the general population.
All participants were selected for recruitment by simple random sampling. Upon securing their
permission, we visited professional esports and baseball teams. After explaining the goal and methods
of the study, all players voluntarily consented to participate in the current study.
In May of 2019, all the esports players recruited for this study were on one of two professional
teams in the Korean Esports Association (KeSPA). As these two professional gaming teams did not
want their names to be revealed, we describe them as team A and team B. A total of 55 players (team A,
n = 27; team B, n = 28) agreed to participate in our study.
On team A, there were 12 League of Legends players, eight Overwatch players, and seven
Battleground players. Of the 27 players on team A, seven players attended 85% of the games during the
pro-gaming season and 20 players attended less than 30% of the games. On team B, there were eight
League of Legends players, eight Overwatch players, and 12 StarCraft players. Of the 28 players on
team B, five players attended 82% of the games during the pro-gaming season and 23 players attended
less than 40% of the games. At the beginning of each game season, the head coach selected players;
better players could participate in more games. Accordingly, we defined the elite players (n = 12) as
those who attended more than 80% of the games throughout the entire 2018 season. The other players
were classified into the “general gamer” group (n = 43).
Between November 2018 and February 2019, 57 players on one professional Korea Baseball
Organization (KBO) team agreed to participate in our study. The “elite” group (n = 14) included players
with 446 plate appearances or 144 innings over 144 major league games in the 2018 season (2018 Korean
Baseball Rules, KBO). The others were classified into the “general baseball players” group (n = 43).
Through an advertisement posted online, 60 healthy comparison subjects were recruited.
The inclusion criteria for the healthy comparison subjects were: (1) male gender, (2) age 19–23 years,
(3) no history of playing baseball, and (4) internet gameplay time less than 30 h/week. To rule out
excessive internet game play, we limited internet game playing time (i.e.,Int. J. Environ. Res. Public Health 2020, 17, 4797 4 of 12
Int. J. Environ. Res. Public Health 2020, 17, x 4 of 12
2.2.2.
2.2.2. Assessment
Assessment of
of Neurocognitive
Neurocognitive Function
Function
Neurocognitive functionsin
Neurocognitive functions inall
allparticipants
participantswere
wereassessed
assessed using
using a modified
a modified Tower
Tower of London
of London test
test
(CNT-MBI ®
(CNT-MBI ® , Seoul,
, Seoul, Korea),
Korea), the the Emotional
Emotional Perception
Perception test,test,
andandthe the Mental
Mental Rotation
Rotation test.test.
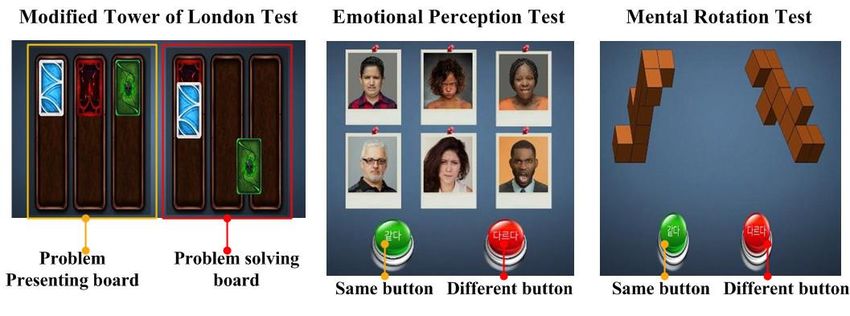
The modifiedTower
The modified Tower of London
of London test used
test was was for
used
the for the assessment
assessment of working ofmemory,
workingparticularly
memory,
particularly to detect deficits in planning [26–28]. It consists of two boards with three
to detect deficits in planning [26–28]. It consists of two boards with three lines and several cards lines and several
of
cards of colors.
different differentThecolors.
computer The uses
computer uses
the cards andthe cards
lines and lines
to present to presentwith
the examinee the problem-solving
examinee with
problem-solving
tasks on the problem tasks on the problem
presenting board. Thepresenting board.
participant moves The theparticipant
cards on the moves the cards on
problem-solving the
board
problem-solving board to match the cards in the same order as presented on the
to match the cards in the same order as presented on the problem presenting board. During the test, problem presenting
board. During
the number the test,
of moves ofthe
thenumber
cards and ofthe
moves of the
reaction cards
time were and the reaction
recorded. time werereliability
The test-retest recorded.ofThethe
test-retest reliability of the modified Tower of London test is 0.87 [26–28] (Figure
modified Tower of London test is 0.87 [26–28] (Figure 1). Faster reaction times and fewer moves in the1). Faster reaction
times
Towerand fewer moves
of London in the Tower
test represent betterofworking
Londonmemory
test represent
[26–28].better working memory [26–28].
Figure 1. Tasks to assess cognitive functions.
Figure 1. Tasks to assess cognitive functions.
The Emotional Perception test consisted of 108 questions, in which two to eight faces were presented
at oneThe
timeEmotional Perception
on the screen. test consisted
The participants were ofasked
108 questions,
to press the in “same”
which two to eight faces
or “different” were
buttons to
presented at one the
indicate whether timefaces
on the screen.
depicted theThe participants
same or differentwere asked to
emotional press the The
expression. “same” or “different”
possible emotional
buttons to indicate
expressions whether
were pleasant, the faces
neutral, depicted theand
and unpleasant, samewereorpresented
different in emotional expression. The
different combinations on
possible
each trial.emotional
During theexpressions
test, the mean were pleasant,
correct rate andneutral,
reactionand unpleasant,
time and were
from presentation presented
of the pictures in
to
different
pushing of combinations
the buttons on each
were trial. During
recorded. the test, the
The test-retest mean correct
reliability rate andface
for emotional reaction time from
identification is
presentation of the pictures to pushing of the buttons were recorded. The
0.93 [29–31] (Figure 1). Faster reaction times and more correct responses in the Emotional Perception test-retest reliability for
emotional
test representfacebetter
identification
emotional is 0.93 [29–31]
perception (Figure 1). Faster reaction times and more correct
[29–31].
responses
In thein the Emotional
Mental Perception
Rotation test, test represent
the computer presentedbetter emotional
a pair perception [29–31].
of three-dimensional (3D) objects, often
In the
rotated on aMental
certainRotation test, the
axis through computer
a specific presented
number ◦
a pair(0of, 60
of degrees ◦ ◦ ◦
three-dimensional
, 90 , 120 , or 180 ◦ ). In
(3D) objects,
some
often
trials,rotated
the twoon 3Da shapes
certain presented
axis through werea specific
the same number of degrees
but rotated, and in (0°, 60°, trials
other 90°, 120°, or 180°).
the shapes wereIn
some trials,
different. Thetheparticipants
two 3D shapes judgedpresented
whetherwere the twothe3Dsame but were
objects rotated,theand
same inorother trialsand
different the pressed
shapes
were different.
the “same” The participants
or “different” button judged whether
to indicate the two 3D
their response. objects
During thewere
test,the
thesame
meanor different
correct rate and
and
pressed
reactionthetime“same” or “different”ofbutton
from presentation to indicate
the pictures their response.
to pushing Duringwere
of the buttons the test, the mean
recorded. correct
Test-retest
rate and reaction
reliability time from
is 0.91 [32–34] presentation
(Figure 1). Fasterofreaction
the pictures
times toandpushing of the responses
more correct buttons were in therecorded.
Mental
Test-retest
Rotation test reliability
represent is better
0.91 [32–34] (Figure 1).abilities
spatio-temporal Faster [32–34].
reaction times and more correct responses in
the Mental Rotation test represent better spatio-temporal abilities [32–34].
2.3. Statistical Analysis
2.3. Statistical Analysis characteristics, psychological characteristics (TCI and anxiety), and neurocognitive
The demographic
functions
The (Tower of London
demographic test, Emotional
characteristics, Perception test,
psychological and the Mental
characteristics Rotation
(TCI and test) amongand
anxiety), the
esports players, pro-baseball players, and healthy comparison subjects were analyzed
neurocognitive functions (Tower of London test, Emotional Perception test, and the Mental Rotation using one-way
analysis
test) of variance.
among To players,
the esports correct for multiple comparisons
pro-baseball players, andon the TCI,
healthy statistical significance
comparison subjects werewas set at p
analyzed
< 0.013 (0.05/4) for the temperament domain (novelty seeking, harm avoidance, reward
using one-way analysis of variance. To correct for multiple comparisons on the TCI, statistical dependence,
persistence) and
significance was at < 0.017
setp at (0.05/3)
p < 0.013 for the
(0.05/4) forcharacter domain (self-directedness,
the temperament domain (noveltycooperativeness,
seeking, harm
self-transcendence).
avoidance, To correct forpersistence)
reward dependence, multiple comparisons
and at pInt. J. Environ. Res. Public Health 2020, 17, 4797 5 of 12
statistical significance was set at p < 0.025 (0.05/2). To correct for multiple comparisons on cognitive
functions (correction rate and reaction time), statistical significance was set at p < 0.025 (0.05/2).
Career years were compared between esports players and pro-baseball players using the
independent t-test. For both esports and professional baseball, the psychological characteristics
and neurocognitive functions were compared between elite players and general players using an
independent t-test. Statistical significance was set at p-value < 0.05.
3. Results
3.1. Demographic Characteristics
There were no significant differences in age or education years between esports players,
pro-baseball players, and healthy comparison subjects. In addition, there was no significant difference
in career years between esports players and pro-baseball players. The esports players group consisted
of 16 Overwatch players, seven Battleground players, 20 League of Legends players, and 12 StarCraft-2
players. The pro-baseball group consisted of 21 infield players, 12 outfield players, and 24 pitchers
(Table 1).
Table 1. Demographic characteristics.
Pro-Gamers (n = 55) Pro-Baseball (n = 57) HC (n = 60) Statistics
Age F = 0.01, p = 0.99,
21.3 ± 1.4 21.3 ± 1.4 21.3 ± 1.5
(mean ± SD) ŋ = 0.004
Education F = 0.51, p = 0.60,
12.1 ± 0.8 11.9 ± 0.2 12.1 ± 1.3
(years) (mean ± SD) ŋ = 0.203
Career t = 0.06, p = 0.95,
3.3 ± 1.1 3.3 ± 1.4 -
(years) (mean ± SD) d < 0.001
Genre/Position Overwatch 16 (29.0) Infield 21 (36.8) -
n(%) BG 7 (12.7) Outfield 12 (21.1) -
LOL 20 (36.4) Pitcher 24 (42.1) -
StarCraft 12 (21.9)
SD: standard deviation; BG: Battleground; LOL: League of Legends; HC: healthy comparison subjects; ŋ: partial
eta-squared, d: Cohen’s d.
3.2. Comparison of Psychological and Cognitive Characteristics between Esports Players, Pro-Baseball Players,
and Healthy Comparison Subjects
In the TCI analysis, there were significant differences in novelty seeking, harm avoidance,
self-directedness, and self-transcendence scores among the three groups. In the post hoc test,
the esports players and pro-baseball players showed higher novelty seeking, self-directedness,
and self-transcendence scores than healthy comparison subjects. Esports players had higher harm
avoidance scores than the pro-baseball and healthy comparison groups (Table 2).
In the anxiety scales, esports players and pro-baseball players showed lower state anxiety scores
than the healthy comparison subjects. However, there were no differences in trait anxiety among the
groups (Table 2).
In the neurocognitive function tests, the esports players showed a faster reaction time in the Tower
of London test and better performance (correct rate) on the Mental Rotation test than the pro-baseball
and healthy comparison groups. In contrast, the pro-baseball group showed faster reaction times on
the Emotional Perception and Mental Rotation tests than the esports players and healthy comparison
subjects (Table 2).Int. J. Environ. Res. Public Health 2020, 17, 4797 6 of 12
Table 2. Psychological and cognitive characteristics of all participants.
Pro-Gamers (n = 55) Pro-Baseball (n = 57) HC (n = 60) Statistics
Psychological Characteristics
Temperament and Characteristics Inventory (Mean± Standard Deviation)
NS *** 21.5 ± 5.4 21.6 ± 4.9 18.7 ± 3.7 F = 8.99, p < 0.01, ŋ = 0.818
HA *** 18.7 ± 6.3 13.9 ± 7.1 14.6 ± 4.9 F = 6.29, p < 0.01, ŋ = 0.759
RD 14.4 ± 4.0 15.1 ± 3.1 15.2 ± 3.2 F = 0.63, p = 0.53, ŋ = 0.239
P 5.0 ± 2.0 5.5 ± 1.7 4.8 ± 1.6 F = 2.89, p = 0.06, ŋ = 0.591
SD ** 24.1 ± 5.9 24.9 ± 4.7 21.8 ± 6.1 F = 6.26, p < 0.01, ŋ = 0.757
C 27.4 ± 4.8 29.2 ± 6.1 27.3 ± 5.5 F = 2.07, p = 0.13, ŋ = 0.509
ST ** 15.6 ± 5.9 15.1 ± 4.9 12.9 ± 5.4 F = 11.69, p < 0.01, ŋ = 0.853
State-Trait Anxiety Inventory-KY (Mean± Standard Deviation)
State * 37.7 ± 9.4 37.2 ± 8.7 42.4 ± 5.6 F = 8.41, p < 0.01, ŋ = 0.808
Trait 39.2 ± 10.2 38.2 ± 10.4 40.8 ± 6.1 F = 1.52, p = 0.22, ŋ = 0.432
Neurocognitive Function Tests
Modified Tower of London (Mean± Standard Deviation)
ToL-RT * 6.7 ± 1.0 8.3 ± 2.1 8.4 ± 1.9 F = 9.31, p < 0.01, ŋ = 0.823
ToL-CR 7.1 ± 0.7 7.1 ± 0.8 7.6 ± 1.1 F = 0.31, p = 0.42, ŋ = 0.134
Emotional Perception (Mean± Standard Deviation)
EP-RT * 4.3 ± 1.2 3.6 ± 0.9 4.5 ± 1.2 F = 8.62, p < 0.01, ŋ = 0.812
EP-CR 80.1 ± 7.1 75.4 ± 10.8 74.9 ± 9.7 F = 2.91, p = 0.06, ŋ = 0.592
Mental Rotation (Mean± Standard Deviation)
MR-RT * 3.6 ± 0.9 2.9 ± 1.2 3.7 ± 1.0 F = 9.67, p < 0.01, ŋ = 0.829
MR-CR * 88.8 ± 4.8 70.1 ± 15.9 70.7 ± 13.9 F = 19.63, p < 0.01, ŋ = 0.907
HC: healthy comparison subjects; NS: novelty seeking; HA: harm avoidance; RD: reward dependence; P: persistence;
SD: self-directedness; C: cooperativeness; ST: self-transference; ToL: modified Tower of London; Korean version
of the State-Trait Anxiety Inventory-Y (STAI-KY), EP: Emotional Perception test; MR: Mental Rotation test;
RT: reaction time; CR: correction rate; ***: statistically significant (0.013); **: statistically significant (0.017);
*: statistically significant (0.025); ŋ: partial eta-squared; Post hoc (p < 0.05); NS: pro-gamers = pro-baseball > HC; HA:
pro-baseball = HC < pro-gamers; SD: pro-gamers = pro-baseball > HC; ST: pro-gamers = pro-baseball > HC; State:
pro-gamers = pro-baseball < HC; ToL-RT: pro-gamers < pro-baseball = HC; EP-RT: pro-baseball < HC = pro-gamers;
MR-RT: pro-baseball < HC = pro-gamers; MR-CR: pro-gamers > pro-baseball = HC.
3.3. Correlation between Psychological and Cognitive Characteristics in Esports Players, Pro-Baseball Players
and Healthy Comparison Subjects
The self-transcendence scores were negatively correlated with reaction times on the Tower of
London test in esports players (r = −0.44, p < 0.01) and with reaction times on the Emotional Perception
test in pro-baseball players (r = −0.47, p < 0.01). There were no significant correlations between
psychological and cognitive characteristics in the healthy comparison group.
3.4. Comparison of Psychological and Cognitive Characteristics between the Elite and General Groups
The elite esports players showed higher novelty seeking, self-directedness, and self-transcendence
scores as well as lower state anxiety scores, faster reaction times on the Tower of London and Emotional
Perception tests, and better performance on the Mental Rotation test than the general esports players
(Table 3). Elite pro-baseball players showed higher scores on novelty seeking, self-directedness,
and self-transcendence as well as lower scores on state anxiety and faster reaction times on the
Emotional Perception and Mental Rotation tests than general pro-baseball players (Table 4).Int. J. Environ. Res. Public Health 2020, 17, 4797 7 of 12
Table 3. Comparison of psychological and cognitive characteristics between elite pro-gamers and
general pro-gamers.
Elite Pro-Gamers (n = 12) General Pro-Gamers (n = 43) Statistics
Psychological Characteristics
Temperament and Characteristics Inventory (Mean± Standard Deviation)
NS *** 27.6 ± 3.1 18.4 ± 3.2 t = 6.00, p < 0.01, d = 2.761
HA 18.0 ± 6.7 19.1 ± 6.2 t = −0.53, p = 0.43, d = 0.170
RD 14.9 ± 3.4 14.1 ± 4.4 t = 0.68, p = 0.49, d = 0.203
P 4.8 ± 2.3 5.2 ± 1.9 t = −1.54, p = 0.13, d = 0.189
SD ** 29.6 ± 3.7 22.6 ± 5.6 t = 3.06, p < 0.01, d = 1.475
C 27.4 ± 3.2 27.4 ± 5.6 t = 0.06, p = 0.82, d < 0.001
ST ** 17.3 ± 5.1 8.4 ± 3.2 t = 4.82, p < 0.01, d = 2.107
State-Trait Anxiety Inventory-KY (Mean± Standard Deviation)
State * 31.1 ± 4.4 41.2 ± 9.6 t = −3.19, p < 0.01, d = 1.353
Trait 39.3 ± 7.1 39.2 ± 11.7 t = 0.08, p = 0.64, d = 0.010
Neurocognitive Function Tests
Modified Tower of London (Mean± Standard Deviation)
ToL-RT * 5.9 ± 0.4 7.1 ± 1.0 t = −3.03, p < 0.01, d = 1.576
ToL-CR 7.1 ± 0.9 7.2 ± 0.6 t = −0.09, p = 0.76, d = 0.131
Emotional Perception (Mean± Standard Deviation)
EP-RT * 3.4 ± 0.8 4.7 ± 1.2 t = −2.08, p = 0.01, d = 1.274
EP-CR 83.1 ± 5.4 78.5 ± 5.6 t = 1.72, p = 0.06, d = 0.836
Mental Rotation (Mean± Standard Deviation)
MR-RT 3.7 ± 0.9 3.6 ± 0.9 t = 0.56, p = 0.48, d = 0.111
MR-CR * 93.0 ± 3.2 86.5 ± 3.9 t = 4.33, p < 0.01, d = 1.822
NS: novelty seeking; HA: harm avoidance; RD: reward dependence; P: persistence; SD: self-directedness; C:
cooperativeness; ST: self-transference; ToL: modified Tower of London; EP: Emotional Perception test; MR: Mental
Rotation test; RT: reaction time; CR: correction rate; ***: statistically significant (0.013); **: statistically significant
(0.017); *: statistically significant (0.025), d: Cohen’s d.
Table 4. Comparison of psychological and cognitive characteristics between elite pro-baseball players
and general pro-baseball players.
Elite Pro-Baseball (n = 14) General Pro-Baseball (n = 43) Statistics
Psychological Characteristics
Temperament and Characteristics Inventory (Mean± Standard Deviation)
NS *** 25.5 ± 4.4 19.9 ± 4.1 t = 3.97, p < 0.01, d = 1.316
HA 14.5 ± 6.4 13.7 ± 7.3 t = 1.22, p = 0.17, d = 0.116
RD 14.4 ± 3.8 15.3 ± 2.9 t = −1.44, p = 0.13, d = 0.266
P 5.3 ± 1.7 5.6 ± 1.7 t = −1.76, p = 0.08, d = 0.176
SD ** 29.9 ± 3.1 23.1 ± 3.8 t = 3.21, p < 0.01, d = 1.961
C 27.3 ± 7.7 29.9 ± 5.4 t = −1.66, p = 0.08, d = 0.391
ST ** 14.8 ± 4.9 11.2 ± 4.2 t = 3.34, p = 0.01, d = 0.788
State-Trait Anxiety Inventory-KY (Mean± Standard Deviation)
State 32.2 ± 6.2 38.9 ± 8.9 t = 2.96, p = 0.03, d = 0.873
Traits 38.8 ± 13.6 38.6 ± 9.3 t = 0.07, p = 0.66, d = 0.069
Neurocognitive Function Tests
Modified Tower of London (Mean± Standard Deviation)
ToL-RT 8.2 ± 1.4 8.4 ± 2.3 t = −1.43, p = 0.14, d = 0.105
ToL-CR 7.5 ± 0.7 7.3 ± 0.9 t = 1.49, p = 0.12, d = 0.248Int. J. Environ. Res. Public Health 2020, 17, 4797 8 of 12
Table 4. Cont.
Elite Pro-Baseball (n = 14) General Pro-Baseball (n = 43) Statistics
Emotional Perception (Mean± Standard Deviation)
EP-RT * 2.9 ± 0.8 3.8 ± 0.8 t = −3.11, p < 0.01, d = 1.125
EP-CR 76.2 ± 11.8 75.2 ± 10.6 t = 1.77, p = 0.08, d = 0.089
Mental Rotation (Mean± Standard Deviation)
MR-RT 2.6 ± 0.8 3.0 ± 1.3 t = 2.97, p = 0.03, d = 0.371
MR-CR 67.8 ± 11.7 70.8 ± 17.1 t = 1.87, p = 0.08, d = 0.205
NS: novelty seeking; HA: harm avoidance; RD: reward dependence; P: persistence; SD: self-directedness; C:
cooperativeness; ST: self-transference; ToL: modified Tower of London; EP: Emotional Perception test; MR: Mental
Rotation test; RT: reaction time; CR: correction rate; ***: statistically significant (0.013); **: statistically significant
(0.017); *: statistically significant (0.025), d: Cohen’s d.
4. Discussion
With respect to psychological characteristics, esports players and pro-baseball players were similar
in their higher levels of novelty seeking, self-directedness, and self-transcendence as well as lower
state anxiety. However, with respect to cognitive characteristics, there were several different trends
between the two groups; esports players showed better executive function and spatio-temporal abilities,
while professional baseball players showed better emotional perception.
4.1. Comparison of Psychological and Cognitive Characteristics between Esports Players, Pro-Baseball Players,
and Healthy Comparison Subjects
Esports players and pro-baseball players showed higher novelty seeking scores than the healthy
comparison group. Therefore, esports players and pro-baseball players are likely exploratory, curious,
and passionate [15,16,35,36]. Novelty seeking is associated with exploratory excitement, openness,
and extraversion as well as a sense of challenge [15,16,35]. People with these temperaments tend
to pursue exciting adventures and enthusiastically search for new and unfamiliar situations. Thus,
they find hidden rewards that others cannot anticipate [35,36]. They may try new things rather than
just adapt to established rules or regulations [35,36], and this tendency can contribute to improving
their gaming or baseball skills.
Furthermore, self-directedness and self-transcendence scores were high among esports and
pro-baseball players. A high self-directedness score indicates great self-control, self-efficacy,
and responsibility as well as a clear sense of purpose [15,16,37]; therefore, players with high
self-directedness scores may be responsible and self-sufficient in their role in many gaming situations.
Meanwhile, people with high self-transcendence have been regarded as patient and creative [15,16,38];
they may also be more likely to endure any ambiguities or uncertainties they face and be willing to
accept failure maturely, even when they gave their best effort but still failed. While others may give up
easily, individuals with a high self-transcendence score are likely to try repeatedly to improve their
skills. These tendencies (high self-directedness and self-transcendence) are probably necessary for
developing gaming skills at the professional level.
Conversely, esports players had significantly higher harm avoidance scores than pro-baseball
players. People with higher harm avoidance scores usually prepare thoroughly when they expect risk,
and this preliminary planning and preparation can help when they do face risks [15,16,39]. We think
that individuals with higher harm avoidance may have “gamer” characters. Indeed, several studies
using the TCI have suggested that internet gamers have higher harm avoidance than the general
population [40]. During game playing, preliminary planning and preparation for battle may be
associated with better performance.
In the STAI-KY, the anxiety traits of esports players were similar to those of the general population,
but their state anxiety was lower, just like pro-baseball players. In other words, there was no significant
difference in the characteristic anxiety they normally felt, but the state anxiety they felt when playingInt. J. Environ. Res. Public Health 2020, 17, 4797 9 of 12
games was lower. These results corroborated with those of our previous studies [16,18,19]. Elite athletes
can control their anxiety during competition, which may lead to better performance. Higher ranking
baseball players show increased brain activation in response to baseball errors, indicating that they
are controlling their anxiety [19]. Esports players and pro-baseball players in particular can control
their own anxiety well in certain situations. This allows them to feel less uneasiness and nervousness,
and thus perform better in season games or other important games, such as rivalry matches or finals,
in front of huge audiences.
In the present study, esports players were significantly faster on the Tower of London test and
performed better on the Mental Rotation test, though there were no differences in the correction rate on
the Tower of London test. This means that esports players may need lesser time to solve problems than
the other groups. The faster reaction times in the Tower of London test in esports players may also
indicate that they have a more economic use of working memory when planning and manipulating
temporarily retained information [20,41]. As esports players are faster than the general population
and also pro-baseball players in this regard, it is likely that working memory is crucial to improve
internet gaming skills. The better performance in the Mental Rotation test suggests that esports players
have excellent spatio-temporal cognitive abilities, and that this ability is important in gaming skills as
well [22,42].
Pro-baseball players performed significantly faster in the Emotional Perception and Mental
Rotation tests. Their faster reaction times in these two tests suggest that they have superior intuitive
perception. We can infer that intuitive perception is a key characteristic to become a professional
baseball player [43].
When considering the correlation between psychological and cognitive characteristics,
high self-transcendence scores were positively correlated with the reaction times on the Tower
of London test in esports players and with the reaction times on the Emotional Perception test in
pro-baseball players. As mentioned above, high self-transcendence can be associated with developing
one’s skills to the professional level, both in esports and baseball [44]. Taken together, these results
suggest that esports players may depend more on the cognitive domain, while professional baseball
players may depend on the emotional (intuitive) domain, when working to improve their skills.
With enhanced cognitive functioning, esports players may be better able to react in response to avatar
or object stimulation while pro-baseball players may be better able to react to human movement.
We speculate that these differences may lead to the improvement of intuitive perception in pro-baseball
players but not in esports players.
4.2. Comparison of Psychological and Cognitive Characteristics between the Elite and General Groups
When comparing the elite and non-elite groups, the elite esports and pro-baseball players showed
higher novelty seeking, self-directedness, and self-transcendence scores than the non-elite groups,
just as the whole esports and pro-baseball groups showed higher scores than the general population.
Likewise, the elite esports players showed lower state anxiety than the non-elite esports players
group, as well as faster reaction times on the Tower of London and Mental Rotation tests, and better
performance on the Mental Rotation test.
Interestingly, the self-transcendence score of the general esports players was lower than that of
the general population. Given the correlation between self-transcendence scores and reaction times on
the Tower of London test in esports players, the self-transcendence score could be a predictive factor
for better performance in working memory in esports play.
Elite pro-baseball players showed faster reaction times on the Emotional Perception test and
Mental Rotation test than the non-elite pro-baseball players. The important psychological and cognitive
characteristics that we identified can be used to distinguish elite from non-elite professionals as well as
professionals from the general population.Int. J. Environ. Res. Public Health 2020, 17, 4797 10 of 12
4.3. Limitations
This study had several limitations. First, the sample size was too small to generalize our findings to
all esports and pro-baseball players. Second, we should consider reporting bias, as the TCI and STAI-KY
data are fundamentally based on self-report questionnaires. Players differ in their self-evaluation
strictness. Further study is needed in this regard. Third, because the current study was a cross-sectional
case control study, we are unable to determine whether the increased abilities of esports players are
intrinsic or learned abilities. Future research should include longitudinal cohort studies to examine the
changes in psychological and cognitive abilities in response to practice in esports players. Together
with current results, a longitudinal study would be able to show the effects of internet game play on
psychological and cognitive changes in internet game users.
5. Conclusions
Like pro-baseball players, esports players should be considered professionals in terms of their
psychological and cognitive abilities. Advanced cognitive functions and well-controlled emotion
regulation in esports players has previously been reported in many studies [5–11]. Current results
replicated and extended those findings by comparing esports players to professional baseball players.
Esports players and pro-baseball players have similar temperament characteristics but different
cognitive characteristics; enhanced cognitive abilities were associated with superior performance
in esports players while enhanced intuitive abilities were associated with superior performance in
pro-baseball players. This intuitive perception was speculated to be unique to becoming an elite
professional baseball player [43].
Author Contributions: Conceptualization, J.O.K. and D.H.H.; methodology, D.H.H., J.J.N., and J.W.L.; formal
analysis, D.H.H.; investigation, K.D.K.; Writing—Original draft preparation, J.O.K., D.H.H.; Writing—Review
and editing, J.J.N. and J.W.L.; supervision, D.H.H. All authors have read and agreed to the published version of
the manuscript.
Funding: This work was supported by the Ministry of Education of the Korea and the National research
Foundation of Korea (NRF-2018S1A5B6070270).
Acknowledgments: Special thanks to Still 8 E-sportainment® .
Conflicts of Interest: The authors declare no conflicts of interest.
References
1. Bányai, F.; Griffiths, M.D.; Király, O.; Demetrovics, Z. The psychology of esports: A systematic literature
review. J. Gambl. Stud. 2019, 35, 351–365. [CrossRef]
2. Peter, S.C.; Li, Q.; Pfund, R.; Whelan, J.P.; Meyers, A.W. Public stigma across addictive behaviors: Casino
gambling, Esports gambling, and internet gaming. J. Gambl. Stud. 2019, 35, 247–259. [CrossRef]
3. Mallorquí-Bagué, N.; Fernández-Aranda, F.; Lozano-Madrid, M.; Granero, R.; Mestre-Bach, G.; Baño, M.;
Pino-Gutiérrez, A.D.; Gómez-Peña, M.; Aymamí, N.; Menchón, J.M.; et al. Internet gaming disorder and
online gambling disorder: Clinical and personality correlates. J. Behav. Addict. 2017, 6, 669–677. [CrossRef]
4. Tonioni, F.; Mazza, M.; Autullo, G.; Pellicano, G.R.; Aceto, P.; Catalano, V.; Marano, G.; Corvino, S.;
Martinelli, D.; Fiumana, V.; et al. Socio-emotional ability, temperament and coping strategies associated with
different use of Internet in Internet addiction. Eur. Rev. Med. Pharmacol. Sci. 2018, 22, 3461–3466.
5. Green, C.S.; Bavelier, D. Action-video-game experience alters the spatial resolution of vision. Psychol. Sci.
2007, 18, 88–94. [CrossRef]
6. Bavelier, D.; Green, C.S.; Pouget, A.; Schrater, P. Brain plasticity through the life span: Learning to learn and
action video games. Annu. Rev. Neurosci. 2012, 35, 391–416. [CrossRef]
7. Bejjanki, V.R.; Zhang, R.; Li, R.; Pouget, A.; Green, C.S.; Lu, Z.-L.; Bavelier, D. Action video game play
facilitates the development of better perceptual templates. Proc. Natl. Acad. Sci. USA 2014, 111, 16961–16966.
[CrossRef]
8. Bediou, B.; Adams, D.M.; Mayer, R.E.; Tipton, E.; Green, C.S.; Bavelier, D. Meta-analysis of action video game
impact on perceptual, attentional, and cognitive skills. Psychol. Bull. 2018, 144, 77–110. [CrossRef]Int. J. Environ. Res. Public Health 2020, 17, 4797 11 of 12
9. Chopin, A.; Bediou, B.; Bavelier, D. Altering perception: The case of action video gaming. Curr. Opin. Psychol.
2019, 29, 168–173. [CrossRef]
10. Torner, H.P.; Carbonell, X.; Castejón, M. A comparative analysis of the processing speed between video game
players and non-players. Aloma 2019, 37, 13–20.
11. Green, C.S.; Bavelier, D. Enumeration versus multiple object tracking: The case of action video game players.
Cognition 2006, 101, 217–245. [CrossRef] [PubMed]
12. Himmelstein, D.; Liu, Y.; Shapiro, J.L. An exploration of mental skills among competitive League of Legend
players. Int. J. Gaming Comput. Mediat. Simul. 2017, 9, 1–21. [CrossRef]
13. Han, D.H.; Lyoo, I.K.; Renshaw, P.F. Differential regional gray matter volumes in patients with on-line game
addiction and professional gamers. J. Psychiatr. Res. 2012, 46, 507–515. [CrossRef] [PubMed]
14. Schenk, S.; Bellebaum, C.; Lech, R.K.; Heinen, R.; Suchan, B. Play to win: Action video game experience and
attention driven perceptual exploration in categorization learning. Front. Psychol. 2020, 11, 933. [CrossRef]
[PubMed]
15. Sung, S.M.; Kim, J.H.; Yang, E.; Abrams, K.Y.; Lyoo, I.K. Reliability and validity of the Korean version of the
temperament and character inventory. Compr. Psychiatry 2002, 43, 235–243. [CrossRef]
16. Han, D.H.; Kim, J.H.; Lee, Y.S.; Joeng Bae, S.; Jin Bae, S.; Kim, H.J.; Sim, M.Y.; Sung, Y.H.; Kyoon Lyoo, I.
Influence of temperament and anxiety on athletic performance. J. Sports Sci. Med. 2006, 5, 381–389.
17. Ha, E.J.; Kang, K.D.; Han, D.H. The comparison of psychological characteristics between Korean and Japanese
women pro-basketball players. Psychiatry Investig. 2019, 16, 524–531. [CrossRef]
18. Kang, K.D.; Han, D.H.; Hannon, J.C.; Hall, M.S.; Choi, J.W. Temperamental predictive factors for success in
Korean professional baseball players. Psychiatry Investig. 2015, 12, 459–465. [CrossRef]
19. Han, D.H.; Kim, B.N.; Cheong, J.H.; Kang, K.D.; Renshaw, P.F. Anxiety and attention shifting in professional
baseball players. Int. J. Sports Med. 2014, 35, 708–713. [CrossRef]
20. Furley, P.A.; Memmert, D. Working memory capacity as controlled attention in tactical decision making.
J. Sport Exerc. Psychol. 2012, 34, 322–344. [CrossRef]
21. Faber, I.R.; Elferink-Gemser, M.T.; Faber, N.R.; Oosterveld, F.G.; Nijhuis-Van der Sanden, M.W. Can
perceptuo-motor skills assessment outcomes in young table tennis players (7–11 years) predict future
competition participation and performance? An observational prospective study. PLoS ONE 2016, 11, e0149037.
22. Notarnicola, A.; Maccagnano, G.; Pesce, V.; Tafuri, S.; Novielli, G.; Moretti, B. Visual-spatial capacity: Gender
and sport differences in young volleyball and tennis athletes and non-athletes. BMC Res. Notes 2014, 7, 57.
[CrossRef]
23. Jiang, N.; Sato, T.; Hara, T.; Takedomi, Y.; Ozaki, I.; Yamada, S. Correlations between trait anxiety, personality
and fatigue: Study based on the temperament and character inventory. J. Psychosom. Res. 2003, 55, 493–500.
[CrossRef]
24. Guillén-Riquelme, A.; Buela-Casal, G. Meta-analysis of group comparison and meta-analysis of reliability
generalization of the State-Trait Anxiety Inventory Questionnaire (STAI). Rev. Esp. Salud. Publ. 2014, 88,
101–112. [CrossRef]
25. Spielberger, C.D.; Gorsuch, R.L.; Lushene, P.R.; Vagg, P.R.; Jacobs, G.A. Manual for the State-Trait Anxiety
Inventory; Consulting Psychologists Press: Palo Alto, CA, USA, 1983.
26. Kaller, C.P.; Debelak, R.; Köstering, L.; Egle, J.; Rahm, B.; Wild, P.S.; Blettner, M.; Beutel, M.E.; Unterrainer, J.M.
Assessing planning ability across the adult life span: Population-representative and age-adjusted reliability
estimates for the Tower of London (TOL-F). Arch. Clin. Neuropsychol. 2016, 31, 148–164. [CrossRef]
27. Köstering, L.; Nitschke, K.; Schumacher, F.K.; Weiller, C.; Kaller, C.P. Test-retest reliability of the Tower of
London planning task (TOL-F). Psychol. Assess. 2015, 27, 925–931. [CrossRef]
28. Van Biesen, D.; Mactavish, J.; McCulloch, K.; Lenaerts, L.; Vanlandewijck, Y.C. Cognitive profile of young
well-trained athletes with intellectual disabilities. Res. Dev. Disabil. 2016, 53–54, 377–390. [CrossRef]
29. Lewis, G.J.; Lefevre, C.E.; Young, A.W. Functional architecture of visual emotion recognition ability: A latent
variable approach. J. Exp. Psychol. Gen. 2016, 145, 589–602. [CrossRef]
30. Shih, Y.L.; Lin, C.Y. The relationship between action anticipation and emotion recognition in athletes of open
skill sports. Cogn. Process. 2016, 17, 259–268. [CrossRef]
31. Weisbuch, M.; Grunberg, R.L.; Slepian, M.L.; Ambady, N. Perceptions of variability in facial emotion influence
beliefs about the stability of psychological characteristics. Emotion 2016, 16, 957–964. [CrossRef]Int. J. Environ. Res. Public Health 2020, 17, 4797 12 of 12
32. Habacha, H.; Lejeune-Poutrain, L.; Margas, N.; Molinaro, C. Effects of the axis of rotation and primordially
solicited limb of high level athletes in a mental rotation task. Hum. Mov. Sci. 2014, 37, 58–68. [CrossRef]
[PubMed]
33. Habacha, H.; Molinaro, C.; Dosseville, F. Effects of gender, imagery ability, and sports practice on the
performance of a mental rotation task. Am. J. Psychol. 2014, 127, 313–323. [CrossRef] [PubMed]
34. Lütke, N.; Lange-Küttner, C. Keeping it in three dimensions: Measuring the development of mental rotation
in children with the Rotated Colour Cube Test (RCCT). Int. J. Dev. Sci. 2015, 9, 95–114. [CrossRef] [PubMed]
35. Gocłowska, M.A.; Ritter, S.M.; Elliot, A.J.; Baas, M. Novelty seeking is linked to openness and extraversion,
and can lead to greater creative performance. J. Pers. 2018, 87, 252–266. [CrossRef]
36. Schweizer, T.S. The psychology of novelty-seeking, creativity and innovation: Neurocognitive aspects within
a work-psychological perspective. Creat. Innov. Manag. 2006, 15, 164–172. [CrossRef]
37. Rodin, J.; Schooler, C.; Schaie, K.W. Self-Directedness: Cause and Effects throughout the Life Course; Psychology
Press: New York, NY, USA, 2013.
38. Levenson, M.R.; Jennings, P.A.; Aldwin, C.M.; Shiraishi, R.W. Self-transcendence: Conceptualization and
measurement. Int. J. Aging Hum. Dev. 2005, 60, 127–143. [CrossRef]
39. Paulus, M.P.; Rogalsky, C.; Simmons, A.; Feinstein, J.S.; Stein, M.B. Increased activation in the right insula
during risk-taking decision making is related to harm avoidance and neuroticism. Neuroimage 2003, 19,
1439–1448. [CrossRef]
40. Weinstein, A.; Lejoyeux, M. New developments on the neurobiological and pharmaco-genetic mechanisms
underlying internet and videogame addiction. Am. J. Addict. 2015, 24, 117–125. [CrossRef]
41. Deary, I.J.; Der, G. Reaction time, age, and cognitive ability: Longitudinal findings from age 16 to 63 years in
representative population samples. Aging Neuropsychol. Cogn. 2005, 12, 187–215. [CrossRef]
42. Achtman, R.L.; Green, C.S.; Bavelier, D. Video games as a tool to train visual skills. Restor. Neurol. Neurosci.
2008, 26, 435–446.
43. Khatri, N.; Ng, H.A. The role of intuition in strategic decision making. Hum. Relat. 2000, 53, 57–86. [CrossRef]
44. Mielke, R.; Bahlke, S. Structure and preferences of fundamental values of young athletes do they differ
from non-athletes and from young people with alternative leisure activities? Int. Rev. Sociol. Sport 1995, 30,
419–436. [CrossRef]
© 2020 by the authors. Licensee MDPI, Basel, Switzerland. This article is an open access
article distributed under the terms and conditions of the Creative Commons Attribution
(CC BY) license (http://creativecommons.org/licenses/by/4.0/).You can also read