Geomapping Vitamin D Status in a Large City and Surrounding Population-Exploring the Impact of Location and Demographics
←
→
Page content transcription
If your browser does not render page correctly, please read the page content below
nutrients
Article
Geomapping Vitamin D Status in a Large City and
Surrounding Population—Exploring the Impact of
Location and Demographics
Helena Scully 1, * , Eamon Laird 2 , Martin Healy 3 , James Bernard Walsh 1 , Vivion Crowley 3
and Kevin McCarroll 1
 1   Mercer’s Institute for Research on Ageing, St. James’s Hospital, Dublin 8, Ireland; jbwalsh@tcd.ie (J.B.W.);
     kmccarroll@stjames.ie (K.M.)
 2   School of Medicine, Trinity College Dublin, Dublin 2, Ireland; Lairdea@tcd.ie
 3   Department of Biochemistry, St James’s Hospital, Dublin 8, Ireland; mhealy@stjames.ie (M.H.);
     vcrowley@stjames.ie (V.C.)
 *   Correspondence: hscully@stjames.ie

 Received: 21 July 2020; Accepted: 27 August 2020; Published: 31 August 2020

 Abstract: Vitamin D status was assessed in a large urban area to compare differences in deficiency
 and to geomap the results. In total, 36,466 participants from 28 geographical areas were identified in
 this cross-sectional, retrospective analysis of general practitioner (GP)-requested 25(OH)D tests at St
 James’s Hospital, Dublin between 2014 and 2018. The population were community-dwelling adults,
 median age 50.7 (18–109 years) with 15% of participants deficient (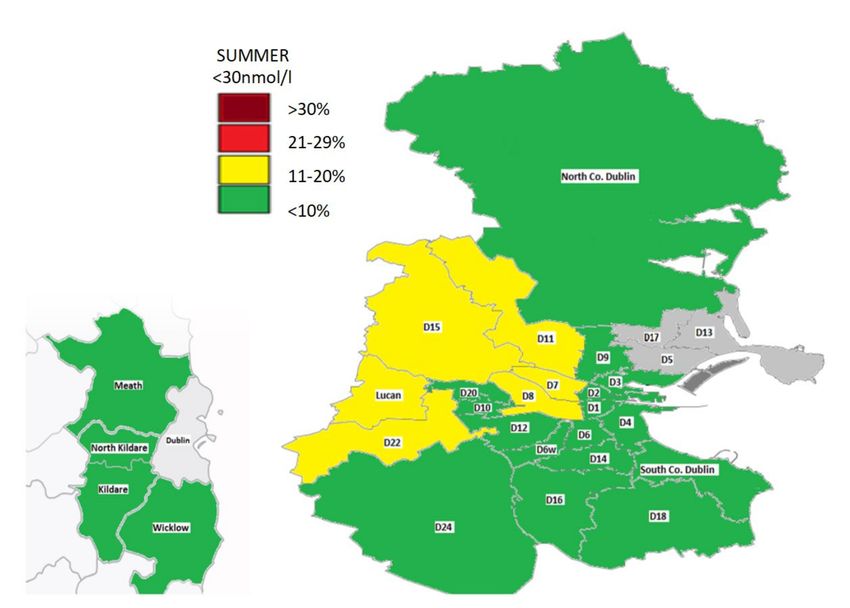
Nutrients 2020, 12, 2663                                                                             2 of 19

skin pigment, obesity, religious dress and age can all affect UVB vitamin D synthesis [2,8]. In locations
greater than 30◦ north or south latitude, a ‘vitamin D winter’ exists between October and March when
little or no vitamin D can be produced due to limited UVB penetration [9]. During this period, we rely
on vitamin D through diet alone though in countries such as Ireland, where there is no mandatory
vitamin D fortification of foods, it is difficult to reach the recommended daily intake (10 µg/day)
as sources in the diet (such as oily fish) are limited or are often not consumed [10]. As a result, a
significant proportion of the population is at risk of deficiency (25-hydroxyvitamin D {25(OH)D <
30 nmol/L}) [11]. In particular, those most at risk include indoor or night-shift workers [12], housebound
or noncommunity dwellers [13] or the elderly with reduced capacity for cutaneous synthesis [14].
       It is difficult to compare studies of vitamin D status as they involve different populations and
thresholds for defining deficiency. In Ireland, the National Adult Nutrition Survey (n = 1132) found
that 21% of 18–84-year-olds were deficient (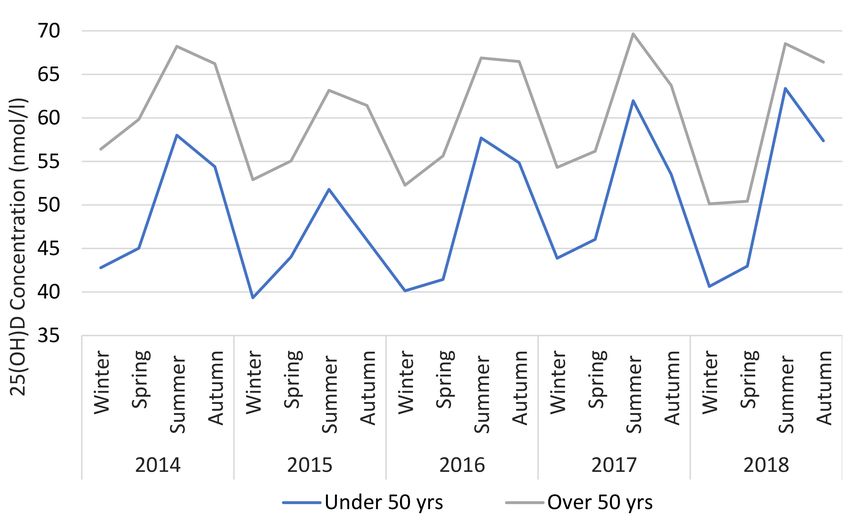
Nutrients 2020, 12, 2663                                                                           3 of 19

north or south. County Dublin was also categorised into three main areas: North Dublin (D1, D3, D5,
D7, D9, D11, D13/17, North County Dublin); south Dublin (D2, D4, D6/6W, D8, D10, D12, D14/16, D18,
south County Dublin); west Dublin (D15, D20, D22, D24, Lucan). County Kildare was split into north
(including the towns of Leixlip, Maynooth, Celbridge and Kilcock) and rest of Kildare. Residents in
Counties Meath and Wicklow were also designated separately. Participants living in the province of
Leinster (but not in Dublin or adjacent counties of Meath, Kildare and Wicklow) were classified as ‘rest
of Leinster’. Those residing outside of the above locations were categorised as ‘rest of Ireland’.

2.2. Ethics
     The joint research ethics committee at St James’s Hospital/Tallaght University Hospital (SJH/TUH)
granted ethical approval for this study (Ref: 5475) which was conducted according to the guidelines
laid down in the Declaration of Helsinki 1964.

2.3. Serum 25(OH)D Measurement
      The nutritional marker of vitamin D status, serum concentration of 25(OH)D (total 25(OH)D2
and 25(OH)D3), was quantified by liquid chromatography-tandem mass spectrometry (LC-MS/MS)
(API 4000; AB SCIEX) using a fully validated method (Chromsystems Instruments and Chemicals
GmbH, Gräfelfing, Germany MassChrom 25-OH-Vitamin D3/D2) at the Biochemistry Department of
SJH, which is fully accredited to ISO 15189:2012 standard. Quality is monitored by assay of internal
quality controls, participation in the Vitamin D External Quality Assessment Scheme (DEQAS) and
the utilisation of the National Institute of Standards and Technology (NIST) 972 25(OH)D standard
reference material (SRM 972) to determine accuracy. The limit of quantification was 9 nmol/L, with
values below this assigned as 9 nmol/L. The respective inter-and intra- assay coefficients of variation
are 5.7% and 4.5%.
      There is a lack of agreement as to what constitutes vitamin D deficiency or suboptimal vitamin D
status [20,21]. The Institute of Medicine (IOM) defines risk of deficiency at as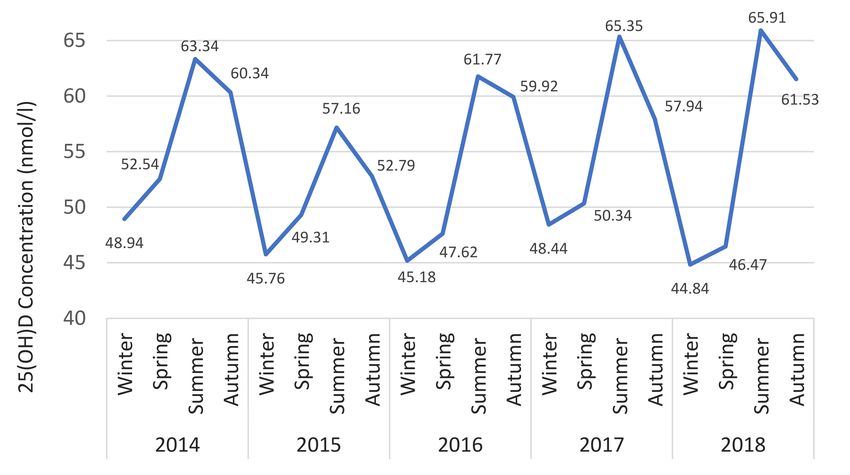
Nutrients 2020, 12, 2663                                                                        4 of 19

     An ANOVA analysis was used to identify mean differences in 25(OH)D between areas in the
winter and summer (see Appendix A), and cluster maps were created. These depict differences between
25(OH)D across several areas, categorised with equal distribution based on median values for winter
(20 nmol/L) and summer (10 nmol/L).

3. Results

3.1. Demographics
      There were 51,651 serum 25(OH)D results reported to primary care GPs between 2014 and 2018,
of which 36,466 (70.6%) met the inclusion criteria (Figure 1). The population and area demographics
are shown in the respective Tables 1 and 2. There was a relatively even distribution of samples across
all seasons. The median age was 50.7 years, ranging from 18 to 109 years. We sampled 28 areas, with
requests from County Dublin and Kildare comprising the majority (97%). Approximately 15 areas had
25(OH)D results for at least 500 people, Dublin 13/17 being the smallest (n = 107) and north Kildare
the largest (n = 5734). Those in Dublin 1 were the youngest (35.9 ± 11.6 years) with 88% aged under
50 years, while those in Dublin 20 were the oldest (57.8 ± 17.5 years). The majority of requests (72%)
were for females. This varied by location, ranging from 64% in Dublin 20 to 80% in Dublin 3.

                                 Figure 1. Recruitment Flow Diagram.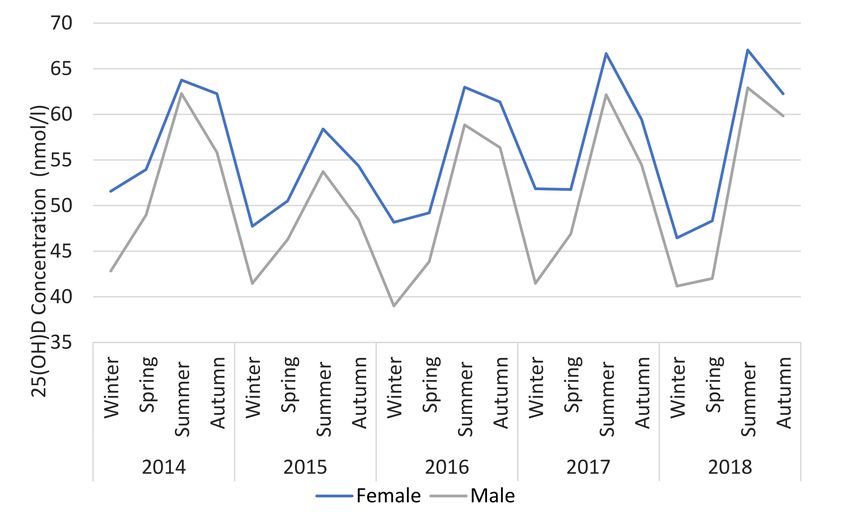
Nutrients 2020, 12, 2663                                                                                       5 of 19

                                                Table 1. Demographics.

                    Demographics                                        N           %     GM Mean (SD)
                Age Category (years)              18–39               11,319        31         47.8 (30.8)
                                                  40–49                6977         19         50.3 (28.5)
                                                  50–59                6328         17         56.5 (29.9)
                                                  60–69                5753         16         62.1 (30.0)
                                                  70–79                3865         11         61.7 (31.8)
                                                  80–89                2003         5           58.1 (33.0)
                                                   >90                  221         1          54.1 (33.7)
                 Age groups (years)                50                17,525        48         59.7 (30.8)
                            Area              North Dublin             1758         5          50.8 (30.9)
                                              South Dublin            18,827        52         54.5 (31.7)
                                              West Dublin              8310         23         50.6 (30.3)
                                             Outside Dublin            7571         21         55.8 (29.5)
                           Season                Winter                8101         22         46.8 (30.3)
                                                 Spring               10,321        28         48.9 (30.4)
                                                Summer                 9353         26         58.6 (30.5)
                                                Autumn                 8691         24         63.0 (29.4)
                           Gender                 Male                10,335        28         49.7 (29.0)
                                                 Female                 261         72         55.1 (31.3)
                            Total                                     36,466                   53.8 (30.78)

                                             Table 2. Area Demographics.

                     Area                N           GM Mean (SD)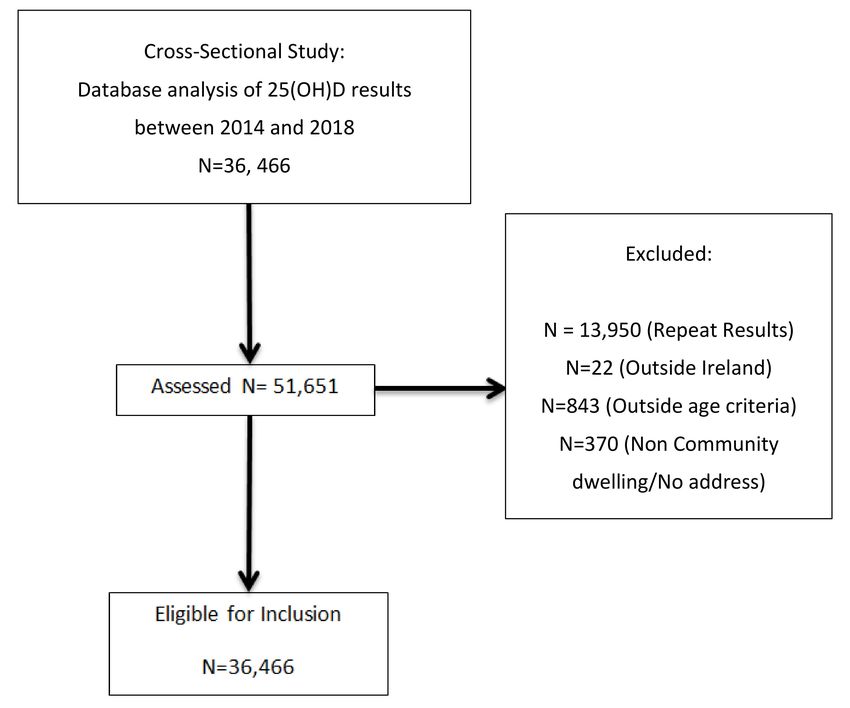
Nutrients 2020, 12, 2663                                                                                                                      6 of 19

     The 25(OH)D geometric mean was lowest in winter (46.8 ± 30.3 nmol/L) and highest in autumn
(63.0 ± 29.4 nmol/L) versus spring (48.9 ± 30.4 nmol/L) or summer (58.6 ± 30.5 nmol/L). Females had
higher 25(OH)D versus males (55.1 ± 31.3 nmol/L vs. 49.7 ± 29.0 nmol/L, p < 0.001).

3.2. 25(OH)D Status by Year, Age and Gender
     The 25(OH)D status over the five-year period is shown in Table 3, with the proportion in each
category (deficient, insufficient and >125 nmol/L) split by age and gender. Overall, there was a 58%
increase in vitamin D testing from 2014 to 2018. The proportion who were deficient, insufficient and
who had 25(OH)D >125 nmol/L was relatively stable over time at 15%, 23% and 3% respectively. When
dichotomised by age, we found that those
Nutrients 2020, 12, 2663 7 of 19
3.3. (OH)D Status by Area—Effect of Season
The prevalence of deficiency and insufficiency is shown for each area and categorised by season
(see Table 4). Deficiency was greatest in winter at 23%, with a further 26% insufficient. In contrast,
deficiency was lowest in summer at 8%, with an additional 16% insufficient. The locations with the
lowest 25(OH)D were; Dublin 1 (45.5 ± 31.4 nmol/L), Dublin 11 (46.1 ± 27.3 nmol/L), Lucan (46.5 ± 30.8
nmol/L) and Dublin 8 (49.1 ± 31.9 nmol/L). The locations with the highest 25(OH)D were Dublin 14/16
(59.9 ± 30.8 nmol/L), Dublin 4 (58.8 ± 33.0 nmol/L), Dublin 6/6W (58.6 ± 31.1 nmol/L).
Table 4. 25(OH)D status by area and season.
GM Mean Winter Spring Summer Autumn
General Area N
(SD) nNutrients 2020, 12, 2663 8 of 19
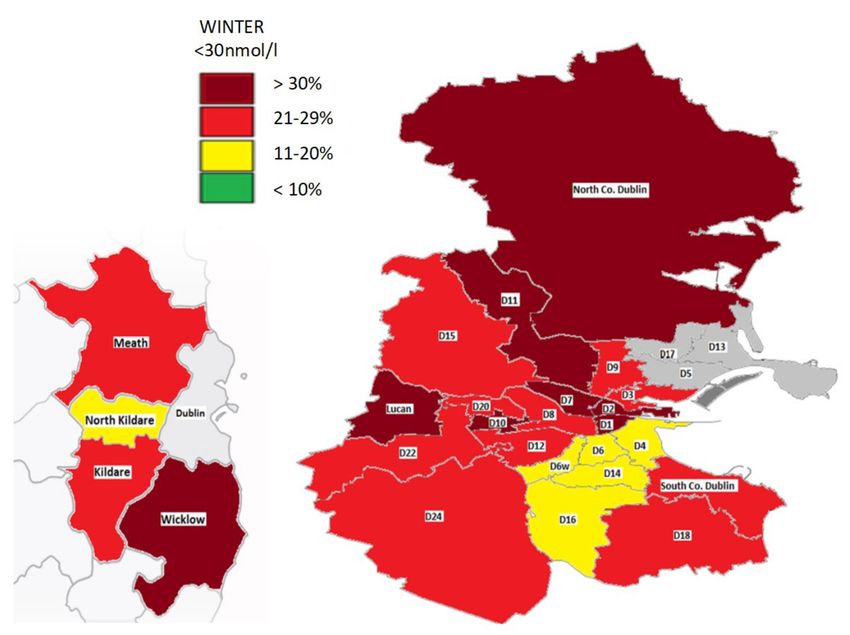
Figure 3. Geomap of 25(OH)D status in Dublin and surrounding counties in winter. Areas with
insufficient numbers (Nutrients 2020, 12, 2663 9 of 19
3.4. 25(OH)D Status by Area—Age and Gender
There were significant differences in 25(OH)D status when dichotomised by age across the areas
(Table 5). In every area, deficiency was more prevalent in those who were younger (Nutrients 2020, 12, 2663 10 of 19 Table 6. Predictors of vitamin D deficiency
Nutrients 2020, 12, 2663                                                                         11 of 19

                           Figure 6. 25(OH)D status versus season, dichotomised by gender.

                            Figure 7. 25(OH)D status versus season, dichotomised by age.

3.7. Cluster Analysis of Differences in 25(OH)D between Areas (See Supplementary Data and Figures)
    Cluster maps of postcodes with significant mean differences in 25(OH)D in the winter (Figure S1)
and summer (Figure S2) were created. There were more areas with significant mean differences in the
winter (Table S1 and S2). In winter, higher mean 25(OH)D were identified in the areas (D4, D6/6W,
D14/16) with significantly lower levels in central (D1, D2, D8), west (D10, D22, Lucan) and north
Nutrients 2020, 12, 2663 12 of 19
Dublin (North Co. Dublin, D11). In summer, the areas D4, D6/6W and D14/16 had higher status versus
Dublin city and west Dublin. Finally, North Kildare had a higher 25(OH)D in the summer compared
with the areas of Lucan and Dublin 8 and this also remained the case versus Lucan in the winter.
4. Discussion
To our knowledge this is the largest geomapping study of vitamin D status in Europe. We observed
that nearly one in six (15%) of a GP primary care tested-population in Dublin and surrounding areas
were vitamin D deficient, rising to one in four (23%) in the winter. Furthermore, an additional 26%
were insufficient (30–49 nmol/L), with nearly half of those tested having 25(OH)D levelsNutrients 2020, 12, 2663 13 of 19
might also contribute to other adverse health outcomes as consistent with the theory of ‘long latency
deficiency disease’ [37]. For example, vitamin D deficiency has been associated with upregulation
of inflammatory markers, endothelial dysfunction and chronic, low-grade inflammation that may
increase the risk of cardiovascular disease as well as mortality from cancer and other causes [38,39].
Our findings demonstrate that 25(OH)D peaked in the decade 60–69 years in which most people
retire and may reflect more time spent outdoors [40]. Conversely, 25(OH)D levels declined from the
age of 70 onwards. This may largely relate to increasing frailty and less sunshine exposure. However,
reduction in the capacity of the skin to synthesize vitamin D by up to 75% with age may also help to
explain this [41]. In addition, sequestration of vitamin D within increased body fat with ageing as
well as reduced dietary intake may contribute [42]. Furthermore, poor compliance with vitamin D
supplements in older adults, especially in those where there is polypharmacy may also be a factor [43].
4.3. Vitamin D Status by Season and Location
A geomap depicting 25(OH)D status in Dublin and the surrounding areas illustrates major
variations in the prevalence of deficiency by location. This varied greatly especially in the winter,
where it ranged from 18% in areas like Dublin 14/16 and North Co. Kildare to up to >37% in Dublin 1
and Dublin 11. Findings were similar to a previous geomapping study of Vitamin D status in Dublin,
although that study focused on a substantially smaller population, did not include as many areas and
only covered a one year period [19].
In the winter, we found clusters of areas south Dublin (D4, D6/6W, D14/16) with greater serum
25(OH)D compared to west Dublin, north Dublin and more central Dublin city areas. In fact, these
particular locations in south Dublin are some of the most affluent areas in the county and nationally, as
determined by HP (Haase-Pratschke) Pobal Score 2016, a deprivation index of demographic profile,
social class composition and labour market situation [44]. Socioeconomic status and 25(OH)D have been
closely linked, with those in typically disadvantaged areas having an increased risk of deficiency [18,45].
For example, in the TILDA study of Irish adults, those with lower asset wealth were 1.5-times more
likely to be deficient. This may be due to factors linked to lower socioeconomic status including
reduced dietary vitamin D intake, less sunny holiday travel and possibly higher rates of obesity and
smoking [14,46].
In the summer, most areas had a prevalence of deficiency of less than 10% except locations such as
north and west Dublin including Lucan. This may be in part accounted for by a greater proportion of
individuals of Asian and Black ethnicity living here [47]. Indeed, those with darker or more pigmented
skin have a greater risk of deficiency at locations in northern latitudes [26]. However, overall season
had a large impact on 25(OH)D in keeping with those in the winter being over four-times more likely
to be deficient versus in the summer [22,48]. Importantly, the extent of the differences in deficiency
between areas appeared to be attenuated in the summer, highlighting the importance of sun exposure.
Those living in the areas of north and west Dublin were also more likely to be deficient compared
to those living outside Dublin. While we did not define rural or urban areas, locations outside Dublin
are less urbanised and some are rural. These findings are in contrast to a study by Griffin et al., 2019,
which found that Irish urban dwellers had higher 25(OH)D and lower rates of deficiency [15]. However,
these differences might be accounted for by local variations in socioeconomic status and ethnicity.
There was no improvement in vitamin D status over a five-year period despite increased testing
and greater awareness [1]. This suggests that a large proportion of the population have inadequate
25(OH)D but have not yet been identified. As the list of potential comorbidities related to vitamin D
expands beyond bone and muscle health, it is important that no subgroup of the population is left
vulnerable to deficiency. For example, vitamin D may help to maintain immune function, reduce the
risk of respiratory infections and downregulate inflammatory cytokines, suggesting that deficiency
could have a negative impact on Covid-19 outcomes [40,49]. Furthermore, vitamin D is a known
regulator of cardiovascular and renal function mediated via the interaction of Vitamin D receptorsNutrients 2020, 12, 2663 14 of 19
within the renin-angiotensin-aldosterone system (RAAS), highlighting the multisystemic effects of
vitamin D deficiency [50].
We did find that a small (1–7%) but not insignificant proportion of our study population had
25(OH)D levels >125 nmol/L, particularly females over 50 who may be more likely to take prescribed or
over-the-counter vitamin D. While a similar prevalence (>125 nmol/L) has been identified elsewhere [22],
it is important that any future Irish guidance on vitamin D intake takes into account the potential for
inadvertently increasing the risk of hypervitaminosis D.
There are no national Irish guidelines regarding vitamin D testing, and recommendations for
supplementation are limited to infants. This study highlights the presence of vulnerable groups
with vitamin D deficiency, including males and young adults, living in poorer socioeconomic areas.
Furthermore, our geomap and cluster analysis highlights locations where the prevalence of deficiency
is significantly higher. These findings provide valuable information for GPs and public health bodies
in developing strategies for targeted interventions to optimise vitamin D status.
4.4. Strengths of Study
The primary strength of this study was its large population size and the novel use of a geomap to
gain a visual representation of vitamin D status in a large city and its surrounding areas. In fact, to
our knowledge, this is the largest study in Europe to geomap vitamin D and includes data collected
over a 5-year period. We used the gold standard for vitamin D assessment; LC-MS/MS, NIST internal
standard and are DEQAS accredited to ensure accuracy.
4.5. Limitations of Study
Our study was based on GP vitamin D requests and this limits the generalisability of the findings
to a wider population. In particular, there is likely to be selection bias in testing with study participants
having medical conditions or other factors putting them at risk of deficiency. However, unlike other
studies we minimised the potential for this by not including vitamin D samples received from outpatient
or acute hospital services and also excluded those from institutionalised adults.
We were not able to adjust for several factors that influence 25(OH)D including biophysical (BMI,
skin type, medical conditions e.g., malabsorption syndromes) and lifestyle (supplementation, smoking,
sun exposure, alcohol intake, diet, education). Finally, our study was cross-sectional and therefore we
could not make any direct inferences as to the causality of factors influencing vitamin D status.
5. Conclusions
This study shows that nearly one in four of the GP-tested population in Dublin and surrounding
areas are vitamin D deficient in the winter, during which time up to 50% have 25(OH)D less than
50 nmol/L. Moreover, those living in poorer socioeconomic areas were more likely to be deficient, as
are males, younger (18–39 years) and older adults (80+ years). This study identifies key groups at
risk of vitamin D deficiency and provides important public health information for the targeting of
interventions to optimise vitamin D status. Our data indicate that inadequate vitamin D status is
not just limited to older adults, but it is widespread across many population groups. This highlights
the importance for recommendations for vitamin D intake to include the entire population and/or
mandatory vitamin D food fortification.
Supplementary Materials: The following are available online at http://www.mdpi.com/2072-6643/12/9/2663/s1,
Figure S1: Cluster map analysis in winter, Figure S2: Cluster map analysis in summer, Table S1: Condensed
Pairwise ANOVA Winter. All mean difference is significant at theNutrients 2020, 12, 2663 15 of 19
Funding: This research is partially funded by Mercers’ Institute and Glanbia Ireland. The funders have no role in
study design, data collection and analysis, or interpretation of data; in the writing of the manuscript, or in the
decision to publish the results.
Conflicts of Interest: The authors declare no conflict of interest.
Appendix A
Table A1. Pairwise ANOVA Winter.
95% Confidence Interval
General Area General Area Mean (SE) Sig.
Lower Upper
Dublin 1 Dublin 4 −19.3 (4.3) 0.003 −35.7 −2.8
Dublin 6/6W −15.6 (3.6) 0.004 −29.2 −2.0
Dublin 14/16 −17.2 (3.6) 0.001 −30.8 −3.5
Dublin 2 Dublin 14/16 −10.8 (2.6) 0.011 −20.7 −0.9
Dublin 4 Dublin 1 19.3 (4.3) 0.003 2.7 35.7
Dublin 10 15.1 (3.5) 0.006 1.8 28.3
Dublin 11 25.9 (5.8) 0.004 3.6 48.2
North Co. Dublin 21.8 (5.2) 0.011 1.8 41.7
Lucan, Co. Dublin 13.9 (2.7)Nutrients 2020, 12, 2663 16 of 19
Table A2. Pairwise ANOVA Summer.
95% Confidence Interval
General Area General Area Mean (SE) Sig.
Lower Upper
Dublin 2 Dublin 14/16 −12.0 (2.6) 0.001 −21.7 −2.2
Dublin 4 Dublin 8 9.8 (2.5) 0.033 0.3 19.3
Lucan, Co. Dublin 13.2 (2.4)Nutrients 2020, 12, 2663 17 of 19
7. Yin, L.; Ordóñez-Mena, J.M.; Chen, T.; Schöttker, B.; Arndt, V.; Brenner, H. Circulating 25-hydroxyvitamin
D serum concentration and total cancer incidence and mortality: A systematic review and meta-analysis.
Prev. Med. 2013, 57, 753–764. [CrossRef]
8. Laird, E.; Ward, M.; McSorley, E.; Strain, J.J.; Wallace, J.M.W. Vitamin D and Bone Health; Potential
Mechanisms. Nutrients 2010, 2, 693–724. [CrossRef]
9. Holick, M.F. Vitamin D: A millenium perspective. J. Cell. Biochem. 2002, 88, 296–307. [CrossRef]
10. Cashman, K.D.; Muldowney, S.; McNulty, B.; Nugent, A.; Fitzgerald, A.P.; Kiely, M.E.; Walton, J.; Gibney, M.;
Flynn, A. Vitamin D status of Irish adults: findings from the National Adult Nutrition Survey. Br. J. Nutr.
2012, 109, 1248–1256. [CrossRef]
11. Institute of Medicine (IOM). Dietary Reference Intakes for Calcium and Vitamin D; The National Academies
Press: Washington, DC, USA, 2011.
12. Sowah, D.; Fan, X.; Dennett, L.; Hagtvedt, R.; Straube, S. Vitamin D levels and deficiency with different
occupations: a systematic review. BMC Public Health 2017, 17, 519. [CrossRef]
13. Griffin, T.P.; Wall, D.; Blake, L.; Griffin, D.G.; Robinson, S.M.; Bell, M.; Mulkerrin, E.C.; O’Shea, P.M. Vitamin
D Status of Adults in the Community, in Outpatient Clinics, in Hospital, and in Nursing Homes in the West
of Ireland. J. Gerontol. Ser. A Biol. Sci. Med Sci. 2020. [CrossRef]
14. Laird, E.; O’Halloran, A.; Carey, D.; Healy, M.; O’Connor, D.; Moore, P.; Shannon, T.; Molloy, A.M.; Kenny, R.A.
The Prevalence of Vitamin D Deficiency and the Determinants of 25(OH)D Concentration in Older Irish
Adults: Data from The Irish Longitudinal Study on Ageing (TILDA). J. Gerontol. Ser. A: Biol. Sci. Med Sci.
2017, 73, 519–525. [CrossRef] [PubMed]
15. Griffin, T.P.; Wall, D.; Blake, L.; Griffin, D.G.; Robinson, S.; Bell, M.; Mulkerrin, E.C.; O’Shea, P.M. Higher risk
of vitamin D insufficiency/deficiency for rural than urban dwellers. J. Steroid Biochem. Mol. Biol. 2020, 197,
105547. [CrossRef] [PubMed]
16. McCarroll, K.; Beirne, A.; Casey, M.; McNulty, H.; Ward, M.; Hoey, L.; Molloy, A.M.; Laird, E.; Healy, M.;
Strain, J.J.; et al. Determinants of 25-hydroxyvitamin D in older Irish adults. Age Ageing 2015, 44, 847–853.
[CrossRef] [PubMed]
17. González-Gross, M.; Valtueña, J.; Breidenassel, C.; Moreno, L.A.; Ferrari, M.; Kersting, M.; De Henauw, S.;
Gottrand, F.; Azzini, E.; Widhalm, K.; et al. Vitamin D status among adolescents in Europe: the Healthy
Lifestyle in Europe by Nutrition in Adolescence study. Br. J. Nutr. 2011, 107, 755–764. [CrossRef] [PubMed]
18. Naugler, C.; Zhang, J.; Henne, D.; Woods, P.; Hemmelgarn, B.R. Association of vitamin D status
with socio-demographic factors in Calgary, Alberta: An ecological study using Census Canada data.
BMC Public Health 2013, 13, 316. [CrossRef]
19. Laird, E.; Shannon, T.; Crowley, V.E.F.; Healy, M. The benefits of utilising geo-mapping for visualising the
vitamin D status of Dublin city and the surrounding urban districts. Ir. J. Med Sci. 2016, 186, 807–813.
[CrossRef]
20. Spiro, A.; Buttriss, J.L. Vitamin D: An overview of vitamin D status and intake in Europe. Nutr. Bull. 2014,
39, 322–350. [CrossRef]
21. Hilger, J.; Friedel, A.; Herr, R.; Rausch, T.; Roos, F.; Wahl, D.A.; Pierroz, D.D.; Weber, P.; Hoffmann, K.
A systematic review of vitamin D status in populations worldwide. Br. J. Nutr. 2013, 111, 23–24. [CrossRef]
22. McKenna, M.J.; Murray, B.; Crowley, R.K.; Twomey, P.J.; Kilbane, M. Laboratory trend in vitamin D status
in Ireland: Dual concerns about low and high 25OHD. J. Steroid Biochem. Mol. Biol. 2019, 186, 105–109.
[CrossRef]
23. Tønnesen, R.; Hovind, P.H.; Jensen, L.T.; Schwarz, P. Determinants of vitamin D status in young adults:
influence of lifestyle, sociodemographic and anthropometric factors. BMC Public Health 2016, 16, 385.
[CrossRef]
24. Janssen, H.C.J.P.; Emmelot-Vonk, M.H.; Verhaar, H.J.J.; Van Der Schouw, Y.T. Determinants of vitamin D
status in healthy men and women aged 40–80 years. Maturitas 2013, 74, 79–83. [CrossRef]
25. Muscogiuri, G.; Barrea, L.; Di Somma, C.; Laudisio, D.; Salzano, C.; Pugliese, G.; De Alteriis, G.; Colao, A.;
Savastano, S. Sex Differences of Vitamin D Status across BMI Classes: An Observational Prospective Cohort
Study. Nutrients. 2019, 11, 3034. [CrossRef] [PubMed]
26. Hagenau, T.; Vest, R.; Gissel, T.N.; Poulsen, C.S.; Erlandsen, M.; Mosekilde, L.; Vestergaard, P. Global vitamin
D levels in relation to age, gender, skin pigmentation and latitude: an ecologic meta-regression analysis.
Osteoporos. Int. 2008, 20, 133–140. [CrossRef] [PubMed]Nutrients 2020, 12, 2663 18 of 19
27. Wang, Y.; Hunt, K.; Nazareth, I.; Freemantle, N.; Petersen, I. Do men consult less than women? An analysis
of routinely collected UK general practice data. BMJ Open 2013, 3, e003320. [CrossRef]
28. Dickinson, A.; Mackay, D. Health habits and other characteristics of dietary supplement users: A review.
Nutr. J. 2014, 13, 14. [CrossRef]
29. Peklar, J.; Henman, M.C.; Richardson, K.; Kos, M.; Kenny, R.A. Food supplement use in the community
dwelling population aged 50 and over in the Republic of Ireland. Complement. Ther. Med. 2013, 21, 333–341.
[CrossRef]
30. Kiely, M.E.; Flynn, A.; Harrington, K.; Robson, P.J.; O’Connor, N.; Hannon, E.; O’Brien, M.; Bell, S.; Strain, J.
The efficacy and safety of nutritional supplement use in a representative sample of adults in the North/South
Ireland Food Consumption Survey. Public Health Nutr. 2001, 4, 1089–1097. [CrossRef]
31. Haas, M.L.; Moore, K. Osteoporosis: An Invisible, Undertreated, and Neglected Disease of Elderly Men.
J. Elder Abus. Negl. 2007, 19, 61–73. [CrossRef] [PubMed]
32. Chirita-Emandi, A.; Socolov, D.; Haivas, C.; Calapis, , A.; Gheorghiu, C.; Puiu, M. Vitamin D Status: A Different
Story in the Very Young versus the Very Old Romanian Patients. PLoS ONE 2015, 10, e0128010. [CrossRef]
33. Martini, L.A.; Verly, E.; Marchioni, D.; Fisberg, R.M. Prevalence and correlates of calcium and vitamin D
status adequacy in adolescents, adults, and elderly from the Health Survey—São Paulo. Nutrition 2013, 29,
845–850. [CrossRef]
34. Bord Bia Irish Food Board. Dietary Lifestyles Report November 2018. 2018. Available
online: https://www.bordbia.ie/globalassets/bordbia.ie/industry/marketing-reports/consumer-reports/
dietary-lifestyles-report-november2018.pdf (accessed on 31 August 2020).
35. Irish Universities Nutrition Alliance (IUNA). National Adult Nutrition Survey: Summary Report; Irish
Universities Nutrition Alliance (IUNA): Cork, Ireland, 2011.
36. National Institutes of Health. Osteoporosis: Peak Bone Mass in Women; NIH Pub. No. 15-7891 2015; National
Institutes of Health: Bethesda, MA, USA, 2015; NIH Pub. No. 15-7891 2015.
37. Heaney, R.P. Long-latency deficiency disease: insights from calcium and vitamin D. Am. J. Clin. Nutr. 2003,
78, 912–919. [CrossRef]
38. Wärnberg, J.; Marcos, A. Low-grade inflammation and the metabolic syndrome in children and adolescents.
Curr. Opin. Lipidol. 2008, 19, 11–15. [CrossRef] [PubMed]
39. Kim, D.-H.; Meza, C.A.; Clarke, H.; Kim, J.-S.; Hickner, R.C. Vitamin D and Endothelial Function. Nutrition
2020, 12, 575. [CrossRef]
40. Laird, E.; Rhodes, J.; A Kenny, R. Vitamin D and Inflammation: Potential Implications for Severity of
Covid-19. Ir. Med. J. 2020, 113, 81.
41. Holick, M.F.; Matsuoka, L.; Wortsman, J. Age, vitamin D, and solar ultraviolet. Lancet 1989, 334, 1104–1105.
[CrossRef]
42. Pourshahidi, L.K. Vitamin D and obesity: current perspectives and future directions. Proc. Nutr. Soc. 2014,
74, 115–124. [CrossRef] [PubMed]
43. Richardson, K.; Moore, P.; Peklar, J.; Galvin, R.; Bennett, K.; Kenny, A.R. Polypharmacy in Adults Over 50 in
Ireland: Opportunities for Cost Saving and Improved Healthcare; Trinity College Dublin: Dublin, Ireland, 2012.
44. Haase, T.; Pratschke, J. The 2016 Pobal HP Deprivation Index. 2017. Available online: www.trutzhaase.eu
(accessed on 31 August 2020).
45. Heald, A.H.; Anderson, S.G.; Scargill, J.J.; Short, A.; Holland, D.; Khan, A.; Fryer, A.A.; Donn, R.; Livingston, M.
Social Disadvantage Is Associated With Lower Vitamin D Levels in Older People and There Is No Surrogate
for Its Measurement. Gerontol. Geriatr. Med. 2017, 3, 2333721417697843. [CrossRef]
46. Mithal, A.; IOF Committee of Scientific Advisors (CSA) Nutrition Working Group; Wahl, D.; Bonjour, J.-P.;
Burckhardt, P.; Dawson-Hughes, B.; Eisman, J.A.; Fuleihan, G.E.-H.; Josse, R.G.; Lips, P.; et al. Global vitamin
D status and determinants of hypovitaminosis D. Osteoporos. Int. 2009, 20, 1807–1820. [CrossRef]
47. Fahey, E.; Russell, H.; Mcginnity, F.; Grotti, R. Diverse Neighbourhoods: An Analysis of the Residential Distribution
of Immigrants in Ireland; Economic and Social Research Institute, Department of Justice and Equality: Dublin,
Ireland, 2019.
48. Kasahara, A.K.; Singh, R.J.; Noymer, A. Vitamin D (25OHD) Serum Seasonality in the United States. PLoS ONE
2013, 8, e65785. [CrossRef]Nutrients 2020, 12, 2663 19 of 19
49. Grant, W.B.; Lahore, H.; McDonnell, S.; Baggerly, C.A.; French, C.B.; Aliano, J.L.; Bhattoa, H.P. Evidence that
Vitamin D Supplementation Could Reduce Risk of Influenza and COVID-19 Infections and Deaths. Nutrients
2020, 12, 988. [CrossRef]
50. Gembillo, G.; Cernaro, V.; Salvo, A.; Siligato, R.; Laudani, A.; Buemi, M.; Santoro, D. Role of Vitamin D Status
in Diabetic Patients with Renal Disease. Medicina 2019, 55, 273. [CrossRef] [PubMed]
© 2020 by the authors. Licensee MDPI, Basel, Switzerland. This article is an open access
article distributed under the terms and conditions of the Creative Commons Attribution
(CC BY) license (http://creativecommons.org/licenses/by/4.0/).You can also read