Interested in learning more? - Global Information Assurance Certification Paper
←
→
Page content transcription
If your browser does not render page correctly, please read the page content below
Global Information Assurance Certification Paper

                            Copyright SANS Institute
                            Author Retains Full Rights
   This paper is taken from the GIAC directory of certified professionals. Reposting is not permited without express written permission.

Interested in learning more?
Check out the list of upcoming events offering
"Intrusion Detection In-Depth (Security 503)"
at http://www.giac.org/registration/gcia
Detecting Penetration Testers on a Windows
                                 Network with Splunk
                                        GIAC (GCIA) Gold Certification

                                     Author: Fred Speece, fredspeece@gmail.com
                                              Advisor: Richard Carbone
                                               Accepted: October 2016

                                                        Abstract

               Through data collection, reports, and alerts, an InfoSec team can have a better idea of
               what Penetration Testers are doing and hopefully in turn stop real bad guys that may get
               on their network. This paper discusses the configuration and setup of those alerts and the
               logging behind them. It also covers the thought process behind the alert and attack(s) it is
               trying to defend against. If an InfoSec department picked up this paper before their first
               Penetration Test, they would have better visibility into their network and alert on possible
               changes that an adversary could make. Splunk should not alert on everything, but it
               should alert on behavior that is abnormal. This paper is targeted for a Windows majority
               network with Active Directory in an organization with an immature security posture,
               using Splunk as their SIEM.

© 2016 The SANS Institute                                                                          Author retains full rights.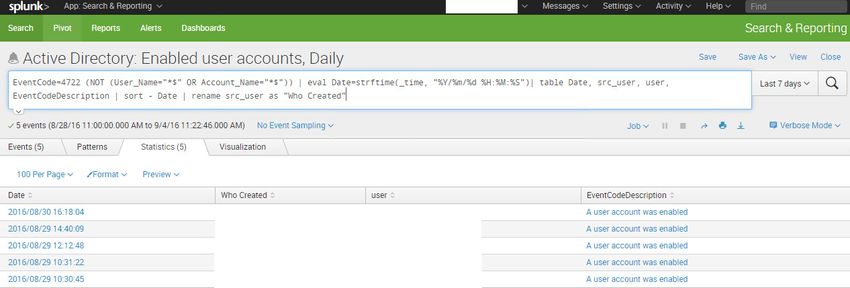
Detecting Penetration Testers on a Windows Network with Splunk 2

               1. Introduction
                       Preventing or at least detecting breaches and other incidents on a network is a
               challenge for everyone. It is especially so for an immature information security (InfoSec)
               team in a small to mid-sized organization, or for an IT team in a culture that has not
               prioritized security in the past. An InfoSec team may not know where to start, but a
               critical piece is gaining visibility in a network. Log files are a key area for security
               information and hold a wealth of data (InfoWorld, 2009). Capturing, centralizing,
               correlating, searching, and alerting on the data from log files are a key step to defending a
               network. This paper is targeted for a majority Windows based network with Active
               Directory (AD) in an organization with an immature security posture, using Splunk as
               their Security Information and Event Management (SIEM) system.

               1.1. Value of Penetration Testing

                       A Penetration Test (Pen-Test) should be designed to be real world, emulate an
               attacker, and provide the internal security team information to help protect their network
               (Cornelley, 2016). A Pen Test can be a real eye opener and find weaknesses in security
               that were not known or pointed out previously and therefore never addressed. Another
               key benefit of a Pen Test is prioritizing what to work on and secure. An InfoSec team
               may be working on one more advanced systems, say a Data Loss Prevention (DLP) or
               Intrusion Prevention System (IPS), but still need to cover the basics like password
               strength and patching systems (Williams, 2014). A great exercise to conduct while a Pen
               Test is ongoing is to have a Blue Team member do their best to watch and build alerts
               concerning the actions of the Pen Tester to try to "catch them." Tuning the alerts and
               reports based off of the Pen Tester's findings, tactics, and tools is a great way to build
               visibility.

               1.2. Value of Splunk
                       Any Log Management or SIEM system used correctly can provide big value to an
               organization; this paper will focus on using Splunk. Splunk has a great community
               around it (Splunk Answers), it is easy to get helpful data out of it quickly, and well rated

               Fred Speece, fredspeece@gmail.com
© 2016 The SANS Institute                                                                             Author retains full rights.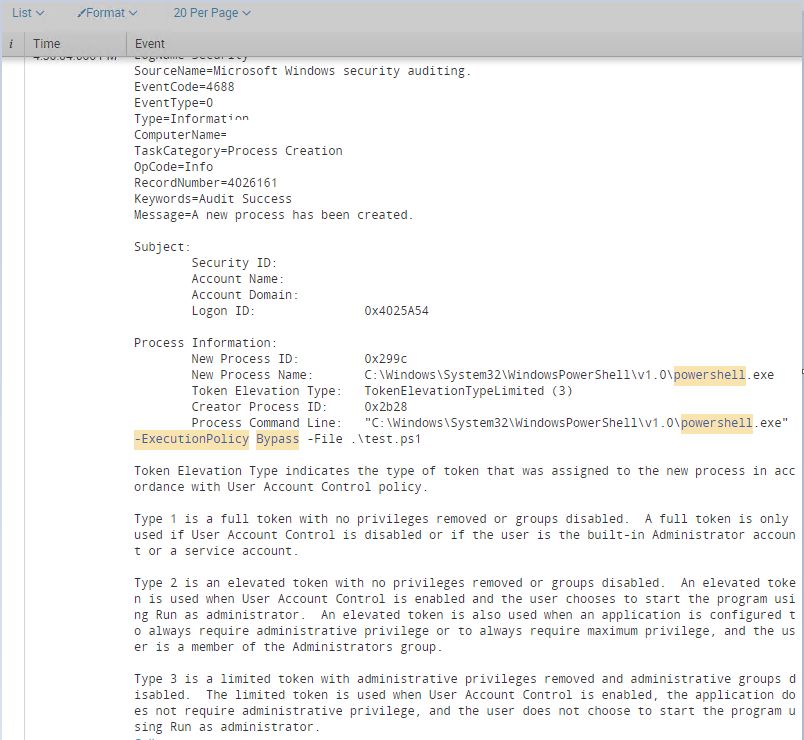
Detecting Penetration Testers on a Windows Network with Splunk 3

               in the industry (Gartner, 2016). We will use a simple example of user account lockouts to
               show the ease with which one can get useful information. In comparison, Hewlett-
               Packard Enterprise's ArcSight, a popular and well-rated competitor, has a reputation of
               being much more challenging to get value out of quickly (Poor, 2016). The general steps
               we will follow are:
                      1. Install Splunk Enterprise with a trial license on a virtual machine (VM).
                      2. Install Splunk Universal Forwarders on all the Domain Controllers in the
                            environment.
                      3. Install the Windows Security Operations Center by INFIGO IS and use the
                            User Management > User Account Management prebuilt dashboard.
                      4. Drill into the reports to find the machine that is locking a user out.
                      It may only take a few hours to get to this point. Obviously, there is more work to
               be done, and this paper will explore creating some more advanced reports, dashboards,
               and alerted.
                      A SIEM can also assist with a few of the Center for Internet Security’s (CIS) Top
               20 Critical Security Controls, namely:
                            •   1 - Inventory of Authorized and Unauthorized Devices
                            •   2 - Inventory of Authorized and Unauthorized Software
                            •   4 - Continuous Vulnerability Assessment and Remediation
                            •   5 - Controlled Use of Administrative Privileges
                            •   6 - Maintenance, Monitoring, and Analysis of Audit Logs
                            •   16 - Account Monitoring and Control (Eubanks, 2011).

               2. Log Collection Basics
                      There are many aspects to consider when discussing logs. The following are some
               of the advantages and disadvantages of sending logs to a SIEM. If one sends everything
               and saves it for a long time, the team will have the data to search and look back on, but
               there are costs associated with that. SIEM systems like Splunk are based on data per day,
               so licensing costs will go up as more data is sent, along with increased backend storage
               costs. Searching large amounts of data will require search clusters, faster storage,

               Fred Speece, fredspeece@gmail.com
© 2016 The SANS Institute                                                                             Author retains full rights.
Detecting Penetration Testers on a Windows Network with Splunk 4
compute, and more memory, driving up costs (Splunk, 2015). Searching for that security-
event-needle in a haystack becomes harder. Filtering events at the forwarder or the
indexer will help in all those cases. Figure out what events and what systems are most
important, and just capture those, such as on domain controllers and sensitive file servers.
A great resource for Event IDs is Randy Franklin Smith's
https://www.ultimatewindowssecurity.com.
Capturing events from client machines can have very useful data, as it is often the
compromise point. However, it can also generate extremely numerous log events, and
managing thousands of end-point forwarders can be more complex (Anthony, 2013).
2.1. Splunk Configuration
High-level ideas will be covered quickly to get up and running with Splunk.
Splunk has three main ways of providing information: dashboards, reports, and alerts. A
dashboard is something that someone looks at interactively by searching, changing time
frames, and drilling into data. Reports are larger sets of data, which could be emailed at
specific intervals. Alerts are typically based off a trigger and could fire off for, example
at every hour. They are used for different purposes, and all have their place.
Planning and sizing a SIEM is based on the number of concurrent searches,
reports, and alerts at any point in time, and the amount of data coming into the system.
Planning forwarder deployment and management is required to get the needed logs; the
Distributed Management Console can assist. Larger instances of log management may
require multiple indexers, a search cluster, and management components like licensing
and deployment servers on separate physical or virtual machines. It is important to plan
and think through designing which source types, indexes, permissions and other security
aspects of the system. Most of these elements one can grow into, adding additional search
heads and indexers, more indexes, and starting over from scratch by wiping out indexes if
their historical data is not needed. Splunk's documentation and wiki pages have many
great resources to get started (Splunk, Splunk Wiki, 2016). "Discovering Security Events
of Interest Using Splunk" (Roberts, 2013) also covers many of these steps. The "Things I
wish I knew then” Splunk Wiki page is another great resources for things to think about
before, during and after deployment (Splunk Wiki, 2016).
Fred Speece, fredspeece@gmail.com
© 2016 The SANS Institute Author retains full rights.Detecting Penetration Testers on a Windows Network with Splunk 5
Jessica Petrakovic created most of the following Splunk search strings, which are
the basis for the reports, dashboards, and alerts. Many were influenced by events that
happened during a Pen Test and were built to catch the events that lead to compromise.
Other searches are designed to catch security lapses or mistakes that would decrease an
organization's security stance. All searches should be customized for an organization.
Let's get Splunking!
3. Reports and Dashboards
Reports are similar to Alerts, which will be covered in a later section. A report is
something typically viewed by a person. Dashboards can be the "single pane of glass"
marketing people usually tout, used for troubleshooting a certain issue, or viewing-related
data on one page (Splunk Answers, 2014). Figure 1 shows an example of a useful
dashboard for a Help Desk to use for troubleshooting the source of lockouts. Each panel
is generated from a different search string, and the second panel shows logs from a Cisco
RADIUS system. Sending RADIUS logs can be configured a few ways: syslog to send to
the Splunk indexer directly, to an intermediary syslog collector, or put a universal
forwarder on the RADIUS system or collector point, to name a few. Each has its pros and
cons, check the wiki syslog best practices page for more detail (Splunk Wiki, 2015).
Fred Speece, fredspeece@gmail.com
© 2016 The SANS Institute Author retains full rights.Detecting Penetration Testers on a Windows Network with Splunk 6
3.1. User Account Lockouts
Figure 1-A: User Account Lockouts Dashboard.
Figure 1-B: User Account Lockouts Dashboard.
Figure 1 is a custom Splunk App ("Help Desk"), with a Dashboard as the Main
page. Basic steps on creating a dashboard: Splunk > Search & Reporting app >
Fred Speece, fredspeece@gmail.com
© 2016 The SANS Institute Author retains full rights.Detecting Penetration Testers on a Windows Network with Splunk 7
Dashboards > Create New Dashboard. Give the dashboard a name, then add panels and
inputs. The Inputs are "Text," for searching on a name, and "Time," for the time picker.
Lookups are used in some of the searches and are a slightly more advanced topic.
The lookup definition “dnslookup” is used for translating IPs to DNS names, and it
comes with Splunk. It only has two columns of data and is straight forward to use. The
lookup “macLookup” is not native to Splunk, created off of
“mac_address_assignments.csv,” which is a lookup table file and resides in “D:\Program
Files\Splunk\etc\apps\help_desk\lookups\." The data was pulled from a media access
control (MAC) address lookup site that supplies MAC Address information for
manufacture's Organizationally Unique Identifier (OUI) to help in locating devices in
comma separated value (CSV) form. Helps answer questions like "Is this MAC address
an Apple Device or Dell Laptop," for example.
The search strings that make up the panels of the Dashboard are as follows, they
will need to be adjusted to fit a specific environment, but are a good starting point:
Recent Account Lockouts
index=wineventlog sourcetype=WinEventLog:Security
Account_Name="$username$" "EventCode=4740" NOT
(Account_Name="Guest" OR Account_Name="Administrator") | fields * | eval
Locked_Account=mvindex(Account_Name,1)| transaction Locked_Account
maxpause=5s | eval Time=strftime(_time, "%m/%d/%Y %H:%M:%S") | lookup
userInfo sAMAccountName as Locked_Account OUTPUT displayName | rex
field=Caller_Computer_Name "\\\\\\\(?.*)" | table
Time, Locked_Account, displayName, Caller_Computer_Name | rename
Locked_Account as "User Name", displayName as "Display Name",
Caller_Computer_Name as "Source Computer Name"
Cisco: Wireless/VPN Failed Attempts
index=cisco_acs | rex
"(CSCOacs_Passed_Authentications|CSCOacs_Failed_Attempts)
(?P[0-9]+)" | transaction message_id | where event_reason!="*
Request dropped" AND event_reason!="EAP session timed out"| search *Fail* |
eval mac_address=coalesce(mac_address,Calling_Station_ID) | eval
mac=replace(mac_address,"(\.|:|-)","") | eval mac_add=tostring(upper(mac)) | rex
mode=sed field=mac_add "s/([A-Z0-9]{2})([A-Z0-9]{2})([A-Z0-9]{2})([A-Z0-
9]{2})([A-Z0-9]{2})([A-Z0-9]{2})/\1:\2:\3:\4:\5:\6/" | eval
mac=upper(substr(mac,1,6)) | lookup macLookup mac_assignment as mac
OUTPUT company_name | eval mac_add=if(access_service=="RADIUS_VPN",
Fred Speece, fredspeece@gmail.com
© 2016 The SANS Institute Author retains full rights.Detecting Penetration Testers on a Windows Network with Splunk 8
"N/A",mac_add) | rex field=UserName "[a-zA-Z]{9}\\\\\\\(?.*)" |
rex field=UserName "(?.*)@contoso\.com" | search
UserName=$username$ | lookup userInfo sAMAccountName as UserName
OUTPUT displayName | eval Device_IP_Address=NAS_IP_Address| eval
Time=strftime(_time,"%m/%d/%Y %H:%M:%S") | table Time UserName
displayName Device_IP_Address mac_add company_name
AuthenticationMethod access_service | fillnull value="N/A" | rename
UserName as "User", Device_IP_Address as "IP Address",
AuthenticationMethod as "Authentication Method", access_service as "Access
Service", displayName as "Name", mac_add as "MAC Address" company_name
as "NIC Brand"
Windows: Failed Logons
index=wineventlog sourcetype=WinEventLog:Security ((EventCode=4776 AND
Keywords="Audit Failure") OR (EventCode=4771 AND Keywords="Audit
Failure")) $username$ NOT (Administrator OR Account_Name=*$$) | rex
field=Client_Address "::ffff:(?.*)" | lookup dnslookup clientip
as Client_Address | rex field=clienthost "(?.*).contoso.com" | eval
Source_Workstation=coalesce(Source_Workstation, clienthost) | eval
Logon_Account=coalesce(Account_Name, Logon_Account) | transaction
Logon_Account maxpause=5s | eval Source_Workstation2 =
mvfilter(!match(Source_Workstation,"-dc")) | eval Source_Workstation =
coalesce(Source_Workstation2,Source_Worksation) | eval
Error_Code=coalesce(Error_Code, Failure_Code) | eval
Error_Code=upper(Error_Code) | eval
failure_reason=case(Error_Code=="0XC0000071", "Expired password",
Error_Code=="0XC0000064","Username does not exist",
Error_Code=="0XC000006A","Incorrect
password",Error_Code=="0XC0000234","Account is locked
out",Error_Code=="0XC0000072","Account is
disabled",Error_Code=="OXC0000071","Expired
password",Error_Code=="0X18","Incorrect
Password",Error_Code=="0X17","Expired
password",Error_Code=="0X12","Disabled/expired/locked out
account",Error_Code=="0XC0000224","Change password at next logon") | rex
field=Source_Workstation "\\\\\\\\(?P.*)" | eval
logon_type=case(EventCode==4771,"Kerberos", EventCode==4776, "NTLM") |
eval Time=strftime(_time,"%m/%d/%Y %H:%M:%S") | table Time
Logon_Account Source_Workstation failure_reason logon_type | rename
Logon_Account as "Username" Source_Workstation as "Source Workstation"
failure_reason as "Failure Reason" logon_type as "Logon Method"
AD: User Password Information
| inputlookup ad_userInformation.csv | where
(!like(userAccountControl,"%DISABLE%")) | search
sAMAccountName=$username$ expiresIn=* | eval pwdLastSet
Fred Speece, fredspeece@gmail.com
© 2016 The SANS Institute Author retains full rights.Detecting Penetration Testers on a Windows Network with Splunk 9
=strftime(strptime(pwdLastSet,"%Y-%m-%dT%H:%M:%S.%QZ"),"%m/%d/%Y
%H:%M:%S") | eval expiresIn=if(like(userAccountControl,
"DONT_EXPIRE_PASSWD%"), "Password Never Expires",expiresIn) | eval
passwordExpires=if(like(userAccountControl, "DONT_EXPIRE_PASSWD%"),
"Password Never Expires",passwordExpires) | table sAMAccountName
displayName pwdLastSet passwordExpires expiresIn | sort sAMAccountName |
rename displayName as "Display Name" sAMAccountName as " User Name"
passwordExpires as "Password Expiration Date", expiresIn as "Password Expires
In (days)", pwdLastSet as "Password Last Set"
A large part of these searches are formatting the results, terms such as “sort” and
“rename” help with ordering and creating friendly names for the columns (Bolded for
clarity). “Eval” converts the default Splunk time output to more human readable output.
The “Table” command selects the fields we care about that then get sorted and renamed
in the final result. The “coalesce” command combines multiple fields into one column.
More advanced topics such as regular expressions (“rex”) will take some reading and
experimenting to understand as Splunk does it a bit differently than others (Splunk,
2016).
Another use of a dashboard would be a user or computer search that showed all
data relevant to that object. For example, a user search may show various data about the
user from AD: their assigned computers, login times/locations/failures, failed passwords,
etc. It would also include data from a web filtering system, host based anti-malware,
activity in an IPS, single sign-on (SSO) or multi-factor authentication (MFA) system, or
data from other applications like a mail filtering system. A computer-based dashboard
could have similar data, plus vulnerability scan results.
Fred Speece, fredspeece@gmail.com
© 2016 The SANS Institute Author retains full rights.Detecting Penetration Testers on a Windows Network with Splunk 10
Figure 2: Hardware Inventory Dashboard.
These dashboards can give a clearer picture about the current security of a device
or hints on if a user account is compromised or doing something it should not be. Alerts,
discussed next, are what wake up the analyst and gets their attention.
3.2. Suspicious Failed Logons
The next dashboard example is two searches, login attempts to accounts that do
not exist and accounts that are expired or disabled. A high number of these results may be
misconfigurations and more operational than pure security but can help one understand
what normal is in an environment.
source="WinEventLog:security" sourcetype="WinEventLog:Security"
EventCode=4625 Sub_Status=0xC0000064 Account_Name!=*$$ | eval
Date=strftime(_time, "%m/%d/%Y") | eval uacct=mvindex(Account_Name,1) |
stats count by Date, uacct, host, Workstation_Name | rename count as "Attempts"
| sort -Date -Attempts | rename uacct as "Target Account" host as "Host"
Fred Speece, fredspeece@gmail.com
© 2016 The SANS Institute Author retains full rights.Detecting Penetration Testers on a Windows Network with Splunk 11
source="WinEventLog:security" sourcetype="WinEventLog:Security"
EventCode=4625 (Sub_Status=0xC0000072 OR Sub_Status=0xC0000193) | eval
Account_Name=mvindex(Account_Name, 1) | where !like(Account_Name,"%$")
| eval Date=strftime(_time, "%m/%d/%Y") | stats count by Date, Account_Name,
Workstation_Name, Failure_Reason | sort -Date -count | rename Account_Name
as "Target Account" Workstation_Name as "Target Workstation" Failure_Reason
as "Failure Reason" count as "Count"
Figure 3: Suspicious Failed Logons Dashboard.
3.3. Inactive Account Management
Our third example dashboard is around account management. It is important to
make sure that AD is cleaned up and stale objects pruned out if only to keep things clean
and organized. This report can help pinpoint stale user and computer objects. The report
utilizes lookups off CSVs that are generated nightly.
| inputlookup ad_userInformation.csv | eval lastLogonTimestamp =
strptime(lastLogonTimestamp, "%Y-%m-%dT%H:%M:%S.%QZ") | where
lastLogonTimestamp < (now() - (86400 * 180)) | sort -lastLogonTimestamp | eval
last_logon = strftime(lastLogonTimestamp, "%m-%d-%Y %H:%M %p") | table
sAMAccountName displayName last_logon | rename sAMAccountName as
"Username" displayName as "Name" last_logon as "Last Logon"
Fred Speece, fredspeece@gmail.com
© 2016 The SANS Institute Author retains full rights.Detecting Penetration Testers on a Windows Network with Splunk 12
| inputlookup ad_computerInformation.csv | eval lastLogonTimestamp =
strptime(lastLogonTimestamp, "%Y-%m-%dT%H:%M:%S.%QZ") | where
lastLogonTimestamp < (now() - (86400 * 180)) | sort -lastLogonTimestamp | eval
last_logon = strftime(lastLogonTimestamp, "%m-%d-%Y %H:%M %p") | table
computer_name description last_logon | rename computer_name as "Computer
Name", description as "Description" last_logon as "Last Logon"
Figure 4: Inactive Account Management Dashboard.
4. Alerts
Alerts can be configured in many ways depending on how often they want the
information to be sent, how the info is displayed, who to send to, and other parameters
shown below. A few examples follow.
4.1. Created Accounts
A basic example of a useful daily email based on an alert could be “Created
accounts in the past day” (Figure 4). The InfoSec team or team lead of those creating
accounts in the organization could receive this report daily, for more oversight and
Fred Speece, fredspeece@gmail.com
© 2016 The SANS Institute Author retains full rights.Detecting Penetration Testers on a Windows Network with Splunk 13
control over accounts created in the domain. If local users on servers are a concern, a
similar report should be created for that. Someone could match created accounts with the
ticketing system or audit accounts after creation to make sure users conform to the user
account creation standards. If an account is created by someone that should not be
creating accounts, that is cause for an investigation. If an Identity and Access
Management (IAM) system is used, those logs should be sent to Splunk also.
Created AD Accounts
EventCode=4722 (NOT (User_Name="*$" OR Account_Name="*$")) | eval
Date=strftime(_time, "%Y/%m/%d %H:%M:%S")| table Date, src_user, user,
EventCodeDescription | sort - Date | rename src_user as "Who Created"
Figure 5: Example Alert Summary Page.
Figure 6: Alert Type and Trigger Condition.
Fred Speece, fredspeece@gmail.com
© 2016 The SANS Institute Author retains full rights.Detecting Penetration Testers on a Windows Network with Splunk 14
Figure 7: Alert Actions.
Figure 8: Search Results that Alert Fires Off Of.
Fred Speece, fredspeece@gmail.com
© 2016 The SANS Institute Author retains full rights.Detecting Penetration Testers on a Windows Network with Splunk 15
4.2. Failed Logins
Some reports that could get noisy but also provide valuable information are Failed
Logins. A daily report could be created looking at important accounts and their activity.
This type of report can get noisy with passwords simply typed wrong by mistake, and the
focus should be on important accounts such as privileged admin accounts for people like
domain admins. While not perfect, these reports will at least gather a baseline and show
what is normal on a network, and show high amounts of failures.
Failed Admin Logins
index=wineventlog sourcetype="*wineventlog:security" EventCode=4625 Failure
".adm" | eval
logont=case(Logon_Type=="3","Network",Logon_Type=="7","Screen Unlock",
Logon_Type=="10","RDP",Logon_Type="2","Interactive",Logon_Type=="11","
Cached Interactive") | eval User = if(isnull(Account_Name), User_Name,
mvindex(Account_Name,1)) | eval change_time=strftime(_time, "%m-%d-%Y
%H:%M:%S") | lookup dnslookup clientip as Source_Network_Address
OUTPUT clienthost as address | rex field=address
"(?P.*)\.contoso\.com" | eval address=upper(address) | rex field=dest
"(?P.*)\.contoso\.com" | eval dest=upper(dest) | table change_time User
Failure_Reason address src_ip dest logont | rename change_time as Time, logont
as "Logon Type" address as "Source Computer Name" src_ip as "Source IP
Address" dest as "Target Computer Name" Failure_Reason as "Failure Reason" |
fillnull value="N/A"
Active Directory: Failed Admin Logins - Daily
index=wineventlog sourcetype="*wineventlog:security" ".adm"
(EventCode=4771 AND "Audit Failure") OR ("EventCode=4776" AND
Keywords="Audit Failure") NOT (User_Name="*$" OR Account_Name="*$")
NOT Failure_Code=0x19 NOT (Logon_Account="*$" OR Logon_account="*$")
| rex field=Client_Address "::ffff:(?P.*)" | lookup dnslookup
clientip as Client_Address OUTPUT clienthost | rex field=clienthost
"(?.*)\.contoso\.com" | search clienthost!=*-dc* | transaction
Account_Name maxpause=5s | eval change_time=strftime(_time, "%m-%d-%Y
%H:%M:%S") | eval "User
Account"=coalesce(User_Name,Account_Name,Logon_Account,Logon_account)
| table change_time "User Account" Client_Address clienthost | Rename
change_time as Time Client_Address as "Source IP Address" clienthost as
"Source Computer Name"
4.3. Sensitive Groups
Monitor and alert on changes to any Sensitive Groups. Additions to a group such
as Domain Admins is a significant change and should be audited. If there is a change
Fred Speece, fredspeece@gmail.com
© 2016 The SANS Institute Author retains full rights.Detecting Penetration Testers on a Windows Network with Splunk 16
control process for that, this can assist in monitoring additions and removals. An attacker
may just compromise the user in one of these groups and not add to them, but it will
cover a scenario where they add a new user to these powerful groups for persistence
purposes. This alert helps enforce the principle of minimum privileges at least for the AD
groups and increases security by adding auditing and visibility.
Figure 9: Active Directory: Sensitive Group Change Search Results.
Sensitive Groups
* "IMPORTANT GROUPS" OR Administrators OR "Domain Admins" OR
"Enterprise Admins" OR "Schema Admins" OR "Backup Operators" OR
"Account Operators" OR "Print Operators" OR "Group Policy" OR DnsAdmins
OR "DHCP Administrators" OR "Remote Desktop Users" AND EventCode=4728
OR EventCode=4729 OR EventCode=4732 OR EventCode=4733 OR
EventCode=4756 OR EventCode=4757 | eval
source_user=mvindex(Account_Name, 0) | eval
affected_user=mvindex(Security_ID,1) | eval Time=strftime(_time,"%m/%d/%Y
%H:%M:%S") | table Time, source_user, affected_user, ComputerName,
Group_Name, EventCodeDescription | sort - Time | rename source_user as
"Changed By" affected_user as "Affected User" Group_Name as "Group Name"
status as "Action Taken"
4.4. C$, ADMIN$
Alert on crawling local machine shares. This alert is dependent on the log sources,
so make sure any critical systems have Splunk Universal Forwarders installed on them,
especially file shares. Here is an example of a Pen Tester testing access via Invoke-
Sharefinder with a compromised user account:
Fred Speece, fredspeece@gmail.com
© 2016 The SANS Institute Author retains full rights.Detecting Penetration Testers on a Windows Network with Splunk 17
Figure 10: C$ Share Accessed Search Results.
index=wineventlog (EventCode=5140) (C$ OR ADMIN$)
Source_Address!="::1" | lookup userInfo sAMAccountName as Account_Name |
rex field=Source_Address "::ffff:(?.*)" | lookup dnslookup
clientip as Source_Address | rex field=clienthost "(?.*).contoso.com"
|eval Time=strftime(_time,"%m/%d/%Y %H:%M:%S") | table Time
Account_Name displayName host Source_Address clienthost Share_Name
Keywords | rename Account_Name as "Account Name", displayName as "User"
host as "Target Computer" clienthost as "Source Computer" Keywords as
"Success/Failure" Share_Name as "Share" Source_Address as "Source Address"
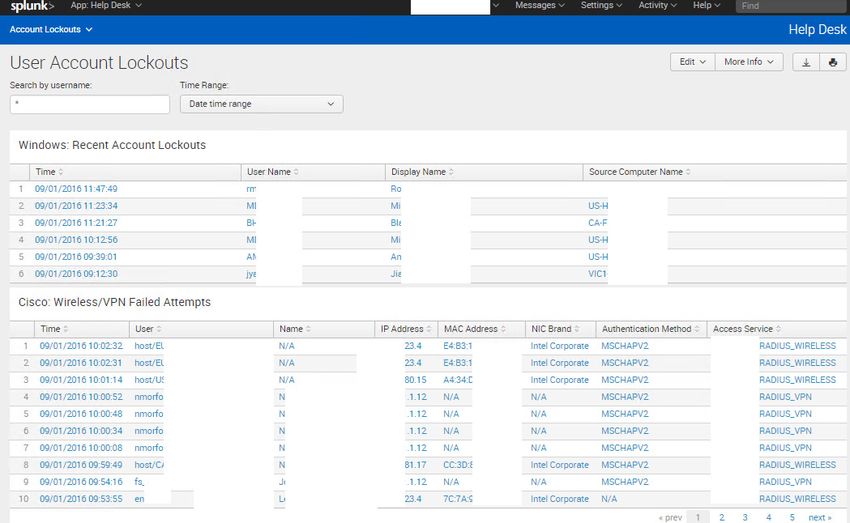
4.5. Clearing Logs
Alert on Cleared Log files as shown in Figure 9. Log files should not be cleared
by a person, only by the system. It may indicate someone trying to cover their tracks.
Fred Speece, fredspeece@gmail.com
© 2016 The SANS Institute Author retains full rights.Detecting Penetration Testers on a Windows Network with Splunk 18
Figure 11: Log File Cleared Search Results.
index=wineventlog OR (sourcetype=WinEventLog:Security EventCode=1102)
Message!=*Microsoft-Exchange* | rex field=Message "(?.*)\." |
transaction host | mvexpand Message | eval Time=strftime(_time,"%m/%d/%Y
%H:%M:%S") | table Time host Message Account_Name | rename host as "Computer
Name" Account_Name as "Cleared By" Message as "Logs Cleared"
4.6. Powershell Bypass
Alert for Windows Powershell bypass. In Group Policy first Enable Audit Process
Creation: Success under Computer Config > Policies > Windows Settings > Security
Settings > Advanced Audit Policy > Audit Policies > Detailed Tracking. Then Enable
Process Auditing under Computer Config > Policies > Admin Templates > System >
Audit Process Creation.
This auditing is an example of the power of auditing command execution and may
be useful for catching Powershell scripts from non-IT users (Metcalf, 2015).
Fred Speece, fredspeece@gmail.com
© 2016 The SANS Institute Author retains full rights.Detecting Penetration Testers on a Windows Network with Splunk 19
Figure 12: Powershell Bypass Search Results
index=wineventlog sourcetype="WinEventLog:Security" (EventCode=4688)
(powershell* AND -ExecutionPolicy) OR (powershell* AND bypass) OR
(powershell* AND -noprofile) | eval Time=strftime(_time,"%m/%d/%Y
%H:%M:%S") | table Time, host, Account_Name, New_Process_Name,
Process_Command_Line | rename host as "Server Name", Account_Name as
"User", New_Process_Name as "Process Name", Process_Command_Line as
"Command Line"
4.7. NTDS.dit on DCs
Lastly, we will alert on the potential compromise of a domain controller by
grabbing NTDS.dit (AD Database file) from a Volume Shadow Copy or an Install From
Media (IFM) set (Metcalf, 2014). The following will alert on the use of "ntdsutil.exe" or
Fred Speece, fredspeece@gmail.com
© 2016 The SANS Institute Author retains full rights.Detecting Penetration Testers on a Windows Network with Splunk 20
"reg.exe” and show who ran it. Monitoring the Volume Shadow Copy service start and
stop events generates too many false positives, use of ntdsutil.exe should be rare.
Legitimate use of ntdsutil can be verified with the server admin working with the tool.
Figure 13: Powershell Bypass Search Results
index=wineventlog sourcetype=WinEventLog:Security EventCode=4688
("ntdsutil.exe" OR "reg.exe") Account_Name!=*$ | eval
Time=strftime(_time,"%m/%d/%Y %H:%M:%S") | table Time Account_Name host
New_Process_Name Process_Command_Line | fillnull value="N/A" | rename
Account_Name as "User Account" host as "Target Computer"
Process_Command_Line as "Command Line" New_Process_Name as "Process
Created"
There are many ways of grabbing the AD database off a domain controller, and
this will just alert on one of them.
5. Conclusion
Log Management systems and SIEM systems can be complex to build, manage,
and maintain, they also require at least a dedicated resource; the system admin cannot just
set it and forget it. There will be a constant stream of requests for the addition of new log
sources, dashboards, alerts and reports to be created. There is a large amount of work
monitoring and maintaining the SIEM itself, managing the data coming into the system,
monitoring forwarders and figuring out why certain systems stopped sending logs.
However, an InfoSec team can get very useful information out of the system quickly if it
is known what to put into it and what one wants to get out of it. Shadowing a Pen Test
can help greatly in that regard. This paper has detailed some examples to get an InfoSec
team up and running and getting actionable information out of the system quickly.
Fred Speece, fredspeece@gmail.com
© 2016 The SANS Institute Author retains full rights.Detecting Penetration Testers on a Windows Network with Splunk 21
References
Anthony, Russ. (2013, June 19). Detecting Security Incidents Using Windows
Workstation Event Logs. Retrieved from https://www.sans.org/reading-
room/whitepapers/logging/detecting-security-incidents-windows-workstation-
event-logs-34262
Carnelley, Daniel. (2016, May 23). The Path to Cybersecurity Confidence Starts With
Penetration Testing. Retrieved from https://securityintelligence.com/the-path-to-
cybersecurity-confidence-starts-with-penetration-testing/
Center for Internet Security. (n.d.). Consensus Security Configuration Benchmarks,
Operating Systems, Microsoft Windows. Retrieved August 31, 2016, from
https://benchmarks.cisecurity.org/
Center for Internet Security. (n.d.). The CIS Critical Security Controls for Effective Cyber
Defense. Retrieved August 31, 2016, from https://www.sans.org/critical-security-
controls
Chisholm, Colin. (2016, March 24). Boiling the Ocean: Security Operations and Log
Analysis. Retrieved from https://www.sans.org/reading-
room/whitepapers/logging/boiling-ocean-security-operations-log-analysis-36867
Eubanks, Russell. (2011, August 10). A Small Business No Budget Implementation of the
SANS 20 Security Controls. Retrieved from https://www.sans.org/reading-
room/whitepapers/hsoffice/small-business-budget-implementation-20-security-
controls-33744
Gartner, Inc. (2016, August). Magic Quadrant for Security Information and Event
Management. http://www.splunk.com/goto/SIEM_MQ
Grimes, Roger A. (2009, June 12). Learn to love your log files. Retrieved from
http://www.infoworld.com/article/2632886/intrusion-detection/learn-to-love-
your-log-files.html
Metcalf, Sean. (2015, February 11). Detecting Offensive PowerShell Attack Tools.
Retrieved from https://adsecurity.org/?p=2604
Fred Speece, fredspeece@gmail.com
© 2016 The SANS Institute Author retains full rights.Detecting Penetration Testers on a Windows Network with Splunk 22
Metcalf, Sean. (2014, November 6). How Attackers Pull the Active Directory Database
(NTDS.dit) from a Domain Controller. Retrieved from
https://adsecurity.org/?p=451
Microsoft’s TechNet. (2009, September 15). Planning and Deploying Advanced Security
Audit Policies. Retrieved from https://technet.microsoft.com/en-
us/library/ee513968(v=ws.10).aspx
Millis, David. (2015). Taking Splunk to the Next Level - Architecture Breakout Session.
Retrieved from http://www.slideshare.net/Splunk/taking-splunk-to-the-next-level-
architecture-breakout-session-51356901
Petrakovic, Jessica. (2016). Custom Splunk Scripts, Alerts, Dashboards, Reports.
Poor, Mike. (2016). SAN503 On Demand recording.
Scarfone, Karen. (n.d.). Splunk Enterprise: SIEM product overview. Retrieved August 31,
2016, from http://searchsecurity.techtarget.com/feature/Splunk-Enterprise-SIEM-
product-overview
Splunk. (2016). About Splunk regular expressions. Retrieved September 23, 2016, from
https://docs.splunk.com/Documentation/Splunk/6.4.3/Knowledge/AboutSplunkre
gularexpressions
Splunk. (2016). Splunk® Enterprise Installation Manual. Retrieved August 31, 2016,
from http://docs.splunk.com/Documentation/Splunk/6.4.3/Installation
Splunk Answers, jrodman. (2014, November 14). Report v.s. Alert, what's the difference?
Retrieved September 4, 2016, from
https://answers.splunk.com/answers/187134/report-vs-alert-whats-the-
difference.html
Splunk Wiki. (n.d.). Installing Splunk in the Enterprise Step by Step.
Retrieved August 31, 2016, from
https://wiki.splunk.com/Installing_Splunk_in_the_Enterprise_Step_by_Step
Splunk Wiki. (n.d.). Community: Best Practice For Configuring Syslog Input.
Retrieved September 5, 2016, from
http://wiki.splunk.com/Community:Best_Practice_For_Configuring_Syslog_Input
Splunk Wiki. (n.d.). Things I wish I knew then. Retrieved September 4, 2016, from
https://wiki.splunk.com/Things_I_wish_I_knew_then
Fred Speece, fredspeece@gmail.com
© 2016 The SANS Institute Author retains full rights.Detecting Penetration Testers on a Windows Network with Splunk 23
Robert, Carrie. (2013, July 10). Discovering Security Events of Interest Using
Splunk. Retrieved from https://www.sans.org/reading-
room/whitepapers/logging/discovering-security-events-interest-splunk-34272
Williams, Jacob. (2014, June). Practical Threat Management and Incident Response
for the Small- to Medium-Sized Enterprises. Retrieved from
https://www.sans.org/reading-room/whitepapers/analyst/practical-threat-
management-incident-response-small-medium-sized-enterprises-35257
Fred Speece, fredspeece@gmail.com
© 2016 The SANS Institute Author retains full rights.Last Updated: January 20th, 2021
Upcoming Training
SANS Cyber Security West: Feb 2021 , Feb 01, 2021 - Feb 06, 2021 CyberCon
SANS Cyber Security East: March 2021 , Mar 01, 2021 - Mar 06, 2021 CyberCon
SANS 2021 , Mar 22, 2021 - Mar 27, 2021 CyberCon
SANS Cyber Security East: April 2021 , Apr 12, 2021 - Apr 17, 2021 CyberCon
SANS Brussels April 2021 , Belgium Apr 26, 2021 - May 01, 2021 CyberCon
SANS Baltimore Spring: Virtual Edition 2021 , Apr 26, 2021 - May 01, 2021 CyberCon
SANS Security West 2021 , May 10, 2021 - May 15, 2021 CyberCon
SANS SOC Training 2021 , Jun 14, 2021 - Jun 19, 2021 CyberCon
SANS Paris June 2021 , France Jun 14, 2021 - Jun 19, 2021 CyberCon
SANS Cyber Defence Asia Pacific 2021 , Australia Jun 28, 2021 - Jul 10, 2021 Live Event
SANS Cyber Defence Asia Pacific 2021 - Live Online , Australia Jun 28, 2021 - Jul 10, 2021 CyberCon
SANS Amsterdam September 2021 , Netherlands Sep 06, 2021 - Sep 11, 2021 CyberCon
SANS APAC ICS Summit & Training Singapore, Singapore Nov 15, 2021 - Nov 20, 2021 CyberCon
SANS Security Operations Europe 2021 , United Kingdom Dec 06, 2021 - Dec 11, 2021 CyberCon
SANS OnDemand Online Anytime Self PacedYou can also read