Fair Rent Homes: Technical Appendix Part 1: Rent Setting and Rental Affordability Analysis Rent Setting in the Social Housing Sector - Shelter England
←
→
Page content transcription
If your browser does not render page correctly, please read the page content below
Fair Rent Homes: Technical Appendix
Part 1: Rent Setting and Rental Affordability Analysis
Rent Setting in the Social Housing Sector
The two main rental policies currently in affordable housing are Social Rent and Affordable
Rent. Social rents are based on a formula involving local earnings 1 whereas Affordable Rents
are market-fixed (up to a maximum of 80% of local private rents. However, as the interplay
between rents, prices, earnings and incomes is highly differentiated across the nine English
regions, there are frequently gaps left between these two rental level.
As an example of this, whereas in many Southern English regions, Social Rents are genuinely
affordable (while Affordable Rents are not) in a number of local authorities in the North
East, Social Rent not only is higher than Affordable Rent, but can also be higher than local
private market rents 2.
Many households’ budgets in some parts of England fall between the gaps left between the
market-fixed Affordable Rent product, and the lower but underfunded Social Rent product.
They also are priced out of all current routes to homeownership due to house price to
income ratios which just keep rising. It is this group who Fair Rent Homes are designed to
support and accommodate.

Rental levels in the Social Housing Sector
Looking at housing associations new affordable housing lettings using the latest Statistical
Data Return (SDR 2015-16) published by the Homes and Communities Agency (HCA), it is
clear that whilst Affordable Rents can be set to a maximum of 80% of local private rents,
actual rents in a number of regions are below this 3.

1
  See HCA, Rent Standard Guidance, Appendix 1: Detailed information on calculating formula rents
https://www.gov.uk/government/publications/rent-standard-guidance ; HCA, Statistical Data Return2015/16.
2
  HCA, Statistical Data Return 2015/16, VOA, Private Market Rental Statistics
3
  Data from the latest Continuous Recording of Social Housing Lettings (CoRe 2015-16) was used as a cross-
reference. Whilst there was non-zero divergence, any difference between the two datasets was not significant.
The below looking at 2 bed rents evidences this:

                                       Actual Affordable Rents as a percentage of Private
    Region                             Rents for two bed rental properties
    North East                                                                         80% 4
    North West                                                                          77%
    Yorkshire and the Humber                                                            76%
    West Midlands                                                                       77%
    East Midlands                                                                       78%
    East of England                                                                     73%
    London                                                                              50%
    South East                                                                          71%
    South West                                                                          70%

In London, and to a lesser extent, the South East, South West and the East of England,
providers regularly set rents substantially below the 80% maximum threshold. This suggests
that providers in these areas are aware that households being allocated social housing do
not have the income to support affordable rents set near the maximum. In higher rental
value areas within these regions, for instance Hertfordshire in the East of England, this is
particularly acute.
So the question is, is it optimal to require providers to bend the Affordable Rented policy
(and their business model) out of shape to try and provide rents which acknowledge the
differential interplay between rents and incomes across and within English regions? Would
it not be better to provide a new rental option for households, based on local incomes, and
targeted at the median ‘just about managing’ household?

Fair Rent Homes Rent Levels
We have undertaken modelling, using data from the HCA, the Valuation Office Agency, the
Family Resources Survey (FRS), the Annual Survey of Household Earnings (ASHE), to
estimate Fair Rent Homes weekly rent levels. The analysis shows that two-bed rents set at a
third of regional-level gross, non-housing benefit, household incomes would be the
following per week:

4
 Dueto different rent levels within regions, that the North-East percentage when calculated was 81%, which is
above the maximum 80% threshold – as this cannot occur in practice, it has been corrected to 80% for ease of
understanding.
Modelled Rent
Region (weekly)
North East £109
North West £105
Yorkshire and the Humber £115
West Midlands £114
East Midlands £124
East of England £132
London £135
South East £140
South West £126
*Family Resource Survey (2015/16) used as source for household incomes.
There are high levels of variation both between and within regions. But in comparison to the
actual Affordable Rents being paid on current housing association lettings – and compared
to the latest statistics from the VOA regarding private market rents, we find that the nine
regions of England split into three distinct groups:
Modelled as
Modelled Rent Modelled as % of % of Private
Region (weekly) Affordable Rents Rent
North East £109 121% 97%
North West £105 106% 82%
Yorkshire and the
Humber £115 124% 94%
West Midlands £114 108% 84%
East Midlands £124 124% 97%
East of England £132 100% 73%
London £135 69% 34%
South East £140 95% 67%
South West £126 110% 77%
Group 1: Different links between incomes and rents
The first group (consisting of the North East, Yorkshire and the Humber, the East Midlands
and the West Midlands) are unsuitable for this policy. As social rents actually can be higher
than affordable rents in some local authorities within these regions (as shown above) this is
an unsurprising finding.
It is possible that with private rental growth significantly above average currently in a
number of these regions (particularly the East Midlands) 5, an income-based rent level may
5
Index of Private Housing Rental Prices June 2017
https://www.ons.gov.uk/economy/inflationandpriceindices/bulletins/indexofprivatehousingrentalprices/june2
017#growth-in-private-rental-prices-in-london-continues-to-slowbecome more relevant to housing need provision there in the future, if local incomes do not
keep up.
Group 2: Pockets of take-up
The second group (consisting of the North West and the South West) contain pockets of
high value where a policy such as this may be of relevance. The North West encompasses
higher levels of price variance than other relatively more homogenous regions 6, and the
South West has the second lowest Affordable Rents as a regional average (as a percentage
of private market rents) after London. Areas where households would benefit from this
policy are:
• Parts of Manchester and parts of the Lake District in the North West.
• Dorset and major cities such as Bristol and Bournemouth in the South West.
Group 3: High priority areas
The third group (consisting of London, the South East and the East of England) are areas
where rents based on local incomes are significantly below that of actual Affordable Rents
for many local authority areas. Every single London borough would see rents lower than
current levels of Affordable Rent, and the rents would also be significantly lower than the
GLA’s benchmark for ‘London Affordable Rent’ 7. The South East and large parts of the East
of England would also witness rents on average below 75% of local private rents.
London and the South East are expected to be home to 63% of new Fair Rent Homes
(315,500), due to the high proportions of households in those regions who are caught
between social housing allocations and shared ownership. The vast majority of the
remaining 184,500 homes are then expected to be built in the East of England and the South
West. While not perhaps seeing large-scale developments, urban areas with high rents in
other parts of the country also can be expected to see Fair Rent Homes built.
Part 2: The Financing Model and its calibration
Modelling
Due to the range of variables involved, both in the construction of the homes, and the
financial flows once let, any aggregate modelling of the finance required has been stylised.
We have developed a discounted cash flow model, as used previously in SHOUT/ Capital
Economics (2016) and Savills (2015). This models the interplay between rental levels,
operating costs, costs of finance and the costs of development. It also estimates the
proportion of the total build cost of Fair Rent Homes that could be financed through rental
revenue, and how much finance from other sources would be required.
6
Shelter analysis of ONS HPI June 2016 – highest local authority level average price within region as a factor of
the lowest local authority level average price within same region.
7
GLA, Homes for London: Affordable Homes Programme 2016-21 Funding Guidance (2016)Using the same principle as representative agent models in orthodox macroeconomic modelling, the finances required for one composite home was scaled by 500,000. This composite home, was a weighted average of size, type, build cost, land cost, rent, operating costs and other factors. The composite home is assumed to have two bedrooms, this was for two primary reasons: 1) Rents for 2 bedroom affordable rented properties are close to identical to a weighted average of these properties (Affordable Rent 2 beds in the latest HCA SDR had an average rent of £126 per week, whereas the weighted average of properties was £129 per week). If a bedroom size was not assumed, it would require exponentially more time to model this policy, as it would require information regarding build costs, land costs, operating costs etc. differentiated by bedroom size. 2) Our target group, of just about managing private renting households, predominantly require 2 beds. Therefore, in the interests of parsimony of inputs and assumptions, and ultimately accuracy, the model used 2 bedrooms as its baseline. Major Assumptions around model structure/mechanism Number 1: The model is static (assuming all homes are built at once) The model assumes that all homes are built at once, and are available to be let in the same year. This assumption is a simplification, as we believe these homes will be built over 10 years. However, it removes, the need to make assumptions around the growth rates in: 1) Household income (upon which rents and rental revenues are calculated) 2) Operating costs 3) Build costs 4) The Consumer Price Index (from which rental inflation and rental revenues are calculated) 5) Land costs. In the interests of parsimony (and accuracy due to the tenuous evidence available on a number of these measures, particularly beyond 2020), a static modelling approach was utilised. If household income and/or CPI growth rates are higher than those of build costs and land costs, the required additional finance (on top of debt finance) will be lower, and vice versa. 2: There is no feedback loop between investment and build/land costs
By assuming that all homes are built at once, any indirect impact upon build/land price
inflation through increased housing production has been implicitly ignored. Again, this is
due to the lack of available evidence as to the extent to which increased demand for
construction services and goods would increase costs. Any increase in costs would naturally
inflate the total build cost per home, and therefore the requirements for additional finance.
This potential dynamic, provides a further incentive to introduce a version of land value
capture, in order to reduce the possibility of public money being lost to price inflation driven
by that very same public investment.

3: The debt financing mechanism is simplified
Following the lead of Savills (2015) and Capital Economics/Shelter (2016), a discounted cash
flow model is employed. Using the average cost of finance for housing associations in the
latest HCA Global Accounts (2016), the size of the loan which could be taken out at the
beginning of a 30-year period was estimated, with repayments of interest and principal
coming from the property’s net rental income alone.
Two major areas where further complexity could lead to higher levels of debt finance being
accessible are:
   1) The current model implicitly assumes that the loan amount received in year one,
      gathers interest (compounded) over 30 years at 4.9%, and then is paid off in full in
      year 30 with the sum of net rental income gathered over that period. In practice, a
      loan will be repaid through time, either interest-only or both interest and principal.

       Dependent on the size of the loan repayments, this may mean that lesser or greater
       amounts can be borrowed. For example, our researchers found that if it was
       assumed that the average yearly amount of net rental income received over the 30
       years was used fully to pay back interest/principal, £2bn more could be borrowed at
       the prevailing cost of finance. If only 90% of the sum of forecasted net rental income
       could be borrowed against, £1bn less could be borrowed at the prevailing cost of
       finance.

       However, instead of assuming loan structures/terms, which will in practice be at the
       discretion of Housing Association Financial Directors and debt covenants, it was
       deemed most useful to use the simplified model above to give an indication of the
       size of the loan which can be taken out against future rental revenue.

   2) The cost of finance includes financing arrangements made prior to current low base
      interest rates. It is clear that recent announcements from some major developing
      housing associations (for example, see London and Quadrant’s recent £500m bond
      issuance - https://www.lqgroup.org.uk/about/media-centre/news/details/39 ) have
      witnessed demonstrably lower costs of finance. This means that the amount of debt
      which could be leveraged against future revenue streams would be higher than
      centrally estimated.
4: The model presents a single central scenario As shown above, our researchers erred on the side of caution regarding the model inputs, particularly those to which the models’ findings are sensitive, in order; (1) cross-subsidy, (2) land values, and (3) build costs. Therefore, the central estimate is a conservative one, and may underestimate the amount of provider finance available to build these Fair Rent Homes (or another way, it has overestimated the required quantum of additional finance). The rationale for not including a range of scenarios, was that in the absence of robust evidence of the distribution of individual input values these would be arbitrary, while introducing significant variation into model results. As an example of this, in an optimistic scenario using the figure of 56% for cross-subsidy as implied by the latest HCA Sector Risk profile, the required additional finance for these homes would fall from £29bn to £5bn. Input selection: Overview Evidence regarding land values, build costs and grant rates are commercially sensitive, and therefore often requires purchase. National, aggregate level data is also lacking – one of the most commonly used estimates for land values are the DCLG estimates for policy appraisal, and the construction price indices have had well-publicised issues 8. Therefore, for each input, a number of sources were utilised (full source list is given at the end of this document), and a weighted average was calculated where there was variance in values. By using multiple sources in this way, this analysis avoids over-reliance on one particular source which can bias findings. Inflation (national) The value for Consumer Price Inflation used from years 1 to 30 is the medium-term forecast of the Office for Budget Responsibility’s latest forecast accompanying the Spring Budget (2% from 2019 onwards). In practice, it appears that the OBR are fixing it to 2% due to uncertainty regarding future events, with 2% being the Bank of England’s target inflation rate. Rents will increase following CPI each year, in order to provide certainty of revenue to both providers and lenders. It is also assumed that operating costs will increase in line with CPI. This means that this assumption in the first instance nets out at zero if recent above target inflation rates continue beyond the short-term. In recent years, housing associations have made real terms reductions in the social housing operating costs, and there has been stated interest in reducing housing association operating costs even more sharply over the coming years 9. While this would increase net rental income, and therefore reduce the amount of additional finance required to build these homes by enabling higher levels of debt finance, this modelling exercise is not 8 City AM ‘ The UK’s construction conundrum – can we trust the numbers?’ http://www.cityam.com/243281/uks-construction-conundrum-can-we-trust Last accessed 21st August 2017 9 https://www.gov.uk/government/news/hca-publishes-new-analysis-of-cost-variation-in-the-social-housing- sector
predicated on this occurring. It is important that housing associations in the first instance
provide a service with eyes on their tenants, not on margins.

Operating Costs (regionalised)
The Homes and Communities Agency’s (HCA) Global Accounts publication is the pre-
eminent resource for housing association operating costs. Due to the higher associated
costs per home of supported housing and sheltered/housing for older people, and the fact
the Global Accounts are at provider rather than tenure level, it is important to first exclude
housing associations with 20% or more properties which were either Homes for Older
People or Supported Housing. These organisations’ average operating costs will be biased
upwards by the significant higher level of specialist housing in their housing stock relative to
the sector average 10.
Looking then at ‘London and the South East’ and ‘The Rest of England’ as two sub-
geographies, operating costs were calculated following a similar definition given by the HCA
for their ‘total social housing cost per unit’ in their unit costs reporting 11. Maintenance,
Major Repairs, Management and ‘other social housing costs’ (includes back office function
attribution) are all included. Service charge costs were exempted.

Cost of Finance (national)
The HCA’s Global Accounts is the pre-eminent resource on this measure. The average cost of
finance in 2016 was 4.9%. This is taken to be the average interest rate faced by housing
associations when seeking to borrow against their net rental income.

Dwelling Size (national level)
The English Housing Survey provides high quality nationally-representative estimates for
dwelling sizes. In the latest edition, 2015/16, the average dwelling size for existing 2
bedroom properties in the social rented sector (a weighted average of ‘2 twins’ and ‘1 twin
and 1 single’) was 710 sqft. This dwelling size was utilised as the baseline for the model. In
higher value areas, it may be that homes are built with a lower gross internal area (due to
greater usage of flats over homes for instance). However, Shelter is not proposing a policy
which is predicated on a need to reduce average dwelling size in the social rented sector,
nor which does not meet minimum space standards 12 .

10
   A provider with 19% of each would still be included. This was a necessary trade-off when using a cut-off
point.
11
   https://www.gov.uk/government/news/strong-performance-by-social-housing-sector-hca-publishes-global-
accounts Last Accessed 20th August 2017.
12
   The Guardian, ‘’Rabbit Hutch’ homes should be a thing of the past’
https://www.theguardian.com/society/2015/dec/02/rabbit-hutch-homes-should-be-thing-of-the-past-say-
architects Last accessed 20th August 2017; DCLG, Technical housing standards – nationally described space
standard
Build Cost (national level)
A major input into the model are build costs. Evidence regarding build costs was taken from
the HCA, SPONS’ Builders and Architects book for 2017, Savills, Capital Economics and the
ONS. Using a weighted average from these sources, the build cost (excluding land cost and
on cost) was estimated to be £144 per sqft. This will vary due to regional labour availability
and property type to name just two sources of variation. However, based on figures
calculated by the HCA, the cost of build is not as highly variant by geography as land costs -
average build costs by region fluctuated around 10% either side of the England (excluding
London) average 13.

Land Cost (regionalised)
Land is a major factor of housing production, as it is with many modes of industrial
production. As with orthodox economic production functions, which include land in the
amorphous grouping ‘Capital’, there is a blindspot within official housing and planning data
with regards to land values. Land market transparency would make a significant difference
to the time required to undertake exercises such as this, and also would improve policy
analyses.
Evidence regarding land costs was taken from Savills, the Valuation Office Agency, Capital
Economics, the GLA and DCLG. Employing a weighted average approach, the composite land
value for London and the South East sub-model was assumed to be £100 per sqft, and for
the Rest of England sub-model was assumed to be £40 per sqft. In practice, this will be
highly variant both between and within regions.
A non-negligible part of affordable housing delivery relies upon the usage of discounted or
‘free’ land given to providers by actors such as local authorities. In practice this may be used
on occasion to deliver some Fair Rent Homes. However, our model has not accounted for
this, which can be seen as inflating the average land cost above what would be realised in
practice.

Property Types – Houses and Flats (national)
In a number of the data sources, there were differing land valuations per sqft dependent on
whether the property developed was a house or a flat. Our model uses a 50:50 split with
regards to this type of development in both sub-geographies. The latest English Housing
Survey (2015/16) found that 56% of existing Local Authority properties and 58% of existing
housing association properties were houses (the rest were categorised as flats).
However, there is evidence to suggest that in flats are the predominant property type which
is developed, particularly in high value and high density areas such as London 14, areas where
the policy is particularly targeted. Therefore, as a two-bedroom property is being used as a
baseline, partly in order to act as a weighted average, and there is a relatively even split

13
 HCA, Bespoke analysis for Shelter
14
 GLA, Dwellings by Build Period and Type (2014). 53% of properties in London were categorised as ‘flats and
maisonettes’
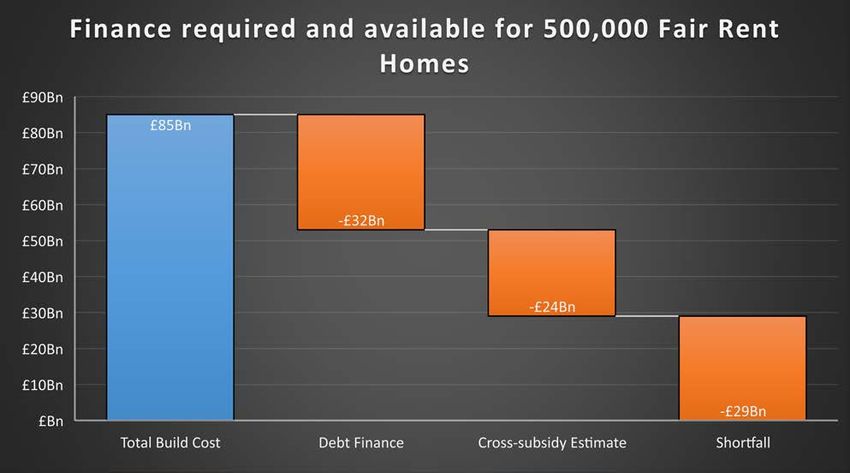
between houses and flats in the EHS 2015-16, it was assumed that there would be an even
split of 50:50 between flats and houses.

Part 3: The Financing Model and its estimates
Total Cost
The total cost of providing a first generation of 500,000 Fair Rent Homes is estimated to be
£85bn. The average build cost of £170,000 per home (including land, build costs and on
costs 15) is inflated by a focus on predominantly high value areas such as London, the South
East, and the East of England. 16 For reference, the average total scheme cost in the 2015-18
HCA's Affordable Homes Programme was £131,000 per home in England (excluding
London) 17.

Debt finance
We estimate that housing associations would be able to borrow £32bn against their future
rental revenue stream, over a 30-year horizon, in order to pay for land and build (38% of
total construction and land cost). 18 This leaves £53bn to be found from other sources.

Cross-subsidy
Due to the focus on building in high value areas, following the lead of Capital Economics 19,
after the 30-year horizon it is clear that from the revenue stream alone social housing
providers will have valuable, revenue-generating assets, even before value from potential
future disposals is taken into account. Therefore, it has conservatively been estimated that
providers will find 28% of the total build cost from other sources of surplus – this could be
from open market sale, existent social housing rental revenues or other sources.
This estimate is conservative - recent National Housing Federation research found that
housing associations are currently funding almost half of their affordable housing
completions entirely without government grant. 20 The latest Sector Risk Profile by the
Homes and Communities Agency also notes that sales revenue is forecast to surpass grants
and debt as a means of financing new development - 56% of housing associations' total
investment in new development over the five years to 2021 is expected to be funded by
sales revenue. 21 However, the same Sector Risk Profile raises concerns about the
sustainability of cross-subsidy, particularly in London. It is therefore expedient not to

15
   On costs are assumed to be 8% of the build cost outside of London and the South East, and 12% within it, in
order to take into account of the extra issues around remediation experienced particularly within London.
16
   Build costs were estimated using HCA, SPONS and Savills data. Land costs were estimated using VOA, Capital
Economics, Greater London Authority, Savills data.
17
   Note that this excludes London. Also, for a non-negligible number of sites, land may have been provided to
providers at discounted rates or for free by local authorities or other parties. This weighs down on the average.
18
   Using the current average cost of finance realised by housing associations according to the latest HCA Global
Accounts publication (2016 - 4.9%) as a discount factor
19
   SHOUT and Capital Economics (2015), Capital Economics and Shelter (2014)
20
   https://www.insidehousing.co.uk/news/half-of-new-association-homes-funded-privately-52139 Last
Accessed 24th August
21
   Homes and Communities Agency, Sector Risk Profile 2017.
predicate delivery of these homes on maintaining the high rates of cross-subsidy currently
being realised.
The estimated combination of cross-subsidy and borrowing against rental revenue would
lead providers to cover around 66 per cent of construction and land costs for these 500,000
homes, a percentage which clearly will vary dependent on area, provider type and providers
financial position.

Additional finance required
With providers estimated to be able to contribute £56bn to the delivery of these 500,000
homes, this leaves the value of £29bn to be found. If these homes were delivered over the
next five years, this would translate into just under £6bn of expenditure per year.

A way to reduce additional finance required: Reducing Land Values via the
New Civic Housebuilding model
As an illustration, with land values in London and the South East of £100 per square foot
used as the benchmark for the model (a weighted average of evidence from multiple
sources regarding residential land values for both flats and houses 22 in London and the
South East), there are clear gains to be made from a form of land value suppression.

22
  Provide sources – worth saying that we are being conservative here in that we are allowing for a significant
proportion of these homes, even in London and SE, to be houses (around half) – which is correct when we are
using 2 beds as an illustration of the wider policy, but in practice in London we may not build houses at all even
for three beds.
The DCLG’s Land Use Change Statistics finds that in 2015/16, averaging across all LAs in the
South East and London, 37% of new residential addresses created were on non-previously
developed land. 21% were created on previously residential land and 41% were created on
previously developed land uses.
Illustration: Capturing land value in London and the South East alone
Using the uplift in value calculated by the DCLG land values for policy appraisal (South East
agricultural to residential post-permission uplift of 16,000%) and the lower uplift found by
the GLA’s Economic Evidence Base in 2016 of 220% 23 from industrial land to residential land
(assumed to apply to South East as well), we estimate that the existing use of the land
coming forward for development in London and the South East is around 35% of the value
that it will hold once full planning permission is achieved.
If an Existing Use Value plus 30 per cent valuation policy was implemented successfully in
just London and the South East alone (an approach recommended by Shelter’s New Civic
Housebuilding model and the London Mayor's Supplementary Planning Guidance for
Affordable Housing and Viability), it would reduce the land cost per Fair Rent Home in
London and the South East by more than half 24.
Looking at the impact just implementing this policy in the South East and London would
have on the finance required for the delivery of all 500,000 Fair Rent Homes (not just those
built in London and the South-East), the total finance required from non-provider sources
would thereby reduce by £10bn to £19bn, or £39,000 per home. Put another way, this
would translate into approaching half (152,000) of the homes to be built in London and the
South East being effectively provided grant-free 25.
Shelter intends to do further work on this issue, to move beyond the illustrative. But it is
clear that even if only half of the above difference was possible, combining the Fair Rent
Homes offer with transformative approaches to land valuation could realise significant
benefits to the public purse, while contributing to overall supply and producing significant
affordability gains for hard-pressed renters.

23
  The GLA’s Economic Evidence Base in 2016 calculated that 1 hectare of residential land in London was
valued at £15.7m, whereas 1 hectare of industrial land in London was valued at £4.9m, over two thirds less.
24
   Usage of the DCLG’s land value for policy appraisal estimates markup from industrial land to residential land
post-planning permission would have made this implied saving significantly greater, as it implies an uplift of
over 900% in London, unlike the uplift of around 200% implied by the GLA’s evidence. The calculation was
(industrial land value per ha / residential land value per ha * 1.3 = 45% of current residential land values.
25
   Using the original additional funding per home in London and the South East as a benchmark.
Full list of sources
AECOM, SPON’s Architects’ and Builders’ Price Book 2017
Centre for Progressive Capitalism ‘Bridging the Infrastructure Gap’ (2016)
DCLG, Continuous Recording of Lettings and Sales in Social Housing in England, 2015-16
DCLG, English Housing Survey, 2015-16
DCLG, Land Value Estimates for Policy Appraisal 2015
DCLG, Technical housing standards – nationally described space standard
DWP, Family Resources Survey 2015-16
Greater London Authority, Dwellings by Property Build Period and Type, 2014
Greater London Authority, Economic Evidence Base, 2016
Greater London Authority, Homes for Londoners: Affordable Homes Programme 2016-21
Funding Guidance
Greater London Authority, London Living Rent ward benchmark data
HMT, The Green Book: Appraisal and Evaluation in Central Government
Homes and Communities Agency, 2015-18 Affordable Homes Programme Allocations
Summary: End of December 2016
Homes and Communities Agency, bespoke analysis unpublished
Homes and Communities Agency, Global Accounts 2016
Homes and Communities Agency, Rent Standard Guidance
Homes and Communities Agency, Sector Risk Profile 2017
Homes and Communities Agency, Statistical Data Return 2015-16
Office for Budget Responsibility, Economic and Fiscal Outlook: Spring Budget 2017
Office for National Statistics, Construction Price Indices
Office for National Statistics, House Price Index
Office for National Statistics, Index of Private Housing Rental Prices in Great Britain
RICS, Building Cost Information Service
Savills, multiple blogs and articles
Savills ‘Living Rents – a new development framework for Affordable Housing’ and other
appended documents (2015)
Shelter and Capital Economics ‘Increasing Investment in Affordable Housing’ (2014)
SHOUT and Capital Economics ‘Building new social rent homes: An Economic Appraisal’
(2016)
Valuation Office Agency, Private Rental Market Summary Statistics: April 2016 to March
2017
Valuation Office Agency, Residential Land Value Data

                                                                        Marcus McPhillips
                                                           Outgoing Economic Researcher
You can also read