ITALY AND THE TITANIC SYNDROME1 - Vision | think tank
←
→
Page content transcription
If your browser does not render page correctly, please read the page content below
ITALY AND…THE TITANIC SYNDROME1
An analysis of COVID19 impact on ITALY’s economy
and public finance (8th May 2020)
After the first, dramatic, phase of the pandemic COVID-19, Italy has just entered an even
more delicate period. We are walking on a narrow path, suspended between two even more
serious crisis: on one hand, the risk of a rise of the contagion curve that could produce a
new lockdown; on the other hand, the possibility that the State may not able to honour a
public debt which is going to exceed – according to the Government’s “Nota di
Aggiornamento al Documento di Economia e Finanza” (the forecast of the state of public
finance for 2020, approved on the 24th April 2020) - – the 150% of GDP.

Vision proposes an analysis that has two added values compared to similar ones:

    a) The first is that our analysis differentiates the impact per sector in 2020; this makes
       it possible to evaluate the real possibility that the recession will have a V shape, as
       expected by the government (and not an L one with a much more limited rebound).
    b) The second is that we focus the dynamic of public finances in 2021 which is going to
       be much more critical than in the current year.

The bottom line is going to be that two conditions are both indispensable to avoid the crisis
spiralling out of control:
    a) An exceptional support from the European Union;
    b) A not less exceptional transformation of the mechanisms through which scare
        taxpayers’ resources are allocated.

The feeling is that the third largest economy of continental Europe is gently navigating
towards an iceberg. We urgently need to conceive a strategy which is not about saving lives
and jobs, but transforming a State which needs to liberate energies and radically change
priorities.

1
 The authors of the VISION paper are Maria Costanza Cau (Investment Banker, International Finance and Economics
Graduate - Bocconi University & HEC Paris), Antonio Negro (Associate Researcher Vision, Finance and Business
Administration John Cabot University, Political Science and International Relations University of Padua) and Francesco
Grillo (Director Vision, Visiting Scholar Oxford University and Sant’Anna School of Advanced Studies, PhD London School
of Economics).
                                                          1
IMPACT ON ITALIAN GDP 2020 – AN ANALYSIS BY SECTOR
The point here is to understand the impact that the actions taken to fight the pandemic
COVID-19 (inter alia lockdown, re-open date) are having on our economy and, most of all,
what are the results on the different sectors.
Vision has produced these data starting from the breakdown of the Italian economy
(excluding public services and public transfers) by sectors (ISTAT, 2017). Each sector
coincides with the so-called second level of “ATECO code”, resulting into a decomposition
of the entire Italian economy into 81 areas: this accounts for about 52% of the country’s
GDP (being the rest the sum of public expenditures for public services – i.e. salaries for
delivering healthcare, education,..–, transfers – including almost 280 billion euro for
pensions, public investments).
The forecast of the shrinking of ITALY’s GDP in 2020 was forecasted by splitting the 2020
into three periods: the “prior lockdown period” (January – February2) for which we
assumed that business was conducted according to past projection; the “lockdown
period” (March – April3) during which the lockdown was imposed; and, finally, what we
called the “post lockdown period” (May - December).
This provisional tripartition will be, indeed, reviewed according to the changes in the
lockdown policy. In fact, our analysis currently estimates the impact of a two-month closure
(until May 4th): continuing the restriction (partially or fully), our forecast will change
accordingly.
Thus, Vision analysis differentiates itself from the ones of many macroeconomic models
because it is based on a policy assessment at the sector level of the lockdown policy which
will be very differentiated in different areas (although it is obvious that many firms do work
between industries and that the boundaries amongst industries are themselves becoming
blurred).
This kind of forecast is, however, much more useful than pure macroeconomic ones for two
reasons:
a) it gives industry specific hints to entrepreneurs and workers;
b) it provides a more realistic test on the shape of the recession and on whether it is
going to be similar to an L (loss of GDP with no or late recovery) or a V (loss with
immediate rebound);
c) it is flexible and can be perfected with more industry specific trends that VISION is
collecting.
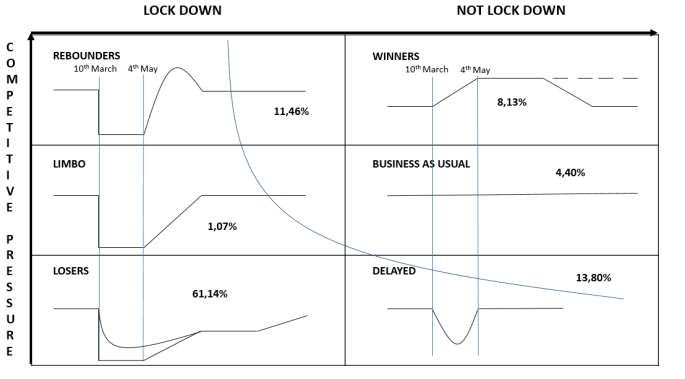
The figure below is an illustration of the industry specific impact of the lockdown.
2
In fact, the first nationwide lockdown measure was adopted on March the 7 th.
3
The strict lockdown may actually finish on May the 4th.
2Figure 1 – Different sector economic reaction to the COVID19 pandemic (percentage of “not public sector”
value added)
Source: Vision
The productive sectors are divided into 6 categories, based on the reactions to the
“lockdown period” and the “post lockdown period”:
• Rebounders: those who stop the activity during the lockdown, and then experience
an over production (compared to the pre-lockdown standard) period to respond to
piling orders, i.e. “construction”
• Limbo: those who stop the activity during the lockdown and then are just able to
reach the pre-lockdown level of activity, i.e. “other services” (repair of computers and
personal and household goods and other personal service activities)
• Losers: those who stop or consistently decrease their level of activity during the
lockdown and then are not able to reach the pre-lockdown standard, i.e. “Tourism” in
Italy is a paramount example of this; “Wholesale and retail trade”, restaurants are
also important.
• Winners: those who experience an increase of activity during the lockdown period
and then keep the new level of production (this may be the example of E-commerce)
or go down to the regular pre lockdown standard, where groceries could fit this
situation.
• Business as Usual: those who do not experience significant change in the
production level both during and after the lockdown, i.e. “Agriculture, forestry, and
fishing”.
• Delayed: those who did not suffer restrictions and yet experienced a strong decline
of activity because of the restrictions hitting their suppliers or clients; t “Mining”,
“Water supply; sewerage, waste management and remediation activities” may all fall
into this category.
3It is interesting to notice that:
a) there are industries which are being positively impacted (a rather obvious case are
e-commerce companies and providers of tools for on-line education);
b) some sectors are being badly damaged although they have not been closed (for
instance, because integrated into complex value chains); more importantly
c) almost two third of Italy’s business added value is concentrated in “losers” industries
which will not recover to pre-crisis levels of turnover by the end of the year.
We, therefore, attached five different kinds of impact of the lockdown policy – both during
and after its implementation - on the 81 sectors, whereas their activity may turn to be (as a
percentage of the pre – lockdown turnover):
• Better than usual: Value added ≥ 110% higher than in the pre – lockdown period
• Business as usual: 90% ≤ Value added < 110%
• Worse than usual: 70% ≤ Value added < 90%
• Negative impact: 20% ≤ Value added < 70%
• Lockdown: Value added < 20%
The results are, therefore, summarized in the table below, where we only report the results
for nineteen larger aggregation of economic activities.
Table 1 – Value added by sector and share of GDP, million euro (LEVEL one ATECO)
Value Value added,
added, Lockdown Post Lockdown 2020 Δ%
2019 (projection)
A: Agriculture, forestry, and
31.863 Business as usual Business as usual 31.580 -0,89%
fishing
B: Mining 2.544 Negative Impact Business as usual 2.287 -10,09%
C: Manufacturing 246.556 Negative Impact Worse than usual 189.194 -23,27%
C:10 Food Industry 22.497 Better than usual Better than usual 26.247 +16,67%
D: Electricity, gas, steam
26.025 Worse than usual Business as usual 24.724 -5,00%
and air conditioning supply
E: Water supply; sewerage,
waste management and 14.033 Worse than usual Business as usual 13.562 -3,36%
remediation activities
F: Construction 51.081 Lockdown Better than usual 48.504 -5,05%
G: Wholesale and retail
136.013 Lockdown Negative Impact 86.934 -36,08%
trade
H: Transportation and
62.427 Worse than usual Business as usual 58.500 -6,29%
Storage
I: Accommodation and food
service activities 34.253 Lockdown Negative Impact 17.126 -50,00%
(restaurants)
J: Information and
49.304 Better than usual Better than usual 55.484 12,54%
Communication
K: Financial and insurance
77.777 Negative Impact Worse than usual 55.740 -28,33%
activities
L: Real estate activities 18.036 Lockdown Worse than usual 11.423 -36,67%
M: Professional, scientific,
55.959 Negative Impact Worse than usual 41.457 -25,92%
technical activities
N: Rental, travel agencies,
40.779 Negative Impact Worse than usual 30.495 -25,22%
business support services
P: Education (Online
2.463 Better than usual Better than usual 2.873 16,67%
courses)
Q: Human health and social
31.767 Worse than usual Better than usual 33.817 6,45%
work activities
R: Social, artistic, sports and
9.861 Lockdown Worse than usual 6.721 -31,84%
entertainment activities
S: Other services 9.194 Lockdown Business as usual 7.693 -16,32%
Total Value Added 899.934 718.114 -20,20%
Source: Vision on Istat data
4While during the lockdown period only 3 sectors are able to keep or increase their value
added (Better than usual and Business as usual), all the others experience lower level of
value added compared to the same period of the previous year the previous year (6 in
Lockdown). During the remaining 8 months the situation clearly improves for all sectors,
even though 8 sectors are still not able to reach the previous year level (Better than
usual and Business as usual) of value added.
Overall, the private sector is expected to lose a staggering 181 billion euro (20,2% of its
added value).
Having calculated the added value of the productive sectors (2020), it has been made a
regression between the value added of productive sectors and GDP of the years 2008 –
2017.
The correlation is significative, resulting in a 2020 GDP estimation of 1.620.606 million euro
(-9,3% compared to 2019)4.
It can be, then, safely assumed that this is the economic impact of LOCKDOWN which we
can take as already certain.
There are, however, two possibilities that may worsen such forecast5:
a) The first is an extension of the restrictions in a lighter form beyond the two months
period that our calculation assumes. This is, in fact, certain and yet we still need to
calculate how will this impact further: this will depend on how will the extension last
and which industries are going to “reopen”): our preliminary hint is that this may
increase the negative impact of a further third (-3,1%).
b) The second uncertainty is about the possibility that the curve of the contagion may
resume its rise and that, thus, a stronger lockdown may be re-established. This
possibility cannot be excluded and some epidemiologists fear that it may happen after
the summer 2020. A preliminary measurement of the cost of such circumstance will
have to be calculated when it materializes; however, a cautionary estimation of the
cost of this may be around two third of the impact of the first lockdown (assuming that
the country may leverage on the learning experience) (-6,2%).
This may, thus, bring us to estimate that the final impact of the crisis may be in a zone
between a best scenario (the GDP shrinks of 9,3%) and a worse one (-18,6%).
4
See the “Methodology section” for the regression results
5
The assessment of the cost of both possibilities will have to take in account that the impact of lockdown is not going
to be linear: in other words the longer the closure, the higher the cost per day; in fact beyond a certain period,
bankrupts will unavoidably increase and damages will become permanent. This consideration does, of course, vary
according to the sectors.
5IMPACT ON ITALIAN PUBLIC FINANCES in 2021
Given the GDP trend and the difficulties of various economic sector, it is plausible to expect
strong consequence on the public finance of the Italian state.
The danger is that the central government will have to steer the country to a “new normal”,
while tackling a very weak financial position: the chances are that it will have to spend much
more money, while collecting much less revenues.
Considering the revenues and the expenses of the state we have considered two options
based on what expressed in the previous chapter
• Best scenario: 2020 GDP -9,3%
• Worst scenario: 2020 GDP -18,6%
Having in mind these two prospects for 2020, we forecasted the evolution of State’s
revenues (tax revenues) and expenditures, in 2020 and 2021.
A further assumption of our estimate is that the 2021 GDP will rebound with the same
intensity after the 2008-2009 (modifying the “Worst scenario” of -40%). Thus for 2021, it is
foreseen
• Best scenario: 2021 GDP +5,77%
• Worst scenario: 2021 GDP +7,68%
The impact on Tax revenues
We, therefore, firstly evaluate how the shrinking of the GDP will impact overall Tax revenues,
providing also a provisional estimation of the impact on IRPEF and IVA. A regression
performed between those variables and GDP (2005 – 2019) has shown a statistically
significant correlation6.
The results for 2020 and 2021, considering the “best scenario”, are reported in Table 2.
Table 2 – Comparison 2019-2020-2021 “Best scenario” Tax revenues, IRPEF, IVA, million euro
2019 2020 2021 Δ 2020-2019 Δ 2021 -2020 Δ 2021 - 2019
IRPEF 191.602 196.088 166.372 4.486 -29.716 -25.230
IVA 136.883 117.137 126.706 -19.746 9.569 -10.177
Tax revenues 496.281 516.265 446.404 19.984 -69.861 -49.877
Source: Vision on data Ragioneria Generale dello Stato
Very different are the numbers considering the “worst scenario”, in Table 3.
Table 3 – Comparison 2019-2020-2021 “Worst scenario” Tax revenues, IRPEF, IVA, million euro
2019 2020 2021 Δ% 2020-2019 Δ% 2021 -2020 Δ% 2021 - 2019
IRPEF 191.602 196.088 136.942 4.486 -59.145 -54.660
IVA 136.883 100.214 111.641 -36.669 11.428 -25.242
Tax revenues 496.281 516.265 377.217 19.984 -139.047 -119.064
Source: Vision on data Ragioneria Generale dello Stato
6
See the “Methodology section” for the regression results
6It is evident, from both Table 2 – 3, in 2020, an overall increase of “tax revenues” and IRPEF,
and a decrease of IVA, while the trend is the opposite considering 2021 (this is obvious
taking into consideration the methodology explained above).
In both the scenarios the real problem, considering 2020, is not connected to the amount of
tax revenues expected, but those that will concretely be paid (currently, it is discussed the
possibility to postpone the payment of the taxes, but it cannot be excluded the cancellation
of the same, at least partially).
The real problem will come in 2021, when it will be experienced an overall loss of tax
revenues (-13,53% “Best Scenario”, -26,93% “Worst Scenario”) and of IRPEF (-15,15%
“Best Scenario”, -30,16% “Worst Scenario”). This is going to put a lot of pressure on the
State, that will experience a lack of resource to fund its regular activities (-49.877 million
euro “Best Scenario”, -119.064 million euro “Worst Scenario”, compared to 2019 ).
The impact on public expenditures
The lockdown of many productive sectors has clearly generated a worsening of their
economic situation, resulting in an increase of the unemployment rate.
A regression between the GDP and unemployment rate variation (2006 – 2019) has shown
a significative correlation, and also positive is the correlation between unemployment rate
and social safe expenses (2007 – 2016)7.
In Table 4-5, unemployment rate and social safe expenses in 2020 and 2021 considering
“Best and worst scenarios”.
Table 4 – Unemployment rate and social safe expenses (million euro) 2019-2020-2021, “Best scenario”
2019 2020 2021 Δ 2020-2019 Δ 2021 -2020 Δ 2021 - 2019
Unemployment
10,0% 14,9% 12,3% 4,91% -2,57% 2,34%
rate
Social security
19.439 28.220 23.628 8.780 -4.591 4.189
expenses
Source: Vision on data Ufficio Parlamentare di Bilancio
Table 5 – Unemployment rate and social safe expenses (million euro) 2019-2020-2021, “Worst scenario”
2019 2020 2021 Δ 2020-2019 Δ 2021 -2020 Δ 2021 - 2019
Unemployment
10,0% 18,9% 14,1% 8,97% -4,86% 4,11%
rate
Social security
19.439 35.477 26.791 16.037 -8.686 7.352
expenses
Source: Vision on data Ufficio Parlamentare di Bilancio
The comparison between the two scenarios shows that both are extremely expensive for
Italy, both in terms of sustainability of public finance and social cohesion.
The impact on costs to serve public debt
Furthermore, the crisis will also produce an increase in public debt and, presumably, in the
interest paid on average on its STOCK, which will generate a further increase in spending.
7
See the “Methodology section” for the regression results
7To estimate the increase of the latter, we started, from a prudential perspective, from the
forecasts of the "Economic and Finance Document", which estimates a net deficit of 10.4%
in 2020 and 5.7% in 2021.
Specifically, we applied a public debt service cost (for 2020 and 2021) of 2.5% for the best
scenario and 3.88% for the worst scenario.
2.5% represents the cost of the service of the public debt (%) of Italy in 2019, while the one
for the worst case scenario is cost of the service of the public debt is 2011, the year in which
the spread between BTP and BUND peaked.
Table 6 – Expenditures for interests on public debt (million euro) 2020-2021
2020 2021
Best scenario 66.512 70.303
Worst scenario 103.226 109.110
Source: Vision
Our calculation therefore assumes the optimistic hypothesis that in the best scenario, the
worsening (compared to the forecast of the DEF) of the ratio of the government debt to GDP
does not increase the percentage cost of the service the debt itself. We assume that the
intervention of the European Central Bank sterilizes further penalties for government bonds
(Republic of Italy)8.
Net of our prudential hypothesis for the calculation of the interests paid on the stock of debt,
in our model we see a spread of the gap between expenses (including our esteem for social
security expenses and interests) and revenue (taking into account our prospect of tax
revenue) of the State that will increase the financial GAP.
Note that our projection of the net debt is more prudential9 compared to the one in the "
Economic and Finance Document" for 2020. However, by applying the same prudential
method to 2021, there is a marked worsening of the public financial GAP, which makes it
more serious compared to both what is estimated for 2020 and in the " Economic and
Finance Document ".
8
Sterilizing, therefore, also any "downgrades" by the RATING AGENCIES.
9
Prudential because does not take into consideration other variations of public expenses, such as healthcare
expenditures.
8The overall impact
The results are then summarized in graph 1.
Graph 1 – Income and expenditure trend 2016-2021, Best/Worst scenario
Source: Vision
As for the graph, we, therefore, envisage a financial gap which can be as large as 100 billion
EURO (which would be around 6,2% of the GDP) in the “best scenario” which can be more
than doubled in the worst. This would lead the Republic of Italy’s bonds in a PRE-DEFAULT
situation.
The impact would be not less dramatic for the EURO area itself which would face a much
worse crisis than the one faced in 2012 with the rescue of the sovereign debt with the ECB’s
quantitative easing. This is because Italy is certainly is a much bigger financial problem to
be swallowed and the munitions of the monetary policy have been almost entirely depleted.
The outcome entirely depends on a complex game whose determinants are:
a) the quality of the re-opening of the system;
b) the credibility with the EU institutions;
c) the scope of the reforms needed to cover a large financial gap.
The various negotiations have produced a series of instruments to manage the crisis, and
those are
• SURE / ESM Pandemic Crisis Support / EIB Guarantee Fund for Workers and
Businesses: € 540 billion
• Next Generation EU: € 750 billion
The second appears to be more ambitious (both considering the resources and the fields of
applications). However, the effects, whether adequately used, are going to have some
impacts since 2021, and in the same 2021 these might be not fully realized (this instrument
increases the 2021-2027 EU budget). The bulk of the funding (around 80%) will be used to
support public investment and key structural reforms in the Member States. This makes the
9instruments clearly positive, but at the same time, the totality of the positive results will be
visible later rather than sooner.
Moreover, it is necessary to underline that what presented above derives from the draft of
the European Commission. Many changes can occur during the following negotiation and
approval by the Member States. This section might be changed according to the occurred
modifications.
A more immediate and direct impact might be generated by the use of the other instrument,
especially the MES. However, the politic and economic conditionalities connected to this
instrument are a strong disincentive to its usage.
IMPLICATIONS: DEEP REFORM AS A MORAL IMPERATIVE
Considering the strong negative impact on the Italian economy of pandemic COVID19, it is
fundamental to organize the s-lockdown as carefully as it is possible to prevent the further
diffusion of the virus, but at the same time it is also essential to produce those economic
and social reforms able to finally generate a strong GDP growth and guarantee the social
cohesion, fundamental preconditions for a better and fastest end of the actual crisis.
The option to go “back to normal” is simply not existent.
The pandemic simply remembers us that
a) it is irrational to spend 4,5 times more in pensions than in education10
b) it was illogical to move scarce resources away from local administrations (the front
line of the crisis) and towards central administration (the hypertrophic back office);
c) it would have been fundamental the percentage of public expenditures spent on
expenditures (while all the other European countries have increased it);
d) it is counterproductive to tax more labour and companies, and less property assets,
benefits and inherited capitals.
The numbers VISION is elaborating suggest that for Italian economy and society is essential
not to waste another crisis (like Italy and most of Europe may have done with the 2007 –
2008 financial one). In order to survive, we want to dramatically change the way we allocate
scares resources to different policies, move away from long lasting privileges, reward
innovation and knowledge.
10
In no other country the ratio reaches 3.
10Methodology:
1. Nominal GDP vs. Value Added
We performed a regression on the Value added of Italian productive sectors for the years
2008-2017 and the Italian GDP for the same period.
The regression coefficient is around +1.07 and is significant with a p-value lower than 0.01.
A rise by 1 million euro of value added will increase the nominal GDP by 1.067 million euro.
We can also observe a high value of R-squared which means that the explanatory variable
(Value added of Italian productive sectors) explains well the dependent variable (Italian
GDP).
Below the regression results are summarized:
Regression Statistics
Multiple R 0.950106
R Square 0.902701
Adjusted R Square 0.890538
Standard Error 15037.92
Observations 10
Coefficients Standard Error t Stat P-value
Intercept 853,805 91696.91384 9.311165 1.44E-05
Valore aggiunto
(x) 1.067797337 0.123944241 8.615143 2.55E-05
2. Tax Revenues vs. previous year GDP
We performed a regression analysis on Italian tax revenues for the period 2005 – 2019 and
the Italian GDP for the period 2004-2018.
The time lag between the two variables is explained by the calculation behind income taxes:
taxes paid during the current year are calculated on the previous year income (net of the
due settlement).
The coefficient of regression is around 0.42, meaning that an increase in nominal GDP of 1
million euros translates into a tax revenues increase of 400 thousand euros. The coefficient
has a p-value of 0.002 (< alpha = 0.01) and thus is significant.
By looking at the R-squared we are confident that the independent variable (in this case,
GDP) explains well the dependent variable.
Below the main regression results are summarized:
Regression Statistics
Multiple R 0.913186988
R Square 0.833910475
Adjusted R Square 0.821134357
Standard Error 15849.54269
Observations 15
11Coefficients Standard Error t Stat P-value
Intercept -231302.0303 83976.59073 -2.754363189 0.016400538
PIL
(x) 0.418180793 0.051761138 8.079049493 2.00761E-06
3. IRPEF vs. GDP previous year
We proceeded with our analysis of the correlation between tax revenues and GDP by taking
into consideration the tax revenues coming from the application of the IRPEF.
The concept of time lag between variables also applies here.
Thus, we considered Italian IRPEF revenues for the period 2005-2019 and we regressed
these data on the 2004-2018 Italian GDP.
The coefficient of regression is around 0.18 and it is significant (p-value < 0.01).
The R-squared is significantly high, close to 90%.
Below the main regression results are summarized:
Regression Statistics
Multiple R 0.942735
R Square 0.888749
Adjusted R Square 0.880191
Standard Error 5344.746
Observations 15
Coefficients Standard Error t Stat P-value
Intercept -121898.3717 28318.39347 -4.30457 0.000856
PIL
(x) 0.177878108 0.017454772 10.1908 1.44E-07
4. IVA vs. GDP current year
Finally, we performed a regression analysis on VAT revenues (IVA) on Italian GDP,
considering the period 2005-2019. Here, given that the VAT is paid on current year
purchases, the time lag does not apply.
The results show a coefficient of regression of around 0.10 which is significant at alpha =
0.01.
Looking at the R-squared, we are quite confident that the explanatory variable explains well
the VAT revenues (R-squared close to 90%).
12Below the main regression results are summarized:
Regression Statistics
Multiple R 0.946655108
R Square 0.896155894
Adjusted R Square 0.888167886
Standard Error 2831.18413
Observations 15
Coefficients Standard Error t Stat P-value
Intercept -48628.22039 15881.52218 -3.06194 0.009089
PIL
(x) 0.102285784 0.009657011 10.59187 9.2E-08
5. Unemployment growth vs. GDP growth
In order to estimate the unemployment growth over the period 2019-2021 we applied the
Okun’s Law by regressing the historical Italian unemployment growth rates (2006-2019) on
the historical GDP growth rate data.
The results confirmed the above-mentioned law: the coefficient of regression is negative
(around -4.4) and it is significant (p-value < 0.01).
The tables below summarize the main regression results:
Regression Statistics
Multiple R 0.802912
R Square 0.644668
Adjusted R Square 0.615057
Standard Error 0.070622
Observations 14
Coefficients Standard Error t Stat P-value
Intercept 0.081682473 0.022580491 3.617391 0.003531
Crescita del PIL
(x) -4.408735838 0.944871042 -4.66597 0.000545
6. Social security expenses vs. Unemployment growth
In order to estimate the expenditure that the Italian state will have to incur for social
assistance over the period 2020-2021, we performed a regression analysis using the
historical social safe expenses for the years 2007-2016 and the unemployment rates for the
same historical period.
The results confirm the existence of a significant correlation between the two variables: the
coefficient of regression is positive and significant, with a p-value lower than 0.01.
13The tables below summarize the regression output:
Regression Statistics
Multiple R 0.853908
R Square 0.729159
Adjusted R Square 0.695304
Standard Error 2828.162
Observations 10
Coefficients Standard Error t Stat P-value
Intercept 1653.337267 3816.413637 0.433218 0.6763
Unemployment rate % (x) 178725.9077 38511.31563 4.640867 0.001664
14BIBLIOGRAPHY
Ball M. L., Leigh D., Loungani P., Okun’s Law: Fit at 50?, IMF Working Paper No. 13/10,
2013
https://www.imf.org/en/Publications/WP/Issues/2016/12/31/Okun-s-Law-Fit-at-50-40236
Clausing K.A., Corporate tax revenues in OECD countries, Int Tax Public Finan 14, 115–
133, 2007
https://doi.org/10.1007/s10797-006-7983-2
Istat, I.Stat
http://dati.istat.it/Index.aspx#
Ministero dell’Economia e delle Finanze, Economic and Finance Document, 2020
http://www.mef.gov.it/documenti-pubblicazioni/doc-finanza-pubblica/index.html
Vision, COVID19: Problemi e proposte per il bene (del) Comune, 2020
https://www.thinktank.vision/publications-events/publications/covid-19-problemi-e-
proposte-per-il-bene-del-comune.html
Vision, Il Fisco del Futuro, 2019
https://www.thinktank.vision/publications-events/publications/costruire-un-sistema-fiscale-
all-altezza-del-21esimo-secolo.html
Vision, La pandemia: una battaglia da vincere adesso, 2020
https://www.thinktank.vision/publications-events/publications/la-pandemia-una-battaglia-
da-vincere-adesso.html
15You can also read