Correlation Between Apparent Diffusion Coefficient Value on MRI and Histopathologic WHO Grades of Neuroendocrine Tumors
←
→
Page content transcription
If your browser does not render page correctly, please read the page content below
Mebis W, et al. Correlation Between Apparent Diffusion Coefficient Value on MRI
                                             and Histopathologic WHO Grades of Neuroendocrine Tumors. Journal of the Belgian
                                             Society of Radiology. 2020; 104(1): 7, 1–9. DOI: https://doi.org/10.5334/jbsr.1925

ORIGINAL ARTICLE

Correlation Between Apparent Diffusion Coefficient
Value on MRI and Histopathologic WHO Grades of
Neuroendocrine Tumors
Wouter Mebis, Annemiek Snoeckx, Bob Corthouts, Haroun El Addouli, Simon Nicolay,
Astrid Van Hoyweghen, Maarten Spinhoven and Bart Op de Beeck

Background: The correlation of diffusion-weighted MRI and tumor aggressiveness has been established for
different tumor types, which leads to the question if it could also apply for neuroendocrine tumors (NET).
Purpose: To investigate the possible correlation between apparent diffusion coefficient (ADC) value on
magnetic resonance imaging (MRI) and histopathologic WHO-grades of NET.
Material and Methods: Electronic patient records from patients presented at the multidisciplinary neuro-
endocrine tumor board between November 2017 and April 2019 were retrospectively reviewed. Patients
with both available MR imaging (primary tumor or metastasis) and known WHO tumor grade were included
(n = 47). Average and minimum ADC values (avgADC; minADC) were measured by drawing a freehand ROI
excluding only the outermost border of the lesion. The largest axial size (primary tumor) or most clearly
delineated lesion (metastasis) was used.
Results: Forty seven patients met the inclusion criteria (mean age 59 ± 12 SD; 24F/23M). Twenty one
patients (45%) were diagnosed with WHO G1 tumor, 17 seventeen with G2 (36%) and nine with G3
(19%) tumor. Twenty eight primary tumors and 19 metastases were measured. A significant difference
was found between low-grade (G1+G2) and high-grade (G3) tumors (Mann-Whitney; avgADC: p < 0,001;
minADC: p = 0,001). There was a moderate negative correlation between WHO-grade and avgADC/minADC
(Spearman; avgADC: –0,606; 95% CI [–0,773; –0,384]; minADC: –0,581; 95% CI [–0.759; –0.353]).
Conclusion: Our data show a significant difference in both average and minimum ADC values on MRI
between low and high grade NET. A moderate negative correlation was found between histopathologic
WHO grade and ADC value.

Keywords: apparent diffusion coefficient; magnetic resonance imaging; neuroendocrine tumor;
histopathological grade; quantitative

Introduction                                                   stage due to the symptomatology related to production
Neuroendocrine tumors (NET) are derived from neural            of hormones. Non-functional NET are more often found
crest cells that are diffusely distributed throughout the      incidentally or remain undetected until a later stage when
human body. This explains the various primary NET loca-        symptoms arise from locoregional mass effect or distant
tions including lung/bronchus, pancreas, small intestine,      metastases. The natural disease progression, therapeutic
colon and rectum. NET are relatively rare, accounting for      response, and survival varies among different primary
0.46% of gastrointestinal, pancreatic and lung malignan-       tumor locations, functional state, and more importantly,
cies [1]. The incidence and prevalence of NET has increased    histopathological grade [1–3].
over time due to increased diagnosis and better survival          Different histopathological grading systems exist, with
respectively. Data from the United States Surveillance,        the European Neuroendocrine Tumor Society (ENETS)
Epidemiology, and End Results (SEER) program indicate          and World Health Organization (WHO) criteria being the
a NET incidence of 6.98 per 100,000 [2]. NET can be            most widely accepted. In this study we used the recently
subdivided according to their functional activity (based on    revised WHO 2017 grading system for pancreatic NET and
the production of hormones) or histopathological grade.        the WHO 2010 grading system for all other NET. The WHO
Functional NET are often detected in a relatively early        grading system is based on the Ki67 and mitotic indices
                                                               to classify NET into low (G1), intermediate (G2), and high
                                                               grade (G3) tumors [4].
University Hospital Antwerp, BE                                   The Ki67-index is a proliferation index based on the
Corresponding author: Wouter Mebis                             presence of the Ki-67 cellular marker in proliferating cells.
(woutermebis_1@hotmail.com)                                    Its presence can be demonstrated by immunostaining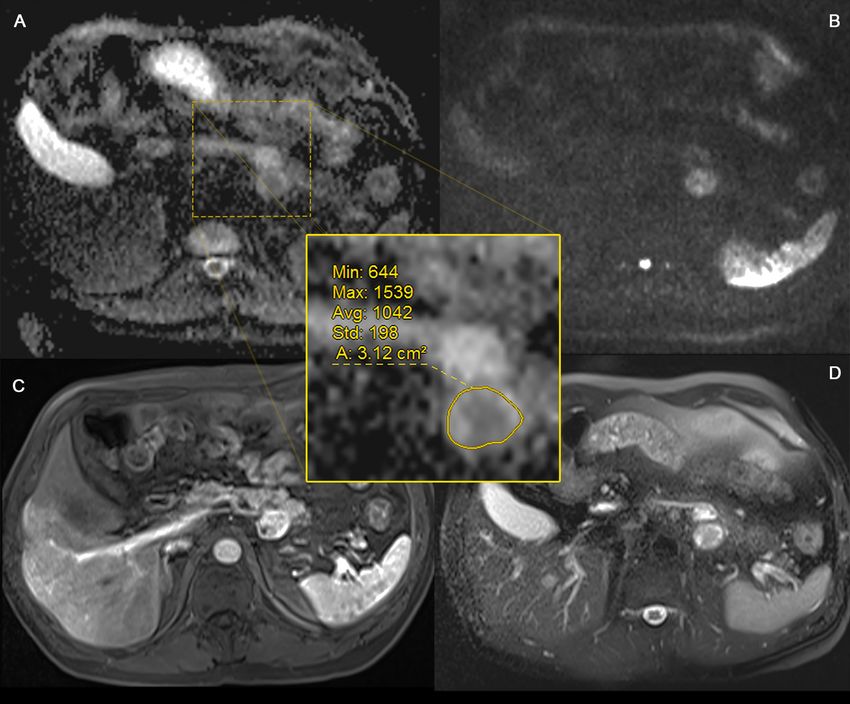
Art. 7, page 2 of 9                Mebis et al: Correlation Between Apparent Diffusion Coefficient Value on MRI and Histopathologic
                                                                                            WHO Grades of Neuroendocrine Tumors

with monoclonal anti-Ki-67 antibodies. The percentage                 Numerous small studies indicate that similar findings may
of Ki-67 positive cells is determined in tumor hot spots              apply to NET but validation of these studies is still needed
where a minimum of 500 cells is counted. The mitotic                  [9–18].
index is the number of mitoses counted per high power
field (HPF). Generally, mitoses are counted in 50 HPF and             Purpose
the mitotic index is expressed in mitoses per 10 HPF [5].             To investigate the possible correlation between average
   The 2017 update for pancreatic NET altered the cut-                and minimum ADC values of NET on MRI and the histo-
off value for NET G1 and added a subclassification of G3              pathological WHO grade and to determine if ADC values
tumors dividing them into well-differentiated G3 NET                  may help differentiate between low (G1 and G2) and high
and poorly-differentiated G3 neuroendocrine carcinomas                (G3) grade NET.
(NEC). The different cut-off values are demonstrated in
Table 1 [4].                                                          Materials and Methods
   The diagnosis and characterization of NET is based                 Case selection
on both laboratory testing with serum markers such as                 For this retrospective study we included patients that were
Chromogranin A (and specific hormone levels for func-                 presented at the Multidisciplinary Neuroendocrine Tumor
tional NET) and multimodality imaging. Different imag-                Board. This tumor board is part of a collaborative NETwork
ing techniques are available including ultrasound (US),               that has been set up between nine regional hospitals and
computed tomography (CT), magnetic resonance imaging                  the Antwerp University Hospital.
(MRI) and functional/nuclear imaging such as somatosta-                 Ethical approval for this study was obtained from
tin receptor imaging and positron emission tomography                 the Institutional Review Board (EC nr. 18/43/491) and
(PET). The combination of PET and CT (PET/CT) with differ-            informed consent was waived due to the retrospective
ent tracers can be especially valuable in NET staging and             nature of the study.
detection of metastases. Fluorine 18 fluorodeoxyglucose                 Elelectronic medical files from patients with a known
(FDG) PET/CT tracer is widely used in oncologic imaging               NET discussed on the tumor board between November
but appears to be of limited value in well-differentiated             2017 and April 2019 were analyzed retrospectively by a
NET because of the near normal glucose turnover. NET that             senior radiology resident and radiology staff member in
do not show a high uptake on 18F-FDG-PET, can be inves-               consensus. Only patients with available MRI (primary
tigated with a number of somatostatin analogs labelled                tumor or metastasis), lesion size larger or equal to 1 cm,
with Gallium 68 (68Ga) (i.e. 68Ga-DOTA-NOC) which bind                and known WHO tumor grade were included (n = 47).
to the somatostatin receptors that are expressed at the
cell membrane of NET. High grade NET are more often                   Data collection and image analysis
detected by 18F-FDG PET/CT and thus FDG avidity can be                First, the following clinical parameters were noted in an
an indicator of tumor aggressiveness [6].                             Excel worksheet: age, sex, primary tumor location, pres-
   MRI has been used in the characterization of NET but               ence of metastasis, and WHO tumor grade (taken from
mostly on a morphological, qualitative basis with evalu-              pathology report).
ation of tumor size, borders, signal intensity, absence or              Next, the technical parameters of the MRI exams were
presence of cystic or necrotic components, and enhance-               registered in the same worksheet (vendor, model, field
ment pattern. More advanced MR imaging techniques                     strength, and employed b-values). This includes Siemens
such as diffusion-weighted imaging (DWI) and more                     1.5T (n = 29), Siemens 3T (n = 11), Philips 1.5T (n = 4),
importantly, quantitative evaluation of apparent diffusion            Philips 3T (1) and GE 1.5T (n = 2) with a b value sequence
coefficient (ADC) mapping may have an added value. The                of 50-600-1000 sec/mm² and 0–1000 sec/mm² being the
correlation of ADC values and tumor cellularity or aggres-            most frequently used.
siveness/prognosis has been investigated extensively                    The image analysis was done by a senior resident
in other tumor types (i.e. prostate adenocarcinoma [7]                under supervision of a radiology staff member with
and astrocytic brain tumors [8]) where ADC values nega-               more than ten years of experience in abdominal imaging.
tively correlate with tumor cellularity and aggressiveness.           Measurements were performed on a picture archiving and

Table 1: WHO Classification for Neuroendocrine Neoplasms (2010–2017).

       Grade            Ki67-index (%)        Mitotic index (mitoses/10 HPF)           Differentiation
       WHO            2010   2017 (pNET)               2010        2017 (pNET)
       NET G1          ≤2             20                >20               >20          Well differentiated
       NEC G3                        >20                                  >20          Poorly differentiated (small/large cell)
The most notable differences of the 2010 and 2017 World Health Organization (WHO) classification system for NET is the increase of
  the Ki67-index cut-off value for G1 NET to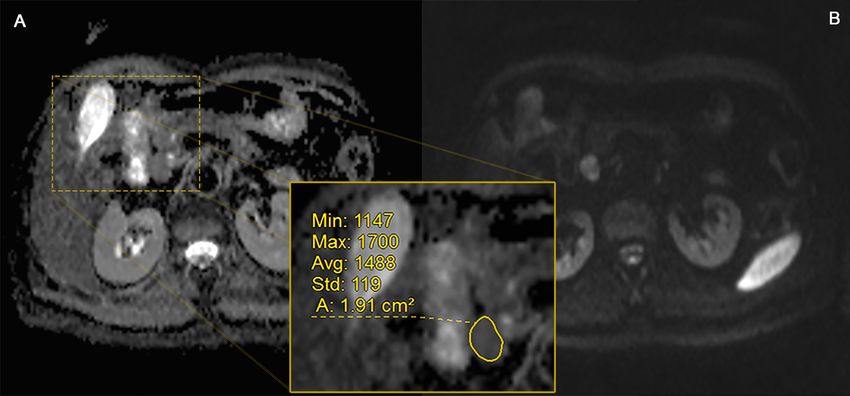
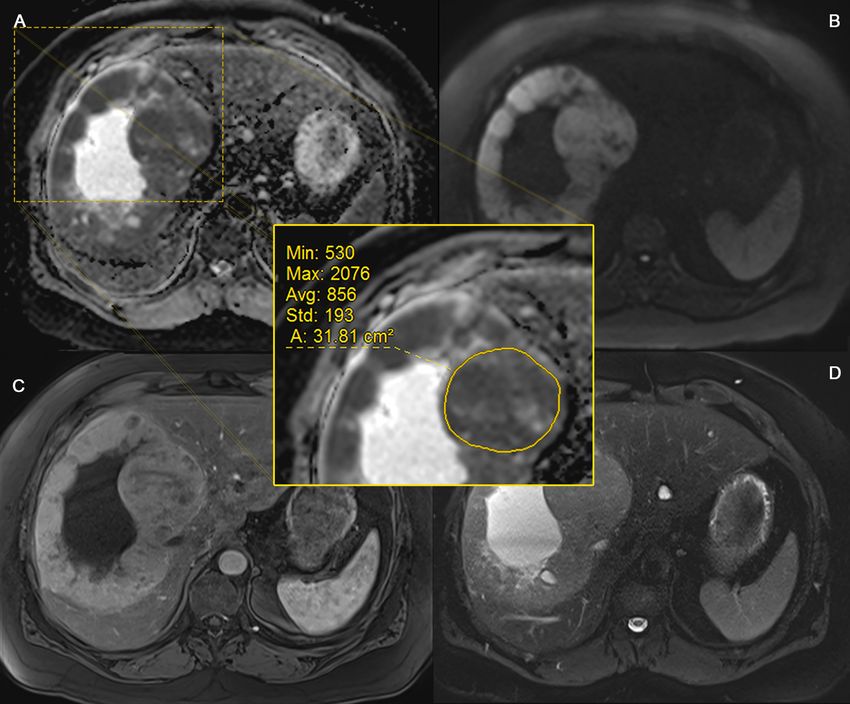
Mebis et al: Correlation Between Apparent Diffusion Coefficient Value on MRI and Histopathologic            Art. 7, page 3 of 9
WHO Grades of Neuroendocrine Tumors

communicaion system (PACS) workstation suited for clini-           regions were omitted. In very large lesions with central
cal use (GE RIS/PACS). Average and minimum ADC values              necrosis, the ROI was drawn in the area with the highest
(avgADC; minADC) were measured by drawing a freehand               intensity on the corresponding high b-value DWI series. In
region of interest (ROI) on either the center slice of the         patients with MRI of both primary tumor and metastasis,
lesion or the level with the least artifacts (Figures 1–3).        separate ROIs were drawn for each and the corresponding
The T2-weighted images, DWI and contrast-enhanced                  ADC values were noted in the Excel worksheet.
T1-weighted images were used as a side by side reference.            Data were first sorted by WHO grade group and subse-
In case of multiple lesions (i.e. liver metastases) only the       quently grouped together into low grade NET (WHO G1
largest, most clearly delineated lesion was selected. The          and G2) and high grade NET (WHO G3) for further statisti-
outermost border of the lesion and cystic or necrotic              cal analysis. When ADC values of both primary tumor and

Figure 1: ROI placement (grade 1). Axial ADC map (A) and DWI b1000 (B) image with ROI placement along the borders
  of a WHO G1 lesion (resection proven paraduodenal metastasis) in a 52-year-old female.

Figure 2: ROI placement (grade 2). Axial ADC map (A), DWI b1000 (B), arterial phase T1- weighted (C) and fat sup-
  pressed T2-weighted (D) images of a biopsy proven G2 NET in a 46-year-old male. ROI placement with exclusion of
  the outermost border of the lesion to avoid artefacts.
Art. 7, page 4 of 9            Mebis et al: Correlation Between Apparent Diffusion Coefficient Value on MRI and Histopathologic
                                                                                        WHO Grades of Neuroendocrine Tumors

Figure 3: ROI placement (grade 3). Axial ADC map (A), DWI b1000 (B), arterial phase T1-weighted (C) and fat-sup-
  pressed T2-weighted (D) images of a biopsy proven G3 NET (primary tumor location = pancreas) in a 55-year-old
  male. Images show a large liver metastasis with cystic/necrotic centre: ROI placement in the border of the lesion,
  avoiding the cystic portion and the outermost edges.

metastasis were available, the values chosen for analysis     Table 2: Measured lesion type and location.
were those that matched the origin of the histopathologic
specimen (i.e. biopsy of liver metastasis: ADC values of                 Type               Organ                  n
metastasis).                                                             Primary tumor      Pancreas             24
                                                                                            Small intestine        1
Statistical analysis
Statistical analysis was conducted in SPSS Statistics                                       Rectum                 3
(V25 – IBM). Non-parametric testing (Mann-Whitney-U)                     Metastasis         Liver                 17
was used to compare differences in avgADC and minADC                                        Paraduodenal           1
between low and high grade NET. Correlation between
                                                                                            Mesenteric             1
avgADC and minADC values and WHO grade was deter-
mined separately using R (V3.5.2 – The R Project for                     Total                                   47
Statistical Computing) to compute Spearman’s rank
correlation coefficient with 95% confidence intervals.        47.6% of G1 tumors, in 76.5% of G2 tumors and in all G3
Receiver-operating characteristic (ROC) analysis was per-     tumors.
formed using MedCalc for Windows (V15.1 – MedCalc               The distribution of avgADC and minADC values per
Software, Ostend, Belgium) to estimate the area under         WHO grade (separate and low vs high grade) are illustrated
the curve (AUC) with DeLong non-parametric method.            in Figure 4. The median avgADC value per grade group
Optimal cut-off values were determined according to the       was G1: 1.142 (interquartile range (IQR) 0.347), G2: 0.956
Youden index.                                                 (IQR 0.303) and G3: 0.767 (IQR 0.315). The median
                                                              minADC value per grade group was G1: 0.824 (IQR 0.429),
Results                                                       G2: 0.581 (IQR 0.371) and G3: 0.324 (IQR 0.244).
There were 47 patients included with a mean age of 59           A significant difference was found between low-grade
(±12 SD; 30–88) with 24 males and 23 females. The final       (G1+G2) and high-grade (G3) tumors (Mann-Whitney;
values that were used for analysis (after biopsy location     avgADC: p < 0.001; minADC: p < 0.001). Separate, pair-
matching) included 28 primary tumors and 19 metasta-          wise testing of WHO grades (Kruskal-Wallis) only showed a
ses (Table 2). WHO grade distribution was 21 G1, 17 G2        significant difference between G1 and G3 for both avgADC
and nine G3 tumors or 38 low grade (G1+G2) and nine           and minADC (p < 0.001). There was a moderate negative
high grade (G3) tumors. Metastatic disease was present in     correlation between WHO-grade and avgADC/minADC
Mebis et al: Correlation Between Apparent Diffusion Coefficient Value on MRI and Histopathologic Art. 7, page 5 of 9 WHO Grades of Neuroendocrine Tumors Figure 4: Boxplots of avgADC and minADC values per WHO grade. Boxplots illustrate the difference of avgADC and minADC values per WHO grade and low- vs. high-grade NET respectively. High-grade NET demonstrate lower ADC values than low-grade NET, but some overlap can be seen. Figure 5: ROC curve analysis. ROC-curve analysis of avgADC and minADC demonstrates good accuracy of both values with calculated area under the curve (AUC) of 0.871 (p < 0.001). (Spearman’s Rank; avgADC: –0.606; 95% CI [–0.773 to generate 100% sensitivity (SE) and 65.8% specificity (SP) –0.384]; minADC: –0.581; 95% CI [–0.759 to –0.353]). for avgADC and 77.8% SE and 86.8% SP for minADC. The ROC-curve analysis was performed for low grade vs high corresponding positive and negative predictive values grade NET yielding an equal area under the curve (AUC) (PPV; NPV) are 40.9% PPV and 100% NPV for avgADC and of 0.871 (95% CI [0.741; 0.951]) for both avgADC and 58.3% PPV and 94.3% NPV for minADC. minADC as illustrated in Figure 5. The optimal cut-off values were determined as ≤0.957 × 10⁻³ mm²/s (95% CI Discussion [≤0.935 to ≤0.957]; Youden index J 0.6579) for avgADC Treatment strategy for NET is related to the histological and ≤0.378 × 10⁻³ mm²/s (95% CI [≤0.324 to ≤0.626]; tumor grade and more specific the differentiation Youden index J 0.6462) for minADC. These cut-off values between low grade (WHO G1 and G2) and high grade (G3)
Art. 7, page 6 of 9                     Mebis et al: Correlation Between Apparent Diffusion Coefficient Value on MRI and Histopathologic
                                                                                                 WHO Grades of Neuroendocrine Tumors

tumors [11]. Low grade NET can be treated with surgical                     G2 (p = 0.058) or G2 and G3 (p = 0.117). This was also
resection and/or targeted therapy for example somatosta-                    the case for Pereira et al. [16] (G2 vs. G3) and Besa et al.
tin analogs, receptor targeted radionuclide agents, bevaci-                 [9] (G1 vs. G2 and G2 vs. G3). Lotfalizadeh et al. [14] and
zumab, sunitinib, and everolimus [3, 6]. High grade NET                     Kulali et al. [13] found significant differences between all
are treated with platinum-based chemotherapy. Alterna-                      separate grade groups. Few studies include the minADC
tive treatment strategies in inoperable patients include                    values like in our study [9, 14]. Besa et al. [9] found simi-
radiofrequency ablation, transarterial chemoemboliza-                       lar minADC values whereas Lotfalizadeh et al. [14] found
tion, and radioembolization. Both treatment strategy and                    higher minADC values (Table 3). We found a significant
prognosis are strongly dependent on histological grade                      difference in minADC between low-grade (G1+G2) and
with a poorer prognosis and higher metastatic rate for G3                   high-grade (G3) NET and between G1 versus G3 NET
tumors [9, 11]. The possibility to predict tumor grade on                   (p < 0.001) when comparing groups separately. There was
a noninvasive basis and without ionizing radiation would                    no significant difference in minADC between G1 and G2
certainly be advantageous. Early risk stratification can help               (p = 0.110) and G2 and G3 (p = 0.089), similar to what Besa
with disease management and prevents treatment delay.                       et al. reported [9].
   The purpose of this study was to evaluate the correla-                      Min et al. [15] did not compare differences between
tion of ADC values on MRI with the histopathologicaly                       groups but found a significant (p < 0.001) moderate nega-
based WHO grading. Our results show a significant dif-                      tive correlation between avgADC and WHO grade (–0.57),
ference in both avgADC and minADC values between low                        in concordance with the negative correlation of –0.61 we
grade (G1+G2) and high grade (G3) NETs. These findings                      found and the negative correlation of –0.55 Lotfalizadeh
are in line with other studies that compared G1+G2 vs G3                    et al. reported [14]. Besa et al. [9] found a significant but
NET [9, 11, 13, 14, 17, 18]. We chose to compare G1+G2 vs                   weaker negative correlation of –0.33. Others reported a
G3 because of the different treatment and prognosis of                      negative correlation between avgADC and Ki67-index
these groups as mentioned above. However, some stud-                        (Guo et al. [11]: –0.41, Wang et al. [17]: –0.70). The
ies have chosen to compare G1 vs. G2+G3 NET [10, 12]                        avgADC and minADC values we found per WHO grade
or compare each group separately [13, 14, 16, 19]. When                     were similar to the values found by previous studies and
comparing differences in avgADC between separate WHO                        are summarized in Table 3. Only the values acquired by
grade groups we could only find a significant difference                    Lotfalizadeh et al. [14] are markedly higher. The observed
between G1 and G3 (p < 0.001) but not between G1 and                        differences are probably multifactorial with not only

Table 3: Comparison of avgADC and minADC values with previous studies.

 Author                  n NET              avgADC (×10–3 mm²/s) mean ± SD                       minADC (×10–3mm²/s) mean ± SD
                      (G1, G2, G3)          G1                  G2                  G3             G1                 G2         G3
 Mebis et al.                     47      1.18 ± 0.31      0.95 ± 0.18          0.76 ± 0.15     0.79 ± 0.25    0.60 ± 0.24     0.34 ± 0.15
 2020                     (21, 17, 9)
                                                  1.08 ± 0.28                                           0.71 ± 0.26
 Besa et al.                     48       1.47 ± 0.63      1.27 ± 0.63          0.87 ± 0.43     0.84 ± 0.55    0.50 ± 0.48     0.27 ± 0.41
 2016                    (25, 16, 7)
 Guo et al.                      59              1.09 ± 0.13                    0.85 ± 0.23                                /
 2017                   (34, 13, 12)
 De Robertis                     55       1.29 ± 0.47                1.09 ± 0.28                                           /
 et al. 2017             (31, 20, 4)
 Min et al.                        63           1.06*               0.82*              0.59*                               /
 2018                     (3, 27, 33)     (1.05–1.19)          (5.6–1.42)       (0.26–0.95)
 Jang et al.                  34                1.48°                        1.04                                          /
 2014             (20, 14 G2+G3)         (0.91–2.51)                 (0.48–1.92)°
 Lotfalizadeh                   108       2.13 ± 0.70      1.78 ± 0.72          0.86 ± 0.22     1.52 ± 0.59    1.33 ± 0.49     0.78 ± 0.22
 et al. 2016            (55, 42, 11)
 Pereira et al.                   22      1.28 ± 0.27#     0.89 ± 0.39#         0.73 ± 0.23 #                              /
 2015                      (15, 4, 3)
 Wang et al.                    18               1.75 ± 0.53                    1.00 ± 0.19                                /
 2011                 (12 G1+G2, 6)
 Kulali et al.                   30       2.32 ± 0.15      1.29 ± 0.15          0.88 ± 0.15                                /
 2017                    (9, 10, 11)
 Kim et al.                      39       1.60 ± 0.41      1.24 ± 0.13                    /                                /
 2013                    (24, 12, 3)
* median (range); ° mean (range); # mean ± SE (standard error).
Mebis et al: Correlation Between Apparent Diffusion Coefficient Value on MRI and Histopathologic Art. 7, page 7 of 9
WHO Grades of Neuroendocrine Tumors
tumor heterogeneity, relatively small sample size, techni- (≤0.378 × 10⁻³ mm²/s) and yielded lower SE, SP, PPV, and
cal differences (i.e. field strength, b-values), and measur- NPV. This difference in minADC value could be explained
ing methods (i.e. center slice or volumetric). by the fact that the minimum value is only a single value
Expanding on the abovementioned technical differ- that is more prone to artefacts and ROI placement than
ences, it is interesting to see that despite the different an average value.
vendors, field-strengths, and b-values that were used, the We acknowledge several limitations of our study. First,
acquired ADC values were similar to what most other the retrospective nature of the study comes with a num-
authors found (some of them using only one device and ber of disadvantages including selection bias, lack of
some using multiple devices). We assume that the tech- standardization of imaging techniques and equipment,
nical differences cause added noise in the data but are and possible influence of already initialized treatment.
too small to have an effect on the final results. A direct Secondly, ROI placement was performed in consensus
comparison between vendors, field-strengths, and b-val- and not repeated meaning intra- and interobserver agree-
ues would be interesting but is hard to achieve given the ment could not be tested. Image analysis was not entirely
small sample size. Achieving similar results with differ- blinded for WHO-grade (as patients reviewed were dis-
ent machines might facilitate the implementation of the cussed on the tumor board). Thirdly, although comparable
acquired values in daily practice. to other studies, the sample size of G3 NET was relatively
The decrease in ADC values in high-grade tumors can small. The latter can both be explained by the rarity of
be attributed to the increased cellularity with decreased G3 tumors and the fact that during initial selection it
extracellular space and cytoplasmic volume (high nucleus- became evident that most G3 patients did not have an
to-cytoplasm ratio) restricting the movement of water MRI exam but had an 18F-FDG-PET-CT followed by debulk-
molecules [16, 17]. Other factors such as fibrosis can also ing or resection, often after neoadjuvant systemic treat-
contribute to a lower ADC and might be an explanation ment. Consequently G3 sample size was also too small
for the lower ADC values in some low grade, well-differen- to compare differences between G3 NET and G3 NEC as
tiated tumors [17]. determined by the WHO 2017 criteria. Histopathologic
We found a good accuracy of avgADC and minADC grade was derived from the multidisciplinary staff
in predicting G3 vs G1+G2 NET with an AUC of 0.871 report or pathology report without extra information
for both. Other studies found similar values: Besa et al. about the cellularity or possible fibrosis, which could
[9]: 0.80 and 0.76, Guo et al. [11]: 0.90 and Lotfalizadeh explain some of the heterogeneity (as reported by [17]).
et al. [14]: 0.96 and 0.83. A meta-analysis performed Ki-67-index was often reported as a range instead of a
by Zong et al. [18] showed a summary AUC of 0.94 for single percentage making it unreliable for stratification.
predicting G3 from G1+G2 tumors. The ‘optimal’ cut-off Histopathologic diagnosis was based on both surgical
values we acquired (according the Youden index) were resection and biopsy, the latter being less reliable. We did
≤0.957 × 10⁻³ mm²/s for avgADC and ≤0.378 × 10⁻³ not compare the ADC values to normal tissue/negative
mm²/s for minADC. A comparison of these values and controls, however in some cases this would not have been
their associated SE, SP, PPV, and NPV with results of other possible (i.e. diffuse liver metastasis). Finally, the defined
authors is summarized in Table 4. Our cut-off value for cut-off values and their corresponding predictive statistics
meanADC was similar to the one Guo et al. [11] found should be interpreted with caution because of the small
(≤0.950 × 10⁻³ mm²/s) whereas other studies reported sample size and the unknown prevalence of G3 NET in the
cut-off values that are slightly higher [9, 13, 14]. The general population. The prevalence used to calculate PPV
SE and NPV for avgADC (both 100%) in our study were and NPV values is based on the prevalence of G3 NET in
comparable but SP and PPV are lower. Only one study our study (19%), which is similar to the percentage found
[9] reported a cut-off value for minADC (≤0.150 ×10⁻³ in larger population studies [2, 4] but this still needs to
mm²/s) which is markedly lower than the value we found be verified.
Table 4: Comparison of cut-off values and diagnostic performance.
Author avgADC minADC
Cut-off SE SP PPV NPV Cut-off SE SP PPV NPV
×10–3 mm²/s % % % % ×10–3 mm²/s % % % %
Mebis et al. 2020 ≤0.957 100 65.79 40.91 100 ≤0.378 77.78 86.84 58.33 94.29
Besa et al. 2016 ≤1.24 100 84.21 59.77 100 ≤0.15 50.00 84.21 42.62 87.78
Guo et al. 2017 ≤0.950 72.3 91.6 66.88 93.38 /
Lotfalizadeh et al. 2016 ≤1.19 100 92 74.57 100 /
Kulali et al. 2017 ≤1.20 100 84.20 59.75 100 /
PPV and NPV values in italic are calculated post-hoc (with estimated prevalence of 19%)
Average ADC value (avgADC), minimum ADC value (minADC), sensitivity (SE), specificity (SP), positive predictive value (PPV), negative
predictive value (NPV).Art. 7, page 8 of 9 Mebis et al: Correlation Between Apparent Diffusion Coefficient Value on MRI and Histopathologic
WHO Grades of Neuroendocrine Tumors
Conclusion and enhancement ratios for characterization of his-
We are able to confirm the assumed negative correlation topathologic grade. J Magn Reson Imaging. 2016;
between ADC values and tumor grade and found a signifi- 44(6): 1432–1441. DOI: https://doi.org/10.1002/
cant difference of avgADC and minADC between grouped jmri.25320
low-grade (G1+G2) and high-grade (G3) NET. The findings 10. De Robertis R, Cingarlini S, Tinazzi Martini P,
of our study are in line with previous studies despite the et al. Pancreatic neuroendocrine neoplasms: Mag-
aforementioned technical differences, which might facili- netic resonance imaging features according to
tate the implementation of the achieved values in daily grade and stage. World J Gastroenterol. 2017; 23(2):
practice. 275–285. DOI: https://doi.org/10.3748/wjg.v23.
i2.275
Acknowledgements 11. Guo C, Chen X, Xiao W, et al. Pancreatic neuroen-
We would like to acknowledge Kristien Wouters for her docrine neoplasms at magnetic resonance imaging:
guidance in statistical analysis. comparison between grade 3 and grade 1/2 tumors.
Onco Targets Ther. 2017; 10: 1465–1474. DOI:
Competing Interests https://doi.org/10.2147/OTT.S127803
The authors have no competing interests to declare. 12. Jang KM, Kim SH, Lee SJ, et al. The value of
gadoxetic acid-enhanced and diffusion-weighted
References MRI for prediction of grading of pancreatic
1. Man D, Wu J, Shen Z, et al. Prognosis of patients neuroendocrine tumors. Acta Radiol. 2014; 55(2):
with neuroendocrine tumor: a SEER database 140–148. DOI: https://doi.org/10.1177/028418511
analysis. Cancer Manag Res. 2018; 10: 5629–5638. 3494982
DOI: https://doi.org/10.2147/CMAR.S174907 13. Kulali F, Semiz-Oysu A, Demir M, et al. Role of
2. Dasari A, Shen C, Halperin D, et al. Trends in the diffusion-weighted MR imaging in predicting the
Incidence, Prevalence, and Survival Outcomes in grade of nonfunctional pancreatic neuroendocrine
Patients With Neuroendocrine Tumors in the United tumors. Diagn Interv Imaging. 2018; 99(5): 301–309.
States. JAMA Oncol. 2017; 3(10): 1335–1342. DOI: DOI: https://doi.org/10.1016/j.diii.2017.10.012
https://doi.org/10.1001/jamaoncol.2017.0589 14. Lotfalizadeh E, Ronot M, Wagner M, et al. Pre-
3. Kim KW, Krajewski KM, Nishino M, et al. diction of pancreatic neuroendocrine tumour
Update on the management of gastroenteropan- grade with MR imaging features: added value of
creatic neuroendocrine tumors with emphasis on diffusion-weighted imaging. Eur Radiol. 2017;
the role of imaging. AJR Am J Roentgenol. 2013; 27(4): 1748–1759. DOI: https://doi.org/10.1007/
201(4): 811–824. DOI: https://doi.org/10.2214/ s00330-016-4539-4
AJR.12.10240 15. Min JH, Kang TW, Kim YK, et al. Hepatic neuroen-
4. Chauhan A, Yu Q, Ray N, et al. Global burden of docrine tumour: Apparent diffusion coefficient as
neuroendocrine tumors and changing incidence in a potential marker of prognosis associated with
Kentucky. Oncotarget. 2018; 9(27): 19245–19254. tumour grade and overall survival. Eur Radiol. 2018;
DOI: https://doi.org/10.18632/oncotarget.24983 28(6): 2561–2571. DOI: https://doi.org/10.1007/
5. Reid MD, Bagci P, Ohike N, et al. Calculation of the s00330-017-5248-3
Ki67 index in pancreatic neuroendocrine tumors: 16. Pereira JA, Rosado E, Bali M, et al. Pancreatic
a comparative analysis of four counting method- neuroendocrine tumors: correlation between his-
ologies. Mod Pathol. 2015; 28(5): 686–694. DOI: togram analysis of apparent diffusion coefficient
https://doi.org/10.1038/modpathol.2014.156 maps and tumor grade. Abdom Imaging. 2015;
6. Sahani DV, Bonaffini PA, Fernandez-Del Castillo 40(8): 3122–3128. DOI: https://doi.org/10.1007/
C, et al. Gastroenteropancreatic neuroendocrine s00261-015-0524-7
tumors: role of imaging in diagnosis and manage- 17. Wang Y, Chen ZE, Yaghmai V, et al. Diffusion-
ment. Radiology. 2013; 266(1): 38–61. DOI: https:// weighted MR imaging in pancreatic endocrine
doi.org/10.1148/radiol.12112512 tumors correlated with histopathologic characteris-
7. Wang XZ, Wang B, Gao ZQ, et al. Diffusion- tics. J Magn Reson Imaging. 2011; 33(5): 1071–1079.
weighted imaging of prostate cancer: correlation DOI: https://doi.org/10.1002/jmri.22541
between apparent diffusion coefficient values and 18. Zong RL, Geng L, Wang X, et al. Diagnostic Perfor-
tumor proliferation. J Magn Reson Imaging. 2009; mance of Apparent Diffusion Coefficient for Pre-
29(6): 1360–1366. DOI: https://doi.org/10.1002/ diction of Grading of Pancreatic Neuroendocrine
jmri.21797 Tumors: A Systematic Review and Meta-analysis.
8. Higano S, Yun X, Kumabe T, et al. Malignant astro- Pancreas. 2019; 48(2): 151–160. DOI: https://doi.
cytic tumors: clinical importance of apparent diffu- org/10.1097/MPA.0000000000001212
sion coefficient in prediction of grade and prognosis. 19. Kim JH, Eun HW, Kim YJ, et al. Staging accuracy of
Radiology. 2006; 241(3): 839–846. DOI: https://doi. MR for pancreatic neuroendocrine tumor and imag-
org/10.1148/radiol.2413051276 ing findings according to the tumor grade. Abdom
9. Besa C, Ward S, Cui Y, et al. Neuroendocrine liver Imaging. 2013; 38(5): 1106–1114. DOI: https://doi.
metastases: Value of apparent diffusion coefficient org/10.1007/s00261-013-0011-yMebis et al: Correlation Between Apparent Diffusion Coefficient Value on MRI and Histopathologic Art. 7, page 9 of 9
WHO Grades of Neuroendocrine Tumors
How to cite this article: Mebis W, Snoeckx A, Corthouts B, El Addouli H, Nicolay S, Van Hoyweghen A, Spinhoven M, de Beeck,
BO. Correlation Between Apparent Diffusion Coefficient Value on MRI and Histopathologic WHO Grades of Neuroendocrine Tumors.
Journal of the Belgian Society of Radiology. 2020; 104(1): 7, 1–9. DOI: https://doi.org/10.5334/jbsr.1925
Submitted: 28 August 2019 Accepted: 25 December 2019 Published: 30 January 2020
Copyright: © 2020 The Author(s). This is an open-access article distributed under the terms of the Creative Commons
Attribution 4.0 International License (CC-BY 4.0), which permits unrestricted use, distribution, and reproduction in any medium,
provided the original author and source are credited. See http://creativecommons.org/licenses/by/4.0/.
Journal of the Belgian Society of Radiology is a peer-reviewed open access journal
OPEN ACCESS
published by Ubiquity Press.You can also read