The Investment Case for Bitcoin 2019 - VanEck
←
→
Page content transcription
If your browser does not render page correctly, please read the page content below

2019

The Investment Case for Bitcoin
Table of Contents

Bitcoin as a Potential Store of Value       3
Bitcoin’s Role in an Investment Portfolio   9
Accelerating Bitcoin Adoption               18

2
Bitcoin as a Potential Store of Value
Understanding the differences between monetary and intrinsic value
Bitcoin’s combination of durability, scarcity, privacy, and its nature as
a bearer asset all contribute to it holding monetary value
Bitcoin is on the path to becoming digital gold
So why don’t institutional investors own bitcoin?
Please see important disclosures at the end of this presentation.
3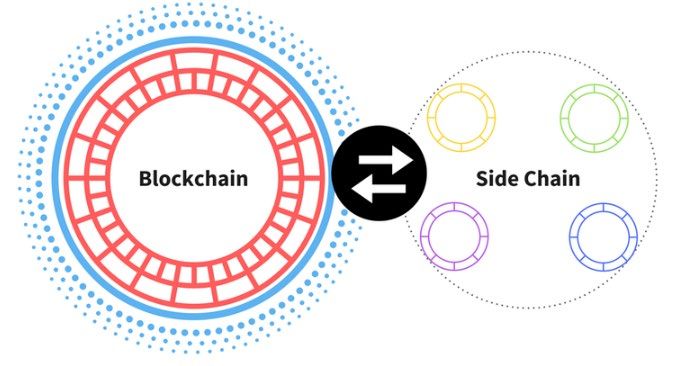
Bitcoin and Monetary Theory
To determine if Bitcoin has value, it is important to start with understanding the
two types of value
Intrinsic Value (IV): Value that exists because an economic good produces cash
flow or has overt utility: equities, fixed income, real estate, and consumable
commodities (corn, oil, etc).
Monetary Value (MV): Value that exists in spite of an economic good not having
intrinsic value or value that exists in excess of an economic good’s intrinsic value
Goods with Intrinsic Value Goods with Monetary Value
Equities Gold
Fixed Income Silver
Real estate Diamonds
Corn Bitcoin
Wheat Artwork
Oil U.S. Dollars
Copper Emeralds, rubies, other gemstones
* Precious metals have a tiny amount of intrinsic value because of industrial uses. Nonetheless, the prices of precious metals largely reflect their monetary value. If gold were to trade at a price that reflected only its
industrial use it would be far cheaper than it is today. Please see important disclosures at the end of this presentation.
4
Monetary Value
Nothing ever “backs” MV: MV is inherently a bet that an object will retain value or increase in value
in the future. Items with MV are items that store value and can be seen as claims on future IV. This
may make people uncomfortable but it has been true since the dawn of civilization.
MV arises because of collective belief: Behavioral economics, heard behavior, etc. Humans have
long needed a way to store value outside of IV. Money is a natural consequence of a productive
society
Monetary value needn’t relate to any sovereign power: historically, most objects of monetary value
have no relationship to a sovereign power – gold, gemstones, etc.
The creation of a new object with monetary value is rare, but not unheard of. Artwork is a good
example. Artwork as MV is a phenomenon of the past few centuries. Artwork did not have MV in
early societies.
MV usually arises from special needs or circumstances:
— Gold acquired MV because it was scarce, durable and relatively easy to make into coins, bars,
etc.
— Bitcoin has MV because it is scarce (which is spectacularly unique in a digital world), durable,
has strong privacy characteristics (i.e. it is pseudonymous), is a bearer asset that can be
memorized (making it especially useful in authoritarian regimes)
* Precious metals have a tiny amount of instrinsic value because of industrial uses. Nonetheless, the prices of precious metals largely reflect their monetary value. If gold were to trade at a price that reflected only
its industrial use it would be far cheaper than it is today. Please see important disclosures at the end of this presentation.
5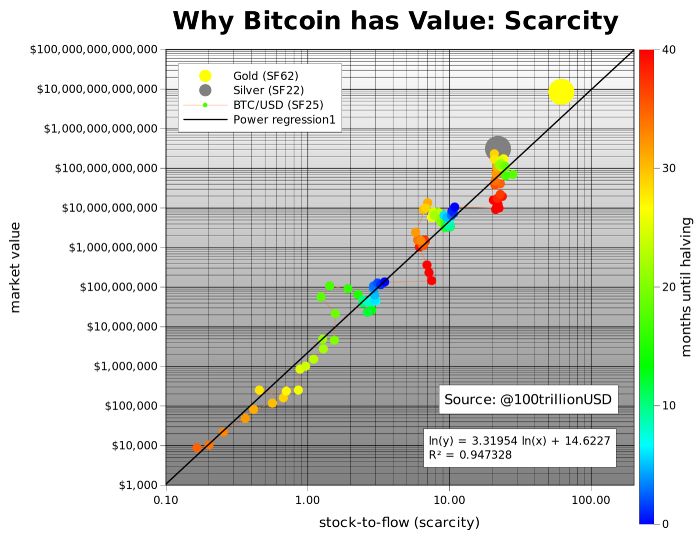
Monetary Theory
The generation of MV does not require that an object be attached to a payment system
— Artwork is not used for payments but its value is entirely MV
— Gold was used in the past for payments but nowadays only on a very limited basis
— Bitcoin is not a terrific payment system but certainly better than artwork and gold
The more people that come to accept than an object has MV, the more likely it is to have MV in the
future
Volatility is an inherent consequence of the process of an object acquiring MV
— When gold first acquired MV there was plenty of disagreement about how many goats you could
get for an ounce of gold
Currency is a sub-type of money. Money is a sub-type of items with MV
— USD is a currency: usable for transactions on a regular basis
— Gold coins are a money: usable on a very limited basis for transactions but not as easily as a
currency
— Artwork is an object with MV. Not readily usable for transactions but plenty of MV nonetheless
— Bitcoin is not quite a currency but most certainly is a money, however it may become a currency
in the future
* Precious metals have a tiny amount of intrinsic value because of industrial uses. Nonetheless, the prices of precious metals largely reflect their monetary value. If gold were to trade at a price that reflected only its
industrial use it would be far cheaper than it is today. Please see important disclosures at the end of this presentation.
6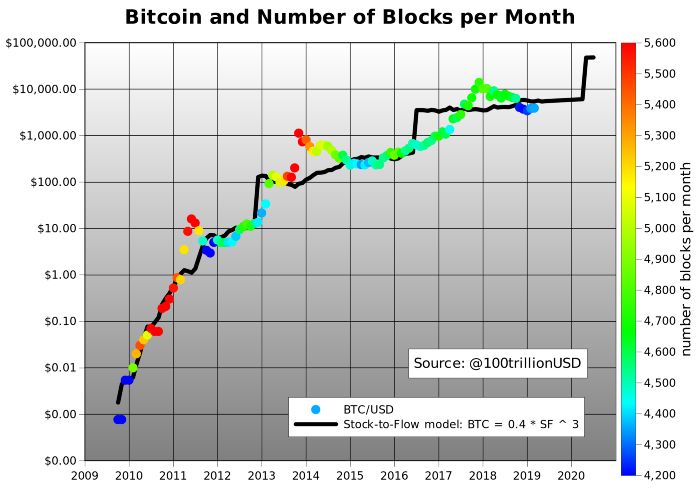
Bitcoin Has the Potential to Become “Digital Gold”

                                                                   Bitcoin vs. Gold vs. Dollar

 Traits of Money                                                              Gold             Government Issued (U.S. dollar)   Crypto (Bitcoin)
 Fungible (Interchangeable)                                                   High                            High                    High
 Non-consumable                                                               High                            High                    High
 Portability                                                              Moderate                            High                    High
 Durable                                                                      High                          Moderate                  High
 Highly divisible                                                         Moderate                          Moderate                  High
 Secure (cannot be counterfeited)                                         Moderate                          Moderate                  High
 Easily transactable                                                           Low                            High                    High
 Scarce (predictable supply)                                              Moderate                            Low                     High
 Sovereign (Government issues)                                                 Low                            High                     Low
 Decentralized                                                                 Low                            Low                     High
 Smart (Programmable)                                                          Low                            Low                     High

Source: MVIS Website, As of 06/30/2019. Please see important disclosures at the end of this presentation.

7
Why don’t Institutional Investors Have Exposure to Bitcoin? None of the traditional capital markets infrastructure participants handle bitcoin The difficulty largely has to do with bitcoin’s nature as a bearer asset The plumbing to connect bitcoin with capital markets has been limited Capital Markets Function / entity Stocks, bonds, etc. Bitcoin and other digital assets Custodians ✔ ✘ Prime brokers ✔ ✘ Clearing entities ✔ ✘ Settlement entities ✔ ✘ Transfer agents ✔ ✘ Please see important disclosures at the end of this presentation. 8
Bitcoin’s Role in an Investment Portfolio
If Bitcoin is increasingly used as an asset with monetary value both on-chain
and off-chain, then how might one think of it as an investment?
Several theories exist that point to increasing scarcity and Network Transfer
Value as some of the drivers for historical Bitcoin growth
Bitcoin historical performance and how that could fit into an investment portfolio
Please see important disclosures at the end of this presentation.
9Stock to Flow Ratio Illustrates Bitcoin Growth Potential The stock to flow ratio is defined as the amount of an asset that is held in reserves divided by the amount of that asset produced for a selected time period The below stock to flow data suggest that bitcoin may have potential to grow based on historical data and scarcity characteristics of bitcoin, gold and silver Source: Medium, “Modeling Bitcoin’s Value with Scarcity,” March 22, 2019. Please see important disclosures at the end of this presentation. 10
Bitcoin Halving Illustrates Scarcity-Driven Historical Growth
Halving is defined as a 50% block reward cut to bitcoin production rate. Halvings are
programmed into bitcoin and occur roughly every four years (210,000 blocks)
Historically, given the increasing scarcity induced by halvings, the price of bitcoin
has increased following halvings over the course of Bitcoin’s lifecycle
The next halving is expected in May 2020
MVIS CryptoCompare Bitcoin Index
2/1/2012 - 7/31/2019
1,000,000.0
100,000.0
10,000.0
Cumulative Return %
2nd halving
1,000.0 7/9/2016
Bitcoin price: $657.61
100.0
1st halving
11/28/2012
Bitcoin price: $12.22
10.0
1.0
Source: Morningstar. Data as of 7/31/2019. Please see important disclosures at the end of this presentation.
11Bitcoin Historically Outperforms Traditional Asset Classes
Bitcoin has performed well versus major indices
Most long term periods such as 3 and 5 year have been historically positive for Bitcoin
MVIS CryptoCompare Bitcoin Index
2/1/2012 - 7/31/2019
1,000,000.0
100,000.0
Cumulative Return %
10,000.0
1,000.0
100.0
10.0
1.0
1 Month 3 Months YTD 1 Year 3 Years 5 Years
Bitcoin -10.83 86.40 158.39 28.92 167.30 82.32
S&P 500 1.44 1.69 20.24 7.99 13.36 11.34
US Bonds 0.22 3.28 6.35 8.08 2.17 3.05
Gold 1.70 11.83 12.21 16.55 1.93 2.31
ACWI 0.17 -0.09 15.07 0.87 8.01 4.39
Source: MVIS. Data as of July 31, 2019. US Bonds is measured by the Bloomberg Barclays US Aggregate Index; Gold is measured by the S&P GSCI Gold Spot Index; US Real Estate is measured by the MSCI
US REIT Index; Oil is measured by the Brent Crude oil spot price, Emerging Market Currencies is measured by the Bloomberg Barclays EM Local Currency Government Index. See disclaimers and index
descriptions at the end of this presentation. Past performance is no guarantee of future results.
12Low Correlation with Traditional Asset Classes
Very low correlation with traditional asset classes such as
broad market equity indices, bonds and gold
Potential for increased portfolio diversification
Correlation Emerging Market
S&P 500 US Bonds Bitcoin Gold US Real Estate Oil
2/1/2012 to 7/31/2019 Currencies
S&P 500 - -0.28 0.01 -0.04 0.59 0.32 0.29
US Bonds -0.28 - 0.03 0.26 0.12 -0.17 0.09
Bitcoin 0.01 0.03 - 0.03 0.04 -0.05 -0.01
Gold -0.04 0.26 0.03 - 0.07 0.09 0.31
US Real Estate 0.59 0.12 0.04 0.07 - 0.12 0.27
Oil 0.32 -0.17 -0.05 0.09 0.12 - 0.26
Emerging Market Currencies 0.29 0.10 -0.01 0.31 0.27 0.23 -
Source: Morningstar. Data as of July 31, 2019. US Bonds is measured by the Bloomberg Barclays US Aggregate Index; Gold is measured by the S&P GSCI Gold Spot Index; US Real Estate is measured by the
MSCI US REIT Index; Oil is measured by the Brent Crude oil spot price, Emerging Market Currencies is measured by the Bloomberg Barclays EM Local Currency Government Index. See disclaimers and index
descriptions at the end of this presentation.
13A Small Bitcoin Allocation May Improve Portfolio Upside
Bitcoin may enhance the risk and return reward profile of institutional investment portfolios
A small allocation to bitcoin significantly enhanced the cumulative return of a 60% equity and
40% bonds portfolio allocation mix while only minimally impacting its volatility
Assymetric Return Profile
2/1/2012 - 7/31/2019
250
200
Cumulative Return %
150
100
50
0
60% EQ / 40% BD 59.75% EQ / 39.75% BD / 0.5% BTC 59.5% EQ / 39.5% BD / 1% BTC
58.5% EQ / 38.5% BD / 3% BTC S&P 500 Bloomberg Barclays US Agg
Cumulative Return Annualized Return Std Dev Beta
S&P 500 165.69 13.92 11.17 1.00
Bloomberg Barclay s US Agg 21.91 2.68 2.85 -0.03
60% EQ / 40% BD 97.15 9.47 6.68 0.59
59.75% EQ / 39.75% BD / 0.5% BTC 110.56 10.44 6.85 0.60
59.5% EQ / 39.5% BD / 1% BTC 124.71 11.40 7.16 0.61
58.5% EQ / 38.5% BD / 3% BTC 189.49 15.23 9.39 0.65
Source: Morningstar. Data ss of 07/31/2019. Please see important disclosures at the end of this presentation.
14Bitcoin and Large-Caps Decouple From Small-Caps
As the digital asset industry has matured, Bitcoin decouples from small caps and
drives large-cap index performance
Bitcoin to small cap performance difference has been 139% and the large cap to
small cap performance difference has been approximately 40% in the past year as
illustrated by the below indices
Cumulative Performance
300%
250%
200%
177.01%
150%
100%
78.23%
50%
38.49%
0%
-50%
MVIS CryptoCompare Bitcoin Price MVIS CryptoCompare Digital Assets 10 MVIS CryptoCompare Digital Assets 100 Small-Cap
Source: Bloomberg/MVIS, Data as of 07/15/2019. Please see important disclosures at the end of this presentation.
15Bitcoin Market Structure Risks
Bitcoin risks to consider include:
Hacking of trading platforms and participants in the life cycle of a trade (usually social engineering)
Price volatility
Encryption vulnerability; developments in quantum computing (which would increase success of private
key hacking; credit cards more vulnerable nevertheless)
Novelty/extreme early stage of many applications
Unintentional coding error
Governance shortcomings
Can miners and developers “run” the “core” software? (Linux is a good example for successful
execution)
Ecosystem design
Will payments continue to sustain processing and verification activities
16Heavy Momentum in Crypto Developments
State Regulation
‒ Colorado exempts crypto from state
securities regulation
‒ Wyoming recognized crypto as property, allows
banks to be custodians, enables tokenization
Physically Settled Bitcoin Futures receive
regulatory approval
Established custodians enter crypto
Established brokerages to offer spot digital asset trading.
Pension funds and endowments allocate to digital assets.
Global regulators start cracking down on ICOs/unregistered offerings. Bitcoin is different.
ETFs under consideration. VanEck-SolidX proposal is at the top of the pile.
Please see important disclosures at the end of this presentation.
17Accelerating Bitcoin Adoption 18
Crypto Exchanges are Healthy: Not Going Away
Bitfinex makes over $400 million1: Top 650 of U.S. companies; Binance in the
same range
Liquidity…Bitcoin daily volume over $2 billion2
Bitcoin and crypto became more available to retail investors
‒ Swiss Exchange offers crypto trading (no Europe equity exchanges)
‒ Robinhood, TD and Etrade offer trading in crypto
‒ Etoro, large crypto broker, offers commission-free trading in ETFs
‒ Exchange-standard surveillance software implemented by crypto exchanges
‒ OTC crypto brokers offer price feed to market through MVIS
CME futures contracts top 25,000 BTC open interest, $350 million notional3
Crypto exchanges use best practices, such as surveillance and accounting
software
Exchanges are the target of hackers but can reimburse losses
(Binance refunds $40 million in losses from insurance fund)4
1 Bitfinex. Data as of 5/8/2019
2 Cryptocompare. Data as of 7/10/2019
3 CME. Data as of 6/24/2019.
4 Binance.
Please see important disclosures at the end of this presentation.
19CME Bitcoin Futures Contract Sets New Trading Record
CME Bitcoin Futures Average Daily Open Interest
6,000 30,000
5,000 25,000
4,560
4,000 3,822 20,000
# of Equivalent Bitcoin
# of BTC Contracts
3,356
3,000 2,873 15,000
2,405
2,000 10,000
1,523
1,000 5,000
0 0
Source: CME Group. Data as of 6/24/2019. Please see important disclosures at the end of this presentation.
20Bitcoin Trading is Not Concentrated
1 Month 6 Months
Exchange Volume (BTC) Market Share Exchange Volume (BTC) Market Share
Coinbase 783K 22.40% Coinbase 2.80M 19.15%
Bitfinex 527K 15.07% Bitfinex 2.42M 16.55%
Kraken 524K 15.00% Kraken 2.21M 15.13%
Bitstamp 416K 11.90% Bitstamp 1.87M 12.80%
Bit-X 409K 11.68% Bit-X 1.52M 10.37%
bitFlyer 272K 7.79% Others 1.03M 7.02%
Bithumb 234K 6.69% bitFlyer 1.02M 6.94%
Others 162K 4.62% Bithumb 934K 6.38%
Gemini 87K 2.48% Gemini 475K 3.24%
BitBay 83K 2.37% Itbit 345K 2.42%
Coinbase Bitfinex Kraken Bitstamp Bit-x Coinbase Bitfinex Kraken Bitstamp Bit-x
bitFlyer Bithumb Others Gemini BitBay Others bitFlyer Bithumb Gemini Itbit
Gemini BitBay Gemini Itbit
Others Bithumb Coinbase
Coinbase
Bithumb
bitFly er
bitFly er
Others
Bitfinex
Bit-x Bitfinex Bit-x
Bitstamp Bitstamp Kraken
Kraken
Source: Bitcoinity. Data as of June 2019.
21Bitcoin Ownership Seems Well Distributed/Not Concentrated
30.00%
% BTC Owned in Various Wallet Ranges
25.1% 24.7%
25.00%
20.2%
20.00%
14.7%
15.00%
10.00% 8.6%
5.00% 3.5%
2.1%
0.9% 0.1% 0.0%
0.00%
100,000 - 1,000,000 10,000 - 100,000 1,000 - 10,000 100 - 1,000 10 - 100 1.0-10 0.1 - 1 0.01 - 0.1 0.001 - 0.01 0 - 0.001
Amount BTC Number of Amount USD Cumultative %
Total % Owned
Owned Wallets Owned Owned
Caveat 100,000 - 1,000,000 3 4,059,989,007 2.1% 2.1%
Multiple wallets per person 10,000 - 100,000 115 27,920,455,571 14.7% 16.8%
Digital asset exchange wallets 1,000 - 10,000 1857 47,829,664,968 25.1% 42.0%
represent bitcoin holdings of 100 - 1,000 14199 38,479,936,713 20.2% 62.2%
multiple persons 10 - 100 134694 47,043,087,453 24.7% 86.9%
1.0-10 585866 16,378,291,621 8.6% 95.5%
0.1 - 1 1971924 6,613,595,738 3.5% 99.0%
0.01 - 0.1 4667132 1,644,668,550 0.9% 99.9%
0.001 - 0.01 5968069 258,169,639 0.1% 100.0%
Source: Bitcoin Blockchain; as of July 2019. 0 - 0.001 12806108 27,379,675 0.0% 100.0%
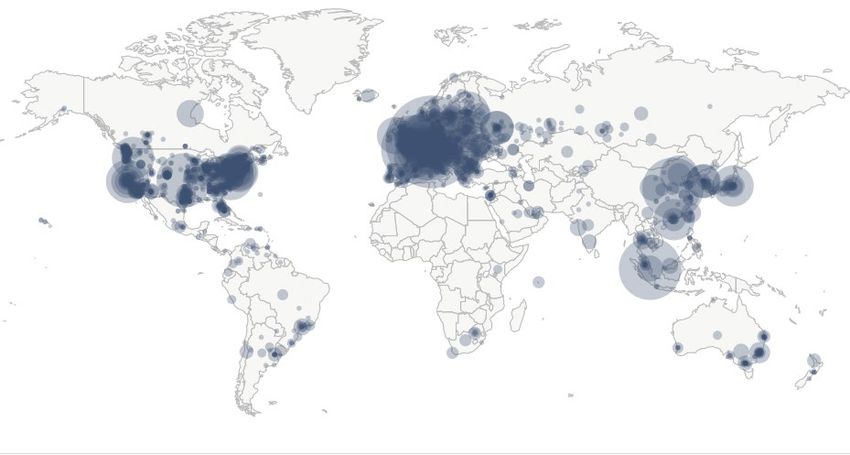
22Bitcoin Adoption Continues: Nodes and Users
A full-node is a computer that downloaded and continuously updates a full copy of the Bitcoin-blockchain
(You can host your own full node with as little as 200GBs! It’s your own mini bank!)
A mining node is a computer that participates in the verification of transactions on the Bitcoin-blockchain
10435 Nodes 10,000 Bitcoin Mining Nodes and 100,000 Full Nodes
Top 10 countries with their respective number of
reachable nodes are as follows
Rank Country Nodes
1 United States 2407 (23.07%)
2 Germany 1849 (17.72%)
3 n/a 1046 (10.02%)
4 France 600 (5.75%)
5 Netherlands 521 (4.99%)
6 China 411 (3.94%)
7 Canada 349 (3.34%)
8 United Kingdom 303 (2.90%)
9 Singapore 286 (2.74%)
10 Russian Federation 268 (2.57%)
Source: Bitnodes.earn.com. Data as of 7/31/2019. Please see important disclosures at the end of this presentation. n/a represents unknown locations, but likely are mining pools.
23Bitcoin Adoption Continues: On-Chain Transactions
Bitcoin transactions cross 400,000 permissionless transactions a day exhibiting significant network value
Bitcoin on-chain transactions amount to a significant portion of SWIFT transactions1
Daily Confirmed Bitcoin Transactions
500,000
400,000
Transactions
300,000
200,000
100,000
0
1SWIFT is a global member-owned cooperative and the world’s leading provider of secure financial messaging services.
Source: Blockchain.info. Data as of 7/13/2019. Please see important disclosures at the end of this presentation.
24Tracking Bitcoin Adoption Off-Chain
A number of applications are being built on Bitcoin and there is a natural
evolution taking place
Sidechains could be the next step in boosting Bitcoin adoption as they allow
for scalability and customizations while retaining Bitcoin’s security
properties
Built on top of the Bitcoin-blockchain, the Lightning Network pushes the
boundaries of Bitcoin payment capabilities with lower costs and faster
speeds
Taking advantage of Bitcoin’s trust-minimized features, Microsoft works to
build a decentralized identity platform on the Bitcoin-blockchain
Please see important disclosures at the end of this presentation.
25Sidechains Supercharge Bitcoin Capabilities
Established code base – Sidechains are based on
Bitcoin-blockchain architecture
Security – Sidechains preserve the most important
security properties of the Bitcoin-blockchain
Scalability – Sidechain transactions make verification
faster (Example: The Liquid sidechain supports
Lightning enabling scalability up to millions of
transactions per second
Privacy – Confidential transactions increase privacy for
network participants
Customization – Possible to apply investor restrictions
on sidechains, Bitcoin is permissionless
26Lightning Network is a Significant Payments Layer on Bitcoin
The Lightning Network – Is a payment-focused layer 2
application built on top of the Bitcoin-blockchain (almost like
a sidechain but different)
Scalability – Millions of transactions per second vs Bitcoin
(7 tx/sec) and Visa (45,000 tx/sec)1
Cost – Bitcoin transactions to reduce to fraction of a cent,
instead of dollars
Privacy – Retained from Bitcoin network; identity only
posted when lightning channel closed
Importance – Decentralized and trust-minimized
transactions to compete with established centralized
payment networks such as Visa, MasterCard, PayPal, etc…
1 Visa. Data as of 08/2017
Please see important disclosures at the end of this presentation.
27Microsoft Secures Online Identity Using Bitcoin
What? Decentralized online identity platform;
secure trust-minimized login
Who? Microsoft decides to build it on Bitcoin
Where? Built on top of the Bitcoin-blockchain
(layer 2)
Why? Online identity is centralized, fragmented
and prone to theft
When? Launched on testnet in May 20191
1 Microsoft
Please see important disclosures at the end of this presentation.
28Ten Most Liquid Digital Assets
Direct Vol. Total Vol. Market
Rank Coin Price
24 Hour 24 Hour Cap
Bitcoin
1 $10,808.80 $2.93 B $11.98 B $192.22 B
BTC
XRP
2 $0.4013 $173.77 M $1.64 B $40.13 B
XRP
Ethereum
3 $289.34 $581.94 M $5.08 B $30.86 B
ETH
Bitcoin Cash
4 $402.07 $143.65 M $936.55 M $7.18 B
BCH
Litecoin
5 $114.80 $222.12 M $1.98 B $7.17 B
LTC
EOS
6 $5.764 $83.64 M $2.20 B $5.87 B
EOS
Binance Coin
7 $33.77 - $308.39 M $4.77 B
BNB
Tether
8 $0.9875 $55.18 M $215.68 M $3.54 B
USDT
Bitcoin SV
9 $189.12 $13.49 M $276.85 M $3.38 B
BSV
Cardano
10 $0.08471 $4.22 M $227.12 M $2.20 B
ADA
Source: CryptoCompare. Data as of 6/30/2019. Please see important disclosures at the end of this presentation.
29Index Definitions All indices are unmanaged and include the reinvestment of all dividends but do not reflect the payment of transactions costs, advisory fees or expenses that are typically associated with managed accounts or investment funds. Indices were selected for illustrative purposes only and are not securities in which investments can be made. The returns of actual accounts investing in natural resource equities, energy equities, diversified mining equities, gold equities, commodities, oil, industrial metals, gold, U.S. equities and U.S. bonds strategies are likely to differ from the performance of each corresponding index. In addition, the returns of accounts will vary from the performance of the indices for a variety of reasons, including timing and individual account objectives and restrictions. Accordingly, there can be no assurance that the benefits and risk/return profile of the indices shown would be similar to those of actual accounts managed. Performance is shown for the stated time period only. The S&P® 500 Index: a float-adjusted, market-cap-weighted index of 500 leading U.S. companies from across all market sectors. The Bloomberg Barclays U.S. Aggregate Bond TR Index: is a broad-based benchmark that measures the investment grade, U.S. dollar-denominated, fixed-rate taxable bond market. The index includes Treasuries, government-related and corporate securities, MBS (agency fixed-rate and hybrid ARM pass-throughs), ABS and CMBS (agency and non-agency). The Bloomberg Barclays EM Local Currency Government TR Index: is a flagship index that measures the performance of local currency Emerging Markets (EM) debt. Classification as an EM is rules-based and reviewed annually using World Bank income group, International Monetary Fund (IMF) country classification and additional considerations such as market size and investability. The MSCI US REIT Index: is a free float-adjusted market capitalization index that is comprised of equity REITs and represents about 99% of the US REIT universe and securities are classified in the Equity REITs Industry (under the Real Estate sector) according to the Global Industry Classification Standard (GICS®). It however excludes Mortgage REIT and selected Specialized REITs. The S&P GSCI Gold Index: Is a sub-index of the S&P GSCI, provides investors with reliable and publicly available benchmark tracking the COMEX gold future. The index is designed to be tradable, readily accessible to market participants, and cost efficient to implement. The MVIS CryptoCompare Bitcoin Index measures the performance of a digital assets portfolio which invests in Bitcoin. The MVIS CryptoCompare Digital Assets 10 Index is a modified market cap-weighted index which tracks the performance of the 10 largest and most liquid digital assets. Most demanding size and liquidity screenings are applied to potential index components to ensure investability. The MVIS CryptoCompare Digital Assets 100 Small-Cap Index is a market cap- weighted index which tracks the performance of the 50 smallest digital assets in the MVIS CryptoCompare Digital Assets 100 Index. All S&P indices listed are products of S&P Dow Jones Indices LLC and/or its affiliates and has been licensed for use by Van Eck Associates Corporation. Copyright © 2018 S&P Dow Jones Indices LLC, a division of S&P Global, Inc., and/or its affiliates. All rights reserved. Redistribution or reproduction in whole or in part are prohibited without written permission of S&P Dow Jones Indices LLC. For more information on any of S&P Dow Jones Indices LLC’s indices please visit www.spdji.com. S&P® is a registered trademark of S&P Global and Dow Jones® is a registered trademark of Dow Jones Trademark Holdings LLC. Neither S&P Dow Jones Indices LLC, Dow Jones Trademark Holdings LLC, their affiliates nor their third party licensors make any representation or warranty, express or implied, as to the ability of any index to accurately represent the asset class or market sector that it purports to represent and neither S&P Dow Jones Indices LLC, Dow Jones Trademark Holdings LLC, their affiliates nor their third party licensors shall have any liability for any errors, omissions, or interruptions of any index or the data included therein. 30
Important Disclosure

The information herein represents the opinion of the author(s), but not necessarily those of VanEck, and these opinions may
change at any time and from time to time. Non-VanEck proprietary information contained herein has been obtained from sources
believed to be reliable, but not guaranteed. Not intended to be a forecast of future events, a guarantee of future results or
investment advice. Historical performance is not indicative of future results. Current data may differ from data quoted. Any graphs
shown herein are for illustrative purposes only.

This is not an offer to buy or sell, or a solicitation of any offer to buy or sell any of the securities/ financial instruments mentioned
herein. The information presented does not involve the rendering of personalized investment, financial, legal, or tax advice.

No part of this material may be reproduced in any form, or referred to in any other publication, without express written permission
of VanEck.

MV Index Solutions (MVIS®) develops, monitors and markets the MVIS Indices, a focused selection of pure-play and investable indices
designed to underlie financial products. They cover several asset classes including hard assets and the internal equity markets as well as
fixed income markets. MVIS is the index business of VanEck, a U.S. based investment management firm.

All investing is subject to risk, including the possible loss of the money you invest. As with any investment strategy, there is no
guarantee that investment objectives will be met and investors may lose money. Diversification does not ensure a profit or protect
against a loss in a declining market. Past performance is no guarantee of future results.

31
You can also read