I'm Still Standing: The Bull Recovers in 2021 - Signature Wealth Management

 
CONTINUE READING
I'm Still Standing: The Bull Recovers in 2021 - Signature Wealth Management
I’m Still Standing:
The Bull Recovers in 2021

Presented by

Steven A. Chiavarone, CFA
Vice President, Portfolio Manager

March 2021

Federated Advisory Services Company

Prepared exclusively for Signature Wealth Management. Not for Distribution to the Public.   21-40162 and (3/21)   1
I'm Still Standing: The Bull Recovers in 2021 - Signature Wealth Management
Disclosure

The views expressed are not necessarily the opinion of SagePoint Financial, Inc., and should not be construed directly
or indirectly, as an offer to buy or sell any securities mentioned herein and should not be construed as investment
advice. Individual circumstances vary. Investing is subject to risks including loss of principal invested.

                                                                                        Signature Wealth Management
                                                                                        5775 Wayzata Blvd, Suite 360
                                                                                           St. Louis Park, MN 55416
                                                                                                 952-388-6390

Prepared exclusively for Signature Wealth Management. Not for Distribution to the Public.
                                                                                                                         2
I'm Still Standing: The Bull Recovers in 2021 - Signature Wealth Management
The Big Story is the Economic Rebound
The V-Shaped Recovery On Pace to Transition to Economic Expansion in 2H21

                                                                                                    U.S. Real GDP
                                                                                                                                                               Billion ($)

                                                                                                                                                                19,000

                                                                                                                                                                         18,584 (9/30/20)

                                                                                                                                                                18,000

                                                                                                                                                                17,000

                                                                                                                                                                16,000

                                                                                                                                                                15,000

                                                                                                                                                                14,000
                    2005       2006       2007       2008       2009       2010       2011   2012   2013   2014   2015   2016   2017   2018   2019   2020   2021

                                                                                                Actual                                              Federated
                                                                                                                                                Hermes Forecast
Source: Bloomberg & Federated Hermes. As of February 1, 2021.

Prepared exclusively for Signature Wealth Management. Not for Distribution to the Public.
                                                                                                                                                                                            3
I'm Still Standing: The Bull Recovers in 2021 - Signature Wealth Management
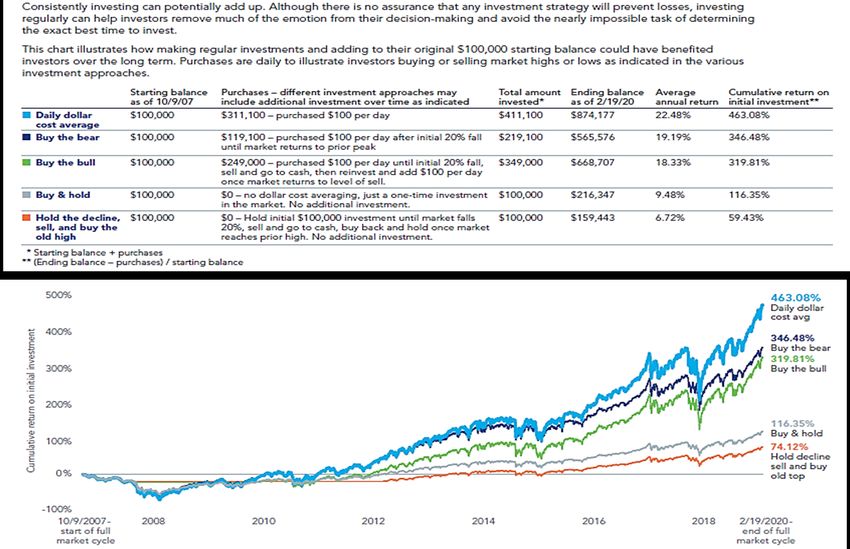
Which Has Been Dramatic and Broad Based
Multiple factors

 Thousands                                                                                                    Millions

                                                                                                     -80%
                                                                                     -28%

                                    -32%
                         -38%                         -3%                 -5%

     Continuing claims are down 80% from peak, the fastest 33-week % decline in history by a factor of two.           Housing activity is at 14-year high, hitting levels not seen since before the Great Recession.

Index                                                                                                         Billions ($)

     Manufacturing activity is at the highest level since 2018.                                                       Retail sales have recovered and are higher on a year-over-year basis despite the pandemic.
Source: Bloomberg. Data as of February 3, 2021.                                                                                                                                                                        4
Prepared exclusively for Signature Wealth Management. Not for Distribution to the Public.
I'm Still Standing: The Bull Recovers in 2021 - Signature Wealth Management
Savings Rate & Disposable Income
A Stimulus-Supported Surge in Income Has Consumers Flush with Savings

                                                                                            Orlando’s Outlook: Coronavirus Curveball
Source: Bloomberg. Data as of February 3, 2021.

Prepared exclusively for Signature Wealth Management. Not for Distribution to the Public.
                                                                                              5
I'm Still Standing: The Bull Recovers in 2021 - Signature Wealth Management
Bankruptcies Are Well Below 2009 Levels and Falling
Government and Central Bank Actions Have Helped to Limit Bankruptcies

Source: Bloomberg. Data as of February 3, 2021.

Prepared exclusively for Signature Wealth Management. Not for Distribution to the Public.
                                                                                            6
I'm Still Standing: The Bull Recovers in 2021 - Signature Wealth Management
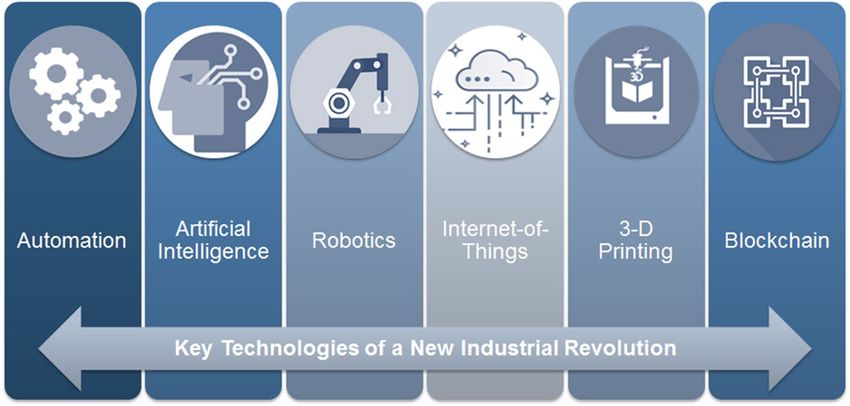
A Double Dip Recession is Not in the Cards
The Recovery Continues with Several Indicators Hitting New Cycle-Best Levels

                                                                  Federated Hermes Recession Dashboard

As of February 2021. Past performance is no guarantee of future results.

Prepared exclusively for Signature Wealth Management. Not for Distribution to the Public.
                                                                                                         7
I'm Still Standing: The Bull Recovers in 2021 - Signature Wealth Management
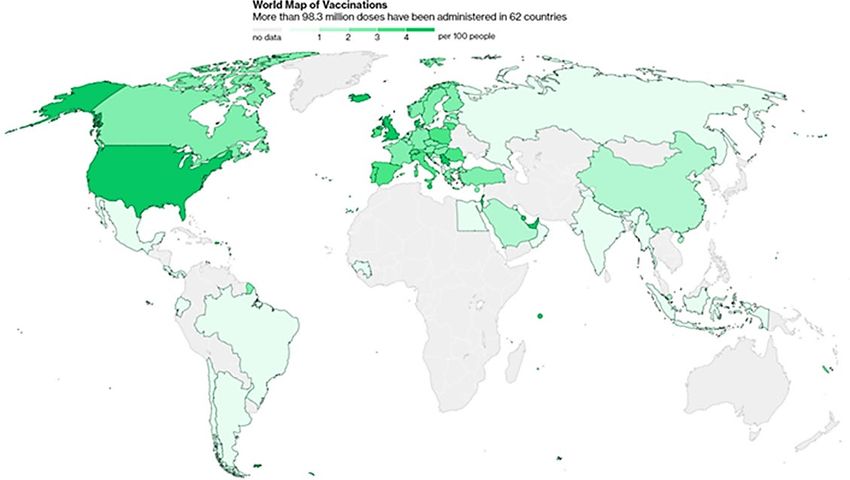
The COVID-19 Vaccines Are Likely to Be Stimulative
A look into vaccine options and effectiveness

                                                                Virus                        Vaccine effectiveness %   # of recommended doses

                                                                                                                               1

                                                                                                                               2

                                                                                                                               2

                                                                                                                               2

                                                                                                                               2

                                                                                                                               2

                                                                                                                             3-4

*2009-2019 Average
Source: Business Insider “Moderna and Pfizer's coronavirus vaccines are more than 90% effective”

Prepared exclusively for Signature Wealth Management. Not for Distribution to the Public.
                                                                                                                                                8
I'm Still Standing: The Bull Recovers in 2021 - Signature Wealth Management
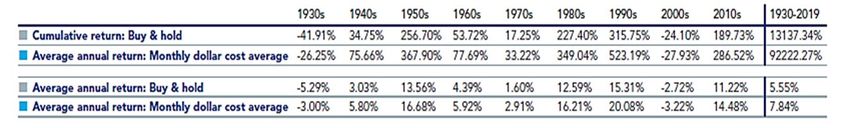
Record COVID-19 Levels vs. the Start of Vaccinations
Vaccination is happening, but it must go faster to counter record cases, hospitalizations & deaths

             Nationwide COVID-19 metrics since April 1, 2020.                                                              Daily new COVID-19 vaccination doses administered
                          7-day average lines                                                                                               per 100 people

Source: The COVID Tracking Project at The Atlantic as of February 5, 2021 (left). Federated Hermes and Github Covid-19 data as of February 5, 2021 (right)

Prepared exclusively for Signature Wealth Management. Not for Distribution to the Public.
                                                                                                                                                                               9
I'm Still Standing: The Bull Recovers in 2021 - Signature Wealth Management
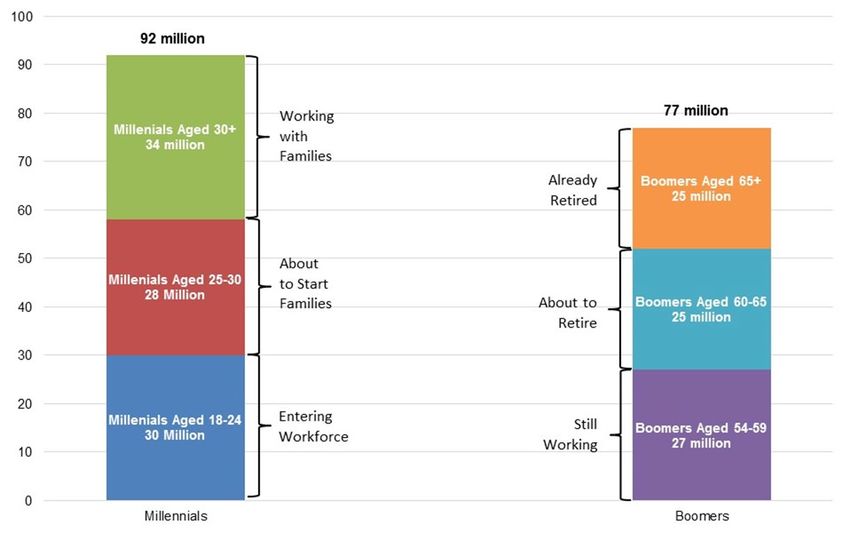
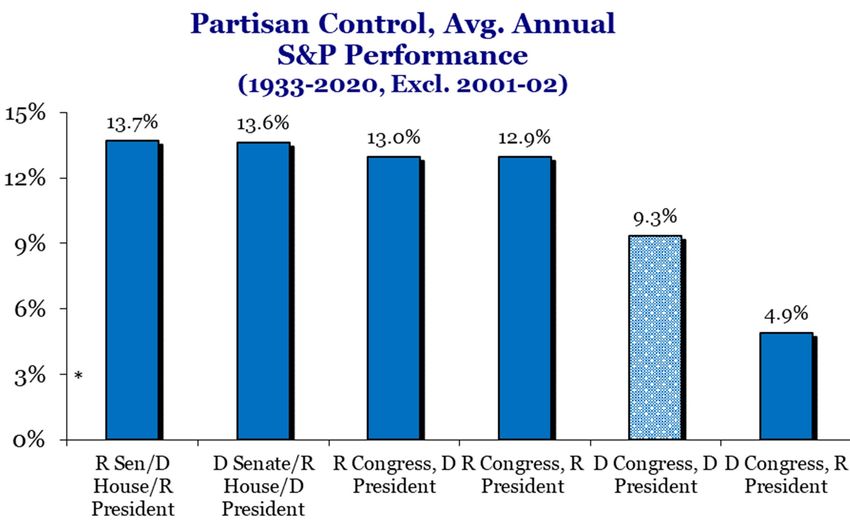
The US is Among the Leaders in Distribution
With Over 20 million doses administered, the has one of the highest population-adjusted vaccination rates

                        United States                                                                   Percentage of Population to Have Been Administered
              Total Vaccine Doses Administered                                                                             Vaccinations

Source: Github Covid-19 data as of February 5, 2021 (left). Bloomberg as of January 31, 2021 (right).

Prepared exclusively for Signature Wealth Management. Not for Distribution to the Public.
                                                                                                                                                             10
The Recovery Has Benefitted from Massive Fiscal Stimulus
Fiscal stimulus in the US has, thus far, reached 30% of GDP

                                                  COVID-19 Fiscal Responses in 2020 & 2021 (% of GDP)

                                                                                                                                Supranational Loans**

        30
                                                                                                                                                        Central/supranational bank actions
                                                                                                                                                        with fiscal support

                                                                                                                                                              Loans & loan guarantees

        20
                                                                                                                                                            Tax & pension deferrals

                                                                                                                                                           Automatic stabilizers in 2020
                                                                                                                                                           & 2021*

                                                                                                                                                              Conditional business
                                                                                                                                                              grants/loans
        10

                                                                                                                                                                      Tax cuts

                                                                                                                                                               Transfers, grants, and tax
                                                                                                                                                               credits

          0
                               UK                                   Japan                             Euro Area                            US

                                                                                                                            Supranational Transfers**
* Based on Fatas & Mihov (2016) post-1990 country-level estimates, calibrated to IMF-forecast shock to growth in 2020/21.
** Estimates of NGEU grants and loans for 2021, assumed to be 35% of total.
Source: IMF, Yale, CBO, OBR, Bruegel, Bloomberg, BMF, Evercore as of 1/26/2021
Prepared exclusively for Signature Wealth Management. Not for Distribution to the Public.
                                                                                                                                                                                             11
More Fiscal Stimulus is Likely Forthcoming
 President Biden’s $1.9 billion plan forms the basis for negotiations

                      Individuals ($1.2T)                                                                                      Covid-19 ($160B)
                          Another round of stimulus payments                                                                     National Vaccination plan

                          Enhanced unemployment benefits                                                                         Funding for testing

                          Rental assistance and eviction/foreclosure moratorium ($35B)                                        Education ($170B)
                          Childcare investments and Child Tax Credit                                                             Funding for reopening schools

                          Hazard pay                                                                                          State and local government ($370B)
                          Student loan assistance                                                                                Emergency funding for front-line workers

                          Raise minimum wage                                                                                     Aid to public transit agencies

                      Businesses ($40B)                                                                                        Cybersecurity ($10B)
                          New grant program for small business owners                                                            Funding to modernize information technology systems at
                                                                                                                                   federal agencies
                          Payroll Protection Program extension

                          Employee retention tax credit

Source: Washingtonpost.com as of January 14, 2021. CNBC.com as of January 14, 2021. Cornerstone Macro as of January 15, 2021

Prepared exclusively for Signature Wealth Management. Not for Distribution to the Public.
                                                                                                                                                                                            12
Monetary Policy is Also Quite Accommodative
The Thinking About Index

                                                                                “We’re not even thinking about thinking about raising rates”
                                                                                – Jerome Powell, June 10, 2020

                                                                              “We’re not even thinking about thinking about thinking about raising rates”
                                                                               – Jerome Powell, July 29, 2020

                  New Fed Chair in February 2022. Will Biden
                  reappoint Powell?
                       • Lael Brainard
                       • Roger Ferguson
                  Possible third new Fed mandate: price stability, full
                  employment, and racial diversity

Prepared exclusively for Signature Wealth Management. Not for Distribution to the Public.
                                                                                                                                                            13
As Growth Expectations Improve, Rates are Recovering
Economic Recovery and Supply/Demand Imbalances Could Spark Inflation/Rates Fears

Source: Bloomberg. Data as of February 3, 2021.

Prepared exclusively for Signature Wealth Management. Not for Distribution to the Public.
                                                                                            14
The Fed is Likely to Remain Patient
With the Dual Mandate in Mind, Tapering or Rate Hikes Seem Unlikely

       It is likely that the Fed will leave short-term interest rates                                          The Dual Mandate, updated
       unchanged for some time.                                                                                (September FOMC statement)
       Minutes from the September FOMC meeting revealed that the                                               “The Committee seeks to achieve maximum employment and inflation at
       Committee was somewhat divided over the inclusion of forward                                            the rate of 2 percent over the longer run. With inflation running persistently
       guidance in relation to average inflation targeting in the statement.                                   below this longer-run goal, the Committee will aim to achieve inflation
                                                                                                               moderately above 2 percent for some time so that inflation averages 2
       They revealed a belief that additional fiscal stimulus is needed to                                     percent over time and longer-term inflation expectations remain well
                                                                                                               anchored at 2 percent. The Committee expects to maintain an
       prevent more long-term economic impacts.                                                                accommodative stance of monetary policy until these outcomes are
                                                                                                               achieved.“

            %                                Inflation – on the rise                                           millions             Employment – some distance to go                           %
           2.0                                                                                                   155                                                                           16
           1.8                                                                                                   150                                                                           14
           1.6
                                                                                                                 145                                                                           12
           1.4
           1.2                                                                                                   140                                                                           10
           1.0                                                                                                   135                                                                           8
           0.8
                                                                                                                 130                                                                           6
           0.6
           0.4                                                                                                   125                                                                           4
           0.2                                                                                                   120                                                                           2
           0.0                                                                                                   115                                                                           0
                    Jan-20    Feb-20    Mar-20     Apr-20     May-20     Jun-20     Jul-20   Aug-20   Sep-20
                                                                                                                          Jan-20 Feb-20 Mar-20 Apr-20 May-20 Jun-20   Jul-20   Aug-20 Sep-20
                    Personal Consumption Expenditures (PCE) Core Price Index, year over year SA
                                                                                                                               Unemployment Rate (%)    Total Nonfarm Payrolls (millions)

As of 9/30/20
Source: Bloomberg

Prepared exclusively for Signature Wealth Management. Not for Distribution to the Public.
                                                                                                                                                                                                    15
The Federal Debt Is A Popular Concern
While Debt Levels Have Risen Sharply, Low Rates Mean that the Interest Burden Has Fallen Dramatically

                                                           Federal Debt to GDP                                                                                                                                                                               Interest Expense as % of GDP
     140%                                                                                                                                                                                                                       5.0%

     130%
                                                                                                                                                                                                                                4.5%
     120%

     110%
                                                                                                                                                                                                                                4.0%
     100%

       90%                                                                                                                                                                                                                      3.5%

       80%
                                                                                                                                                                                                                                3.0%
       70%

       60%
                                                                                                                                                                                                                                2.5%
       50%

       40%                                                                                                                                                                                                                      2.0%
               1/1/1988
                          1/1/1990
                                     1/1/1992
                                                1/1/1994
                                                           1/1/1996
                                                                      1/1/1998
                                                                                 1/1/2000
                                                                                            1/1/2002
                                                                                                       1/1/2004
                                                                                                                  1/1/2006
                                                                                                                             1/1/2008
                                                                                                                                        1/1/2010
                                                                                                                                                   1/1/2012
                                                                                                                                                              1/1/2014
                                                                                                                                                                         1/1/2016
                                                                                                                                                                                    1/1/2018
                                                                                                                                                                                               1/1/2020
                                                                                                                                                                                                          1/1/2022
                                                                                                                                                                                                                     1/1/2024

                                                                                                                                                                                                                                       1/1/1988
                                                                                                                                                                                                                                                  1/1/1990
                                                                                                                                                                                                                                                             1/1/1992
                                                                                                                                                                                                                                                                        1/1/1994
                                                                                                                                                                                                                                                                                   1/1/1996
                                                                                                                                                                                                                                                                                              1/1/1998
                                                                                                                                                                                                                                                                                                         1/1/2000
                                                                                                                                                                                                                                                                                                                    1/1/2002
                                                                                                                                                                                                                                                                                                                               1/1/2004
                                                                                                                                                                                                                                                                                                                                          1/1/2006
                                                                                                                                                                                                                                                                                                                                                     1/1/2008
                                                                                                                                                                                                                                                                                                                                                                1/1/2010
                                                                                                                                                                                                                                                                                                                                                                           1/1/2012
                                                                                                                                                                                                                                                                                                                                                                                      1/1/2014
                                                                                                                                                                                                                                                                                                                                                                                                 1/1/2016
                                                                                                                                                                                                                                                                                                                                                                                                            1/1/2018
                                                                                                                                                                                                                                                                                                                                                                                                                       1/1/2020
                                                                                                                                                                                                                                                                                                                                                                                                                                  1/1/2022
                                                                                                                                                                                                                                                                                                                                                                                                                                             1/1/2024
Source: Bloomberg data as of August 10, 2020.

Prepared exclusively for Signature Wealth Management. Not for Distribution to the Public.
                                                                                                                                                                                                                                                                                                                                                                                                                                                        16
But Isn’t The Market Dangerously Expensive?
Valuations Are Certainly Above Long-Term Averages

Source: Strategas most current data as of July 10, 2020. Past performance is no guarantee of future results.

Prepared exclusively for Signature Wealth Management. Not for Distribution to the Public.
                                                                                                               17
Not So Fast…
Current P/E’s Make Sense in the Context of Lower Inflation and Interest Rates

                                                                                                                                        When yields are
                                                                                                                                        below average,
                                                                                                                                        rising rates tend
                                                                                                                                        to drive valuations
                                                                                                                                        higher
                                                                                                                                                                                        Equilibrium:
                                                                                                                                                                                      5% Treasury Yield
                                                                                                                                                                                       equals 20 P/E

Note: S&P 500 data going back to 1950. NTM/ P/E data since 1964.
Source: Strategas Research Partners as of December 21, 2018. Federal Reserve, Standard & Poor’s, Thomson Financial, FactSet, Haver Analytics, Credit Suisse as of December 2, 2019.
Past performance is no guarantee of future results.

Prepared exclusively for Signature Wealth Management. Not for Distribution to the Public.
                                                                                                                                                                                                          18
A Deeper Look Suggests Multiples Are Attractive
The Relationship Between P/E’s and Corporate Bond Yields Suggest Meaningful Upside

                                                                                            Stocks Expensive vs. Bond Yields

                                                                                             Stocks Cheap vs. Bond Yields

*Justified P/E = 1/(Corp Bond Yield + 1.40%)
Source: Bloomberg. Data as of February 3, 2021.

Prepared exclusively for Signature Wealth Management. Not for Distribution to the Public.
                                                                                                                               19
The Great Rotation
We Are Overweight Value Cyclicals, Dividend Payers, Small Caps & International Equities
                         Rolling 1 Year Return                                                                        Rolling 1 Year Return
       Russell 1000 Value (RLV) Minus Russell 1000 Growth (RLG)                                Russell 2000 (Small Cap) (RTY) Minus Russell 1000 (Large Cap) (RIY)

                            Rolling 1 Year Return
                                                                                                                        Index Price Earnings (P/E)
               All Country World Index ex US Minus MSCI USA

                                                                                            NOTE: P/E adjusted to include only positive earnings.

Source: MSCI, Russell, Bloomberg and Federated Hermes. Data as of January 25, 2021.                                                                                  20
Prepared exclusively for Signature Wealth Management. Not for Distribution to the Public.
.
The Rotation Started in September
Despite a January Pause, We Expect These Sectors to Gain Steam in 2021

                                                                                       Relative Index Returns
                                                                                          Since 9/2/2020

Source: Bloomberg. As of February 4, 2021. Past performance is no guarantee of future results. For illustrative purposes only and not representative of any specific investment.
                                                                                                                                                                                   21
Prepared exclusively for Signature Wealth Management. Not for Distribution to the Public.
We Are Coming Off of Historic Value Underperformance
With Incremental News Flow Likely to Favor Cyclicals, We Expect Value to Make Up Some Lost Ground

                                         5 Periods of Most Significant 12 Month Value Underperformance

Note: Represents the “troughs” of the Russell Value underperformance vs. Growth on a 12M rolling return basis
Source: Russell; Bloomberg. As of February 2020. Value stocks may lag growth stocks in performance, particularly in late stages of a market advance.

Prepared exclusively for Signature Wealth Management. Not for Distribution to the Public.
                                                                                                                                                       22
Cyclical Stocks Are Set for An Historic Earnings Rebound
YoY S&P Cyclical Sector Market Cap Weighed EPS Growth – 3 Previous Recessions and post COVID est.

                                                Market-Cap Weighted EPS Growth (%) of Cyclical Sectors
                                                        1 Year Post Earnings Recession Bottom

Note: Includes Energy, Materials, Industrials, and Consumer Discretionary

Source: Credit Suisse and S&P. As of February 1, 2021, Past performance is no guarantee of future results.

Prepared exclusively for Signature Wealth Management. Not for Distribution to the Public.
                                                                                                             23
Small Caps Have Outperformed After a Recession Market Bottoms
The Russell 2000 has outperformed the S&P 500 by 22% on average.

                                                            Relative Performance of Russell 2000 vs. S&P 500
                                                                  1 Year Post Recession Market Bottom

Source: Bloomberg. As of February 4, 2021.
Past performance is no guarantee of future results. For illustrative purposes only and not representative of any specific investment. Small company stocks may be less liquid and subject to greater price volatility than large company stocks.

Prepared exclusively for Signature Wealth Management. Not for Distribution to the Public.
                                                                                                                                                                                                                                                   24
Dividend Payers Offer Compelling Yield & Valuation
Relative Yield vs. 10 Year Treasuries & P/E Discount vs. Broad Equity Market At Historic Levels

                             Dividend Yield Compelling vs. Treasuries                                                                            Dividend Stocks Expensive vs. Broad Market

                            Dividend Yield Unattractive vs. Treasuries                                                                              Dividend Stocks Cheap vs. Broad Market

Source: Bloomberg. As of February 4, 2021. Past performance is no guarantee of future results. There are no guarantees that dividend paying stocks will continue to pay dividends. In addition, dividend paying stocks may not experience
the same capital appreciation potential as non-dividend paying stocks

Prepared exclusively for Signature Wealth Management. Not for Distribution to the Public.
                                                                                                                                                                                                                                            25
International vs. Domestic = Value vs. Growth
International Equity Indices Are Much More Heavily Weighted in Value Sectors

                                                                                                                                                                           S&P 500           Weight

                                                                                                                                                                           Info. Tech        28.0%
                                                                                                                                                                           Media &
                                                                                                                                                                                             9.2%
                                                                                                                                                                           Entertainment
                                                                                                                                                                           Internet Retail   5.0%

                                                                                                                                                                           Biotech           1.9%

                                                                                                                                                                           Total             44.0%

                                                                                                                                                                           MSCI World ex
                                                                                                                                                                                             Weight
                                                                                                                                                                           USA
                                                                                                                                                                           Financials        18.1%

                                                                                                                                                                           Industrials       15.0%

                                                                                                                                                                           Pharma            7.5%

                                                                                                                                                                           Energy            4.0%

                                                                                                                                                                           Total             44.6%

Source: Bloomberg. Data as od February 3, 2021.
International investing involves special risks including currency risk, increased volatility, political risks, and differences in auditing and other financial standards

Prepared exclusively for Signature Wealth Management. Not for Distribution to the Public.
                                                                                                                                                                                                      26
Federated Hermes Forecast
Views are as of January 28, 2021

                                               2016A                       2017A                        2018A                       2019A                        2020E                        2021E       2022E

Real GDP                                       1.70%                        2.30%                       3.00%                        2.20%                      (3.50)%                       5.30%       3.00%

Core PCE                                       1.80%                        1.60%                       2.00%                        1.60%                       1.50%                        1.80%       2.00%

Benchmark 10yr
                                               2.50%                        2.40%                       2.68%                        1.92%                       1.00%                        1.50%       2.00%
Treasury Yield

Fed Funds Rate                                 0.75%                        1.50%                       2.50%                        1.75%                       0.25%                        0.25%       0.25%

S&P 500 EPS                                     $119                         $133                        $163                         $167                         $150                        $180       $200

Target Forward P/E                              16.8x                       16.4x                        15.0x                       25.9x                        21.1x                        22.5x      22.7x

S&P 500 Target Price                            2,239                       2,674                        2,507                       3,231                        3,800                        4,500      5,000

PCE = Personal Consumption Expenditures. 2016, 2017, 2018 and 2019 are actual.
Views are as of the date indicated and are subject to change based on market conditions and other factors. These views should not be construed as a recommendation for any specific security or sector.
Source: Federated Hermes and the Commerce Department.

Prepared exclusively for Signature Wealth Management. Not for Distribution to the Public.
                                                                                                                                                                                                                  27
Federated Hermes Investment Focus
Views are as of February 1, 2021

                               Recommended % Allocation                                                                      Recommended Sector Allocation

                             •    Equity – 6% Overweight                                                         Overweight            Neutral          Underweight
                             •    Bonds – 7% Underweight                                                         •     Discretionary   •   Comm.        •   REITs
                             •    Alternatives – 1% Overweight                                                   •     Health Care         Services     •   Staples
                             •    Cash – Neutral                                                                 •     Industrials     •   Energy       •   Utilities
                             •    Fixed Income Duration – 92.5%                                                  •     Financials      •   Materials
                                                                                                                                       •   Technology

                                                                                            Asset Allocation Matrix

                                                   Equities                                                                                    Bonds

     Overweight                                Neutral                           Underweight                Overweight                     Neutral            Underweight
     •    U.S. Small Cap                       •    U.S. Large Cap                                          •   High Yield                 •   MBS            •     Agencies
                                                    Growth
     •    U.S. Large Cap Value                                                                              •   IG Corporates              •   Muni’s         •     CMBS
     •                                         •    Eurozone
          Emerging Markets                                                                                  •   TIPS                                          •     Treasuries
                                               •    Japan
                                                                                                            •   Emerging
                                               •    United Kingdom                                              Markets
                                                                                                            •   International
                                                                                                                Developed

Prepared exclusively for Signature Wealth Management. Not for Distribution to the Public.
                                                                                                                                                                                 28
Longer-Term We Think 2020 Was A Cyclical Bear in a
Secular Bull
                                Secular Bears:                                              Cyclical Bears (during Secular Bulls):

Source: Bloomberg as of April 2020.
Past performance is no guarantee of future results

Prepared exclusively for Signature Wealth Management. Not for Distribution to the Public.
                                                                                                                                     29
Not All Bear Markets Are Created Equal

                                                                         Secular Bear Market          Cyclical Bear Market
                                     Duration until                      10 to 20 years               12 to 18 months
                                     new high

                                     Depth to down                       Multiple 40% declines        Usually 20%, occasionally
                                     move                                                             30%, never 40%+

                                     Typical drivers                     -Long recession/             -Short recessions
                                                                         depression                   -Market accidents
                                                                         -Stagflation
                                                                         -Poor policy response
                                                                         -Financial crisis/ capital
                                                                         destruction

Source: Federated Hermes.

Prepared exclusively for Signature Wealth Management. Not for Distribution to the Public.
                                                                                                                                  30
We Continue to Believe that the Secular Bull is Intact
We Expect Markets to Surpass Their Old Highs

                      The History of the Bull and Bear Market

Note: Shaded areas indicate recessions.
Source: Bloomberg, Federated Hermes. As of January 2021. Past performance is no guarantee of future results. For illustrative purposes only and not representative of any specific investment.

Prepared exclusively for Signature Wealth Management. Not for Distribution to the Public.
                                                                                                                                                                                                 31
The Digitization Revolution is Changing Traditional Rules of Thumb for
Economic/ Market Forecasters
                                              A Flurry of Innovation is Changing the Nature of Business
                                                     and Leading to a More Productive Economy

Source: Federated Hermes.

Prepared exclusively for Signature Wealth Management. Not for Distribution to the Public.
                                                                                                          32
The Digital Revolution Is Occurring Alongside the Rise of the Millennials

                                                                                            33
Source: Federated Hermes; Goldman Sachs. As of December 2018.

Prepared exclusively for Signature Wealth Management. Not for Distribution to the Public.
The Five Key Long Term Drivers of This Secular Bull Market
Are Accelerating, Not Weakening. . .

                                                                                            Impact on Driver of Bull Getting
                                                                           Driver
                                                                                                      the Virus

                                                                 Digital Revolution                   Accelerated

                                                                Biotech Revolution                    Accelerated

                                                  U.S. Manufacturing Renaissance                      Accelerated

                                                       Supportive Policy Backdrop                     Lengthened

                                                        You Can’t Own Everything                 Deepened, Lengthened

Views as of April 2020.

Prepared exclusively for Signature Wealth Management. Not for Distribution to the Public.
                                                                                                                               34
The US Manufacturing Renaissance Will See Supply Chains
Come Back Home
                                ”Brand China” Is Wounded                                     The Center of the US is the
                                                                                            Next Great “Emerging Market”

                                            •   Higher shipping costs                         • Abundance of land
                                            •   Higher energy costs                           • So much energy we burn it at the well
                                            •   No IP protection                              • Easy shipping routes to the best end
                                            •   Geopolitical risks                              markets (i.e. East and West coast)
                                            •   Lack of Transparency                          • Ironclad IP protection
                                            •   Pandemic Origination                          • One of the lowest tax rates in the world
                                                                                              • No new diseases from Kentucky
                                                                                              • Amber waves of grain

Prepared exclusively for Signature Wealth Management. Not for Distribution to the Public.
                                                                                                                                           35
The Digital Revolution Accelerates
For the First Time Ever, Digital Investments Surpasses Physical Investments

                                                                                       Business Investment By Type

                                     58.00%

                                     56.00%

                                     54.00%

                                     52.00%

                                     50.00%

                                     48.00%

                                     46.00%

                                     44.00%

                                     42.00%
                                                                             Business Investment: Physical      Business Investment: Digital
                                     40.00%

Source: Bureau of Economic Analysis & Federated Hermes as of August 2020.

Prepared exclusively for Signature Wealth Management. Not for Distribution to the Public.
                                                                                                                                               36
Labor Market is Realigning
Continuing Claims Have Fallen by 21 million, While Initial Claims Remain Elevated

Source: Bloomberg. As of February 3, 2021.

Prepared exclusively for Signature Wealth Management. Not for Distribution to the Public.
                                                                                            37
Productivity Rising
As companies realign their capital and labor, this bodes well for productivity growth

Source: Bloomberg. As of February 3, 2021.

Prepared exclusively for Signature Wealth Management. Not for Distribution to the Public.
                                                                                            38
The Democratic Sweep Brings A Risk of Higher Taxes

Higher Corporate Tax Rates                                                                  Higher Estate Taxes
    Raise corporate tax rate from 21% to 28%                                                  Increase tax rate from 40% to a graduated rate
    Create a minimum 15% book tax rate                                                        of 77%, reduce the exemption from $11.58M to
                                                                                              $3.5M, and eliminate the step-up basis on estate
    Double the global minimum tax on offshore                                                 taxes
    profits from 10.5% to 21%
    Carried interest treated as ordinary income                                             Double the Federal Minimum Wage from
                                                                                            $7.50 to $15 per Hour
    Introduce a financial transactions tax
                                                                                              Higher consumer prices
Higher Individual Tax Rates
                                                                                              Lower profit margins
    Restore the top tax rate at 39.6%
                                                                                              Increased unemployment
    Tax capital gains (20%) & dividends (22%) at
    ordinary rates                                                                          Expand the Affordable Care Act
    Cap deductions at 28%
                                                                                            College Education
    Does not fully restore the SALT deduction
                                                                                              Free two-year community college and four-year
Increase Social Security Benefits                                                             college for families making less than 125K
   Eliminate the income cap on Social Security
   taxes (12.4%), currently at $142,800                                                     Absolve $1.6 trillion student-loan debt
                                                                                              10k max per borrower

Prepared exclusively for Signature Wealth Management. Not for Distribution to the Public.
                                                                                                                                                 39
This Could Disproportionately Impact Tech

                                            Estimated S&P 500 Earnings Impact Based on Biden’s Proposals

Note: Utilities and Equity Real Estate Investment Trusts (a Real Estate industry) were excluded from the analysis.
Source: US Equity & Quant Strategy, Compustat Global Research as of July 20, 2020.

Prepared exclusively for Signature Wealth Management. Not for Distribution to the Public.
                                                                                                                     40
Is Manchin the Linchpin?
New Moderate Bi-partisan Senate Coalition:

                                                                                            Joe Manchin III
                                                                                            (D) West Virginia

                                                                               Krysten Sinema           Jon Tester
                                                                               (D) Arizona              (D) Montana

                                                              Susan Collins                 Lisa Murkowski       Mitt Romney
                                                              (R) Maine                     (R) Alaska           (R) Utah

Prepared exclusively for Signature Wealth Management. Not for Distribution to the Public.
                                                                                                                               41
New Democratic Presidents Have Produced Strong Equity Market
Gains in Their First Year

Source: Strategas Research Partners. As of January 20, 2021. Past performance is no guarantee of future results.

Prepared exclusively for Signature Wealth Management. Not for Distribution to the Public.
                                                                                                                   42
Historically Control of Congress Matters Most for Stocks

                                                                                                                  *

Source: Strategas Research Partners as of January 20, 2021. Past performance is no guarantee of future results.
* 2001-2002 excluded from the chart because the 2000 election resulted in a 50/50 Senate.

Prepared exclusively for Signature Wealth Management. Not for Distribution to the Public.
                                                                                                                      43
                                                                                                                       43
But Politics Aren’t Everything
Historically, the Business Cycle Matters More For the Direction of Markets

                           Business Cycles Have Mattered More Than the Party in the Oval Office

Chart shows annual data as of December 31, 2019.
Source: Bloomberg, Morgan Stanley & Co. Research, NBER, Bloomberg, Haver Analytics. The Morgan Stanley Cycle Indicators measure the deviation from historical norms for macro factors including employment, credit conditions,
corporate behavior and the yield curve. The repair phase occurs due to the lag time between when these factors are beginning to improve and when they turn positive. Report as of July 24, 2020.

Prepared exclusively for Signature Wealth Management. Not for Distribution to the Public.
                                                                                                                                                                                                                                 44
The Math Behind Various Approaches Over a Full Market Cycle
Despite the Uncertainty, Averaging In Historically Pays

Source: .Federated Hermes, Inc. and Bloomberg, 2020. As of 2/19/20.
Based on hypothetical investments in S&P 500. Indexes are unmanaged and actual investments cannot be made in an index.
Past performance is no guarantee of future results. For illustrative purposes only and not representative of any specific investment. Please note that the total investment amounts are different for these examples. See details in the
table above.

Prepared exclusively for Signature Wealth Management. Not for Distribution to the Public.
                                                                                                                                                                                                                                           45
And Has Been A Winning Strategy Over Time
Since 1929, Averaging Has Outperformed the Market in Every Decade Except for the 2000’s

                       If an investment of $100,000 is made on the last day of a decade, what would the returns – cumulative and average annual –
                       look like for the following decade?

                       Like in the previous slide, the “buy & hold” approach represents a one-time investment of $100,000 in the S&P 500, and no
                       additional investments are made. The “monthly dollar cost average” approach represents and investment of $100,000 in the
                       S&P 500, and an additional $1000 investment is made monthly on the last day of the month.

Source: Federated Hermes, Inc. and Bloomberg, 2020. As of 12/31/19.
Based on hypothetical investment in S&P 500. Indexes are unmanaged and actual investments cannot be made in an index.
Past performance is no guarantee of future results. For illustrative purposes only and not representative of any specific investment. Please note that the total investment amounts are different for these examples.
Dollar-cost-averaging cannot assure a profit or protect against loss in declining markets. Because it involves continuous investment regardless of fluctuating prices, investors must consider their financial ability to continue purchases
during periods of low price levels.

Prepared exclusively for Signature Wealth Management. Not for Distribution to the Public.
                                                                                                                                                                                                                                               46
Biography

Prepared exclusively for Signature Wealth Management. Not for Distribution to the Public.
                                                                                            47
You can also read