GREATER HOBART MOBILITY VISION - 30 YEAR STRATEGY hobartvision.ract.com.au
←
→
Page content transcription
If your browser does not render page correctly, please read the page content below

GREATER
HOBART
MOBILITY
VISION
30 YEAR STRATEGY

hobartvision.ract.com.au

                           30-YEAR RACT GREATER HOBART MOBILITY VISION | APRIL 2019 | 1
GREATER HOBART AREA 2019
                                                        “Our city is on the cusp of some rapid
                                                        development and this is a golden opportunity
                                                        to design a city for the people that live in it,
                                                        rather than the cars that drive in it.”
             Brighton

                                   Sorell

      Glenorchy         Clarence

                                                        “Wouldn’t it be awesome for Hobart to
                   Hobart
                                                        become cleaner and greener and kinder?”

                  Kingborough                           “If we can’t afford a light rail system along
                                                        the old rail line to the northern suburbs, then
                                                        a flexible bus-only route along the same line
                                                        should be considered.”

                                                                        Source: Greater Hobart Mobility Vision survey 2018

                                            30-YEAR RACT GREATER HOBART MOBILITY VISION | APRIL 2019 | 1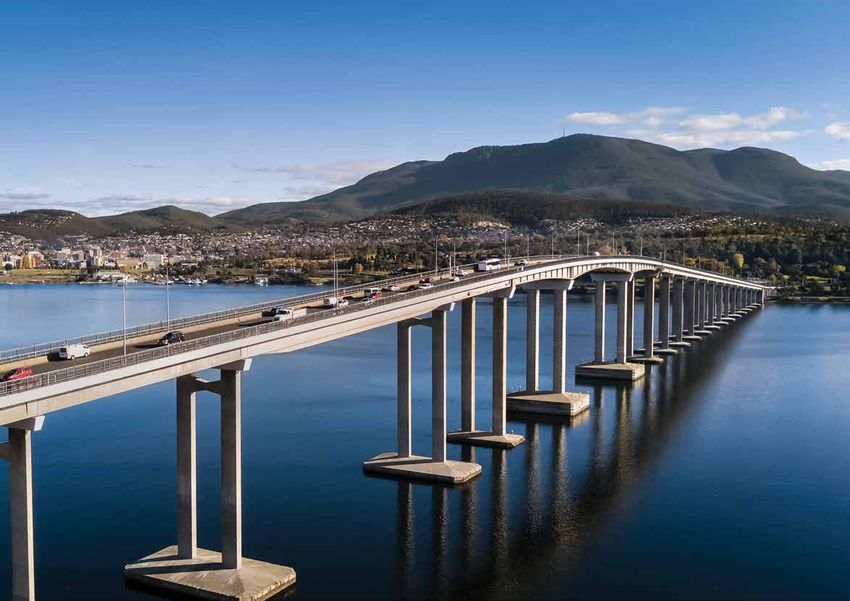
INTRODUCTION
        The vast majority of Greater Hobart residents rely on a motor vehicle for          Our aim is to achieve a shift in traveller behaviour from private vehicle transport
        transport – almost 90%* of households have one or more registered vehicles.        to public and active transport options in the first 10 years of the vision.
        In addition, 84%* of residents take a private vehicle to work and more than
                                                                                           Hobart has the highest percentage of car use for commuting of all capital cities
        50%^ of all employment occurs within the Hobart CBD.
                                                                                           in Australia. Currently, 84%* of commuters utilise a private vehicle to get to
        With a rapidly growing population – currently about 230,000 but predicted          work, meaning that 16% use other modes. If this mode share was increased to
        by the Australian Bureau of Statistics (ABS) to reach 300,000 by 2050 –            20%, it would only represent a 4% reduction in private vehicle use, but would
        congestion has become a major issue for our residents.                             make a significant difference to the efficiency of the road network at peak
                                                                                           times. It would also move Hobart more in line with the majority of other capital
        This is evidenced by a recent Australian Automobile Association (AAA) survey
                                                                                           cities.
        that listed Hobart as the fourth most congested city in Australia behind Sydney,
        Melbourne and Adelaide.                                                            We believe this mode share of 20% can be achieved by making public and
                                                                                           active transport more affordable and attractive to use, as well as looking to shift
        The way people access jobs, goods and services is changing, with global
                                                                                           land use planning towards more high density development along public and
        and local issues impacting on the Tasmanian lifestyle. Some of the changes,
                                                                                           active transport corridors.
        such as traffic congestion, are occurring now. Others, such as new vehicle
        technology, are just around the corner.                                            While all of this is happening, we also recommend the start of analysis and
                                                                                           assessment for major infrastructure project(s), which would be implemented in
        The RACT 30-year Greater Hobart Mobility Vision prepares Tasmanians for a
                                                                                           the following 10 years of the Vision in the instance that the 20% mode share
        transformed mobility landscape – one in which increased choice provides safer,
                                                                                           cannot be achieved, or if population growth exceeds expectations.
        more efficient and sustainable approaches to the way we move around our
        state.                                                                             Our Vision has undergone an independent financial assessment to determine
                                                                                           the indicative cost of each stage to highlight the need for a system of trial and
        We have taken a staged approach to the Vision, mapping out changes
                                                                                           review and ensure it continues to meet the needs of all Tasmanians. Costs
        across infrastructure, public and active transport, urban planning, social and
                                                                                           can only be regarded as indicative and could be subject to significant variation
        community issues as well as future mobility and emerging technology.
                                                                                           when actual projects are better defined.
        We have kept the future of Tasmania in mind – focusing in the short term on
                                                                                           To that end, this document will be regularly reviewed to ensure population
        shifting people’s behaviours and patterns to embrace new technology and
                                                                                           changes, transport patterns, technology advances, work and study patterns and
        mobility options for a cost-effective and sustainable future for the state.
                                                                                           costs of implementation are all considered. Any updates will remain consistent
                                                                                           with the overall Vision for Greater Hobart detailed in this document.

        *Source: ABS data 2016-2018.
        ^Source: City of Hobart Transport Strategy 2018.

2 | 30-YEAR RACT GREATER HOBART MOBILITY VISION | APRIL 2019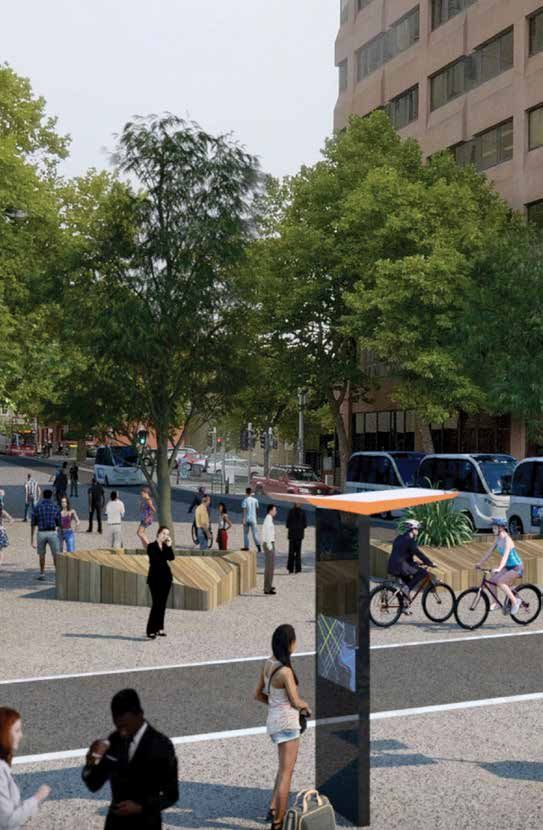
Vision summary
Years 1-5 focus on ‘quick wins’ for mobility; making public and active
transport more affordable and usable; improving land use planning;
and analysing access options for major infrastructure projects.
Indicative cost: $64 million
Years 6-10 build on the first five years, continuing to strengthen public
transport and support multiple occupancy modes of transport, as well
as separating active transport modes from vehicles. Business case(s)
would also be developed for major infrastructure project(s).
Indicative cost: $31 million
Years 11-20 are separated into two streams, dependent on whether
the shift to 20% mode share is achieved in the first 10 years or
whether major infrastructure project(s) are required. This stage would
also include the integration of low/zero emission transport options.
Indicative cost with major infrastructure: $1.5 billion
Indicative cost without major infrastructure: $214 million
Years 21-30 focus on emerging technology such as autonomous
vehicles and smart-city options including vehicle communication with
traffic signals to ensure smooth flow.
Indicative cost $26 million
Indicative cost information provided by pitt&sherry.

                                                                            30-YEAR RACT GREATER HOBART MOBILITY VISION | APRIL 2019 | 3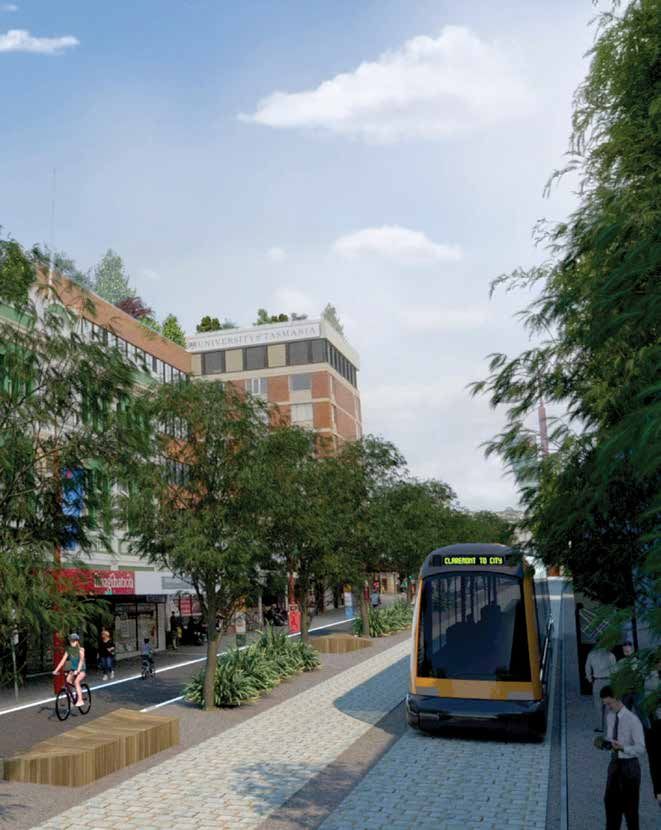
GREATER HOBART TODAY
        Key facts about Greater Hobart residents*                              Greater Hobart in 2019:
                                                                               • Currently home to about 230,000* people.
                                                                               • There are up to 35,000^ vehicle movements on both Macquarie

                       84%                                    8%                 and Davey streets each working day.
                                                                               • Hobart is the fourth most congested city in Australia#.
                                                                               • Congestion in Hobart costs the Tasmanian economy
         of residents travel to work by          walk or cycle to work.          approximately $100 million## per year, based on private time costs,
                 private vehicle.                                                business time costs, extra vehicle operating expenses and vehicle
                                                                                 emission costs.
                                               Average commute is only
                                                                               • Over the previous five years, drivers travelling from Sorell to the

                       6%                           13.8km
                                                                                 Hobart CBD experienced an increase in travel time similar to
                                                                                 some major highways in Sydney and Melbourne#.
                                                                               • During morning peak, an average of 79% of cars travelling
                                                                                 from the northern suburbs, 77% from the south and 76% from the
              use public transport            Which is below the national        east complete their journey in the city**.
               to travel to work.                average of 16.5km.
                                                                               • In the afternoon peak, an average of 73% of cars to the northern
                                                     Approximately               suburbs, 76% to the south and 66% to the east commence their
                                                                                 journey in the city**.

                  1.5-2%                                  85%                  • More than half of all employment in Greater Hobart is in the CBD^^.

          approximate increase in car           of dwellings in Greater
             ownership every year.               Hobart are detached,
         About 90% of private dwellings        causing urban sprawl and
         have more than one registered         pushing the road network        *Australian Bureau of Statistics 2016-2018
                motor vehicle.                further from the city centre.    ^Source: Department of State Growth, 2016
                                              Nationally, the figure is 73%.   #
                                                                                Source: AAA, 2018
                                                                               ##
                                                                                 Source: BITRE, 2015
                                                                               ^^Source: City of Hobart Transport Strategy 2018
                                                                               **Source: Department of State Growth, 2017.

4 | 30-YEAR RACT GREATER HOBART MOBILITY VISION | APRIL 2019
GREATER HOBART IN 30 YEARS
           300,000                                                    3%                                  20%                             12,000
      predicted population                                                                       of household electricity           projected increase in people
                                                             annual increase in             consumption could be devoted to
   based on medium population                                                                                                     living in the Kingborough area,
                                                          congestion costs a year,             charging electric vehicles^.
       growth outcomes*.                                                                                                           followed by Clarence, Brighton,
                                                      reaching more than $273 million
                                                                                                                                 Glenorchy, Sorell, the Huon Valley
                                                                 by 2050^.
                                                                                                                                    and inner Hobart. The rate of
                                                                                                                                  growth is expected to be highest
                                                                                                                                    in outlying areas, with Sorell,
                                                                                                                                 Kingborough and Brighton leading

                    27%                                                 x2                             $70M                                   the trend#.

                                                       Each household is expected to              rise per year in total
  increase in vehicle kilometres                        own approximately two cars,          transport related Greenhouse
     travelled by private car,                       slightly higher than today’s vehicle         Gas (GHG) emissions
 with each resident travelling more                      ownership levels with almost       due to population growth and car-
 than 7000km a year on average^.                        30,000 additional vehicles on           dependency in the state^.
                                                              Tasmania’s roads^.

*Source: Australian Bureau of Statistics 2017
^Source: Deloitte Access Economics, 2019
#Source: Department of Treasury and Finance, 2014.

                                                                                                         30-YEAR RACT GREATER HOBART MOBILITY VISION | APRIL 2019 | 5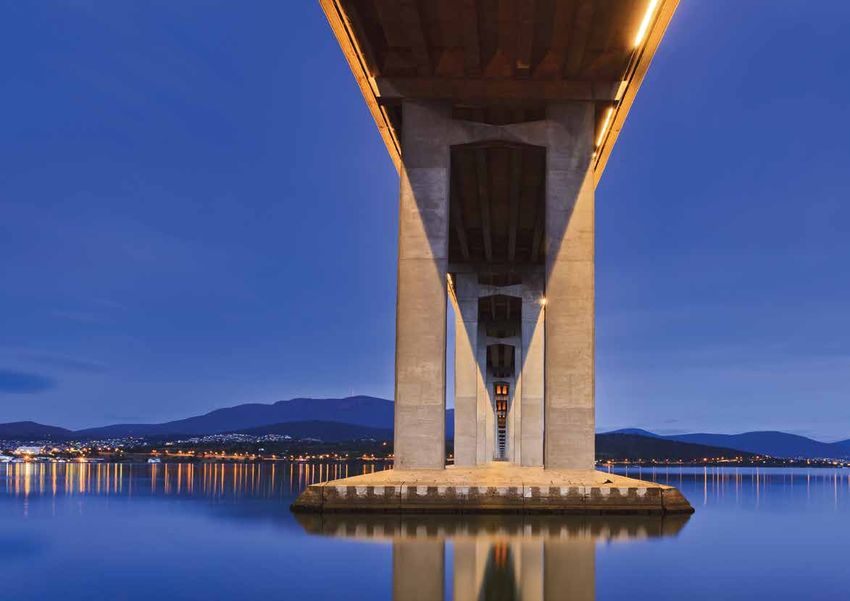
COMPARATIVE CITIES
        Other small cities are stepping up to the challenges arising from population growth and increasing congestion. Although no city has a ‘perfect’ transport system,
        Hobart can learn from some of the lessons elsewhere. The below cities utilise multiple modes of transport to address similar challenges to those that Hobart faces, and
        are examples of where we want our city to be.

        DARWIN,                            CANBERRA,                           WELLINGTON,                        FREIBURG,                           BREMEN,
        AUSTRALIA                          AUSTRALIA                           NEW ZEALAND                        GERMANY                             GERMANY
        Darwin is a flat seaside           Canberra is also a level            Wellington has a similar           Freiburg is a flat city with        Bremen is another level city
        city with a passenger ferry        city with a light rail and          topography to Hobart with          an extensive pedestrian-            that operates trams and
        service and bus network.           bus network, coupled                a flat CBD and elevated            only area in its CBD, a             buses as part of its public
                                           with a series of city-wide          suburban area, as well as a        public transport system             transport network.
                                           cycleways.                          large harbour that caters for      based around trams and
                                                                               a passenger ferry service.         feeder buses as well as
                                                                               Public transport in Wellington     approximately 450km of
                                                                               includes rail and buses, with      cycleways.
                                                                               cycleways also available.

        Analysis of population density, topography and transport modes indicates that Hobart is best compared to fellow Australian cities Canberra and Darwin, as well as
        international cities such as Wellington in New Zealand and German cities Bremen and Freiburg (Deloitte Access Economics, 2019).

6 | 30-YEAR RACT GREATER HOBART MOBILITY VISION | APRIL 2019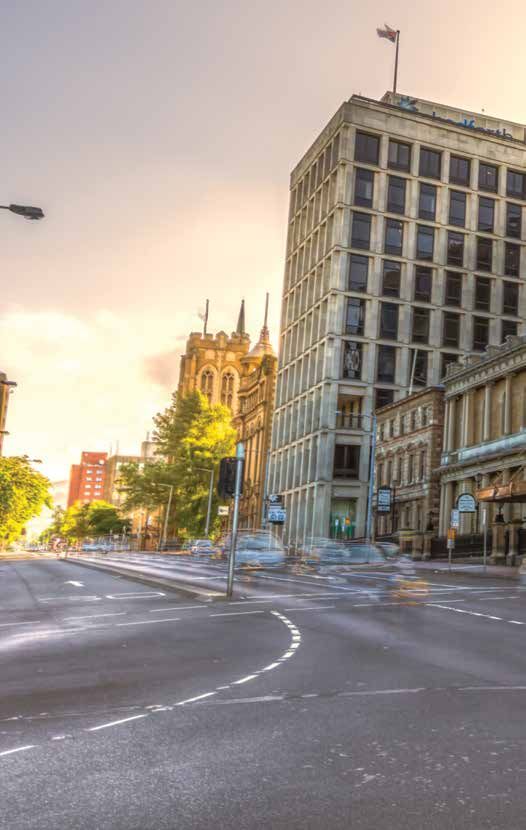
TASMANIANS HAVE THEIR SAY
A majority of Tasmanians have indicated support       • 30% of people consider that inadequate
for a move towards active and public transport.         public transport is the biggest contributor to             “I would use the public transport system
                                                        congestion in Hobart.                                      more if it was more cost effective.”
They also say infrastructure changes need to be
made to minimise the impact of vehicles in the CBD.   • The top four worst rated pinch points in order
                                                        included Macquarie Street, Davey Street, the
New technologies and ‘Smart City’ principles
                                                        Southern Outlet and the Tasman Bridge.
are also popular with Tasmanians and have
the potential to significantly change the way         • 54% said work was the main reason to
we travel.                                              travel into the CBD, with most respondents                 “A ferry would be good providing there
                                                        commuting into the city five days a week.                  was parking, and co-ordinated bus
Tasmanians also say the River Derwent should be
a key part of our transport future.                   • 72% of CBD commuters sometimes or often                    services at each end.”
                                                        have other tasks they complete on their trip –
RACT Greater Hobart Travel Behaviour Survey
                                                        sometimes or each time they travel.
2018 showed:
                                                      • 87% of respondents often or sometimes pass
• 75% of respondents commute by private
                                                        through the CBD to get somewhere else.
  vehicle, with nearly 50% as the sole occupant.
                                                                                                                   “We desperately need separated bicycle
• 23% of respondents are most likely to walk                                                                       paths in many areas and much better
  or cycle in Greater Hobart.                                                                                      public transport.”
• 63% of respondents living an accessible
  distance from a proposed ferry route between
  Bellerive and Hobart said that they would use
  the service.
• 8% of respondents are most likely to travel on
  public transport in Greater Hobart.
• 33% of respondents consider that an
  insufficient road network is the main
  contributor to congestion in Greater Hobart.

                                                                                                    30-YEAR RACT GREATER HOBART MOBILITY VISION | APRIL 2019 | 7
OUR VISION
        We have created a 30-year Vision for the future of Greater
        Hobart, which considers:

                 Infrastructure                        Land use planning

                Public transport                        Active transport

                                                                                       A PEOPLE-FOCUSED CITY
                                                                                       Where people of all ages feel safe, are encouraged to be healthy
                                                                                       and the natural beauty of the city is enhanced.
                                                                                       • Reduce interaction between cars and people in the CBD.
         Social and community cohesion                Future technologies              • Densify development in the CBD and around transport options, including low-
                                                                                         cost housing options.
                                                                                       • Create more shared spaces and multi-use zones.
        The RACT will act on behalf of all Tasmanians to progress long-term
        options that provide safe, sustainable and accessible mobility for everyone.   • Prioritise shared mobility options.

8 | 30-YEAR RACT GREATER HOBART MOBILITY VISION | APRIL 2019
AN ACCESSIBLE CITY                                            A FUTURE-READY CITY
Where travel between key origins and destinations is easily   Prepared for changes in our demographics and new
achieved by a range of travel modes.                          technological developments.
• Increase private, public and active transport options.      • Introduce innovative public transport options such as a trackless tram from
                                                                the northern suburbs to the CBD.
• Install rapid transit services.
                                                              • Invest in data to enable commuters to make informed decisions.
• Convert on-street parking to separated cycleways.
                                                              • Conduct high profile autonomous trials in strategic, low-traffic locations to
• Establish commuter ferry services on the River Derwent.
                                                                gradually transition transport options to autonomous within 30 years.
                                                              • Utilise Intelligent Transport Systems, such as technology that allows vehicles
                                                                to communicate with traffic signals, to facilitiate traffic flow.
                                                              • Create seamless mobility through access to multiple travel options on one
                                                                booking and payment system.

                                                                             30-YEAR RACT GREATER HOBART MOBILITY VISION | APRIL 2019 | 9
BEHAVIOUR CHANGE
Government, business and the community need to support the introduction of new For Greater Hobart, reducing the proportion of
mobility options. Hobart’s transport network cannot improve without behaviour change. people that use a private vehicle to get to work
from 84% to 80% within 10 years would be an
This takes time, alternatives and a willingness to change. ambitious but achievable target.
You have told us it is cheaper and faster to sit in
congestion and pay for parking than it is to use
40%
Having a vehicle gives us flexibility to live our
public transport and that it is just too difficult
lives the way we choose. Some people choose to
and/or unsafe to ride a bike to work or school.
use them daily, some less often. Some for short
commutes, others for longer drives. Also, the first and last mile barrier is significant
– for example, it is difficult to cross Macquarie
However, for Greater Hobart to be able to of respondents to the study either did not and Davey streets in peak hour in order to reach
continue to be a place where we all want to live have access to, or could not ride a bicycle. current public transport networks to travel home
and work, things need to change. We understand Approximately 80% had access to a car or to work.
not every person can change the way they travel, or motorcycle^.
but every little bit counts. Experience is another important factor. People
need to be comfortable, connected, well
informed, safe and offered modern payment
options.
40% 84% Striking the right balance between experience,
cost and time will have a big impact on
encouraging those wanting and able to make a
change.
of respondents to the Tasmanian Travel and of journeys to work in Greater Hobart
Physical Activity Study said that bus frequency, are made by private vehicle.
timetabling, complicated trips and delays were With 14% by public or active transport*.
the main reasons to avoid using this mode of
transport in Tasmania.
About 20% said they chose to drive, ride a
motorcycle, walk or cycle instead^.
*Source: Australian Bureau of Statistics 2016-2018.
^Source: Menzies Institute for Medical Research, 2018
10 | 30-YEAR RACT GREATER HOBART MOBILITY VISION | APRIL 2019APPROACH AND TIMELINE
Infrastructure Urban Planning Public Transport
Deliver projects that allow for efficient transport Develop a Greater Hobart settlement strategy. Invest in public transit prioritisation, rapid services,
flow, regardless of the mode. Infrastructure that This would focus on compact urban development first and last mile networks for active travel links,
supports behavioural change should be delivered and mixed-use spaces around public and establishment of a ferry network and utilisation of
in the short-term with a major project fully active transport, as well as decentralisation of low/zero emission and autonomous vehicles.
planned if alternative options are not supported. industries, services and attractions. Greater
urban density makes walking, cycling and public Active Transport
Social and Community transport options more viable.
Focus on separating cyclists and pedestrians
Create more shared community spaces and from vehicles through cycleways and walkways,
Future Mobility and Emerging Technology
local precincts that are connected to housing, with a view to remove or significantly reduce
active and public transport options, employment, Convert Hobart into a national leader in mobility the number of vehicles in the Hobart CBD.
education and services. technology through investment in autonomous Also encourage high integration of active and
and electric/low-emission vehicle technology. public transport.
A staged, scheduled approach will be required to incorporate shifting priorities and mobility options.
Each year bracket below requires different priorities to ensure mobility in Hobart is moving forward.
Years 1-5 Years 6-10 Years 11-20 Years 21-30
Indicative cost: $64 million Indicative cost: $31 million Indicative cost with major Indicative cost: $26 million
infrastructure: $1.5 billion
• Focus on ‘quick wins’ for mobility. • Support multiple occupancy modes. • Rollout emerging technology
• Make public and active transport • Continue to strengthen public Indicative cost without major options.
more attractive. transport. infrastructure: $214 million • Establish a highly connected
• Commence improvements in land • Separate active transport from • Deliver major infrastructure mobility network.
use planning. vehicles. project(s) to significantly reduce the
• Analyse and assess options for • Develop business case(s) for major volume of vehicles in the CBD (if a
major infrastructure project(s). infrastructure project(s). mode share of 20% has not been
achieved in years 1-10).
• Integrate low/zero emission
transport options.
30-YEAR RACT GREATER HOBART MOBILITY VISION | APRIL 2019 | 11ACTIONS
RACT’s Greater Hobart Mobility Vision identifies • Retrofit existing infrastructure to provide
priority actions for the next 30 years. The below connections to active transport spines.
allocates timing for all identified actions – some • Develop a settlement strategy that encourages
of which should be delivered in the short term infill development and densification around
while some have longer timeframes. public transport routes and active urban
centres. This should focus on:
YEARS 1-5
- Appropriately pricing and managing supply
Indicative cost: $64 million of parking opportunities in the CBD.
• Deliver infrastructure projects that reduce - Higher density in existing urban areas.
interaction between people and vehicles in the
- Shifting some large-scale industry and
CBD (eg. shared spaces similar to Liverpool St).
freight services from the Derwent Park
• Establish limited ferry service with up to three area closer to the Brighton industrial hub,
routes between the CBD and Eastern Shore. allowing for more residential development
• Establish a scheme to subsidise patronage of closer to the Hobart CBD.
public transport. • Enforce clearways on Macquarie and Davey
• Create ‘end of line’ park-and-ride facilities to streets, as well as a review of pinch points to
service key population centres (eg. Bridgewater, determine other priority locations for clearways.
Kingston, Sorell, Howrah and Claremont) with RACT supports the removal of on-street
low cost/free parking. parking to facilitate this.
• Remove on-street parking in key locations to • Establish priority measures to support ride and
facilitate prioritisation measures for public car sharing services.
transport (eg. Main Rd/Elizabeth St, Sandy Bay • Undertake analysis and assessment of options
Rd), as well as separated cycleways. for infrastructure projects that significantly
• Commence work on active transport spines in reduce the volume of traffic in the city, if a
the CBD in each direction, including from the mode share of 20% is not achieved in 10 years.
Rivulet Track to Intercity Cycleway, Elizabeth • Commence implementation of a single ticket
St south and north bound and from Sandy Bay system as ferry service commences.
to CBD.
• Commence planning for systems to enable a
• Upgrade public transport infrastructure and mobility network where users can access all
access to information (eg. bus shelters, arrival transport modes under a single ticketing and
and departure times). payment gateway (ie. ‘mobility as a service’).
12 | 30-YEAR RACT GREATER HOBART MOBILITY VISION | APRIL 201930-YEAR RACT GREATER HOBART MOBILITY VISION | APRIL 2019 | 13
ACTIONS CONTINUED
        YEARS 6-10                                                • Continue work on active transport spines in the       • Extend ferry network to up to eight terminals,
                                                                    CBD, including from the Rivulet Track to Intercity      each within a kilometre of key cycleways and
        Indicative cost: $31 million                                Cycleway, Elizabeth St south and north-bound            footpaths, stretching north and south of the city.
        • Continue to deliver infrastructure projects that          and from Sandy Bay to the CBD.                          Ferries should also have capacity for bicycles.
          reduce interaction between people and vehicles          • Continue to retrofit existing infrastructure to          - It is important that this network is funded
          in the CBD (eg. improve the active transport              provide connections to active transport spines.             sufficiently to enable it to reach full potential,
          connection between the waterfront and CBD).                                                                           which includes high-quality vessels and
                                                                  • Begin to focus investment around regional
        • Establish transport hubs at key destinations                                                                          terminal services. It is also contingent on a
                                                                    transport hubs to stimulate shared spaces and
          including Royal Hobart Hospital, Hobart Airport,                                                                      review conducted during years 6-10.
                                                                    residential growth.
          University of Tasmania.                                                                                         • Commence operation of an innovative
                                                                  • Continue to plan and source funding for a major
        • Establish prioritisation measures for shared                                                                      northern suburbs public transport option that
                                                                    infrastructure project to significantly reduce the
          mobility on key arterials (eg. ride share, car                                                                    concentrates on high-density routes.
                                                                    volume of traffic travelling into and through the
          share, public transport and multiple occupancy            CBD, if a shift to a mode share of 20% is not         • Establish comprehensive prioritisation measures
          vehicles).                                                achieved in the first 10 years of this plan.            for shared mobility on key arterials such as the
        • Create more shared, low-speed environments in                                                                     Southern Outlet, Tasman Hwy and Brooker Hwy
          the CBD.                                                YEARS 11-20                                               (eg. ride share, car share, public transport and
                                                                                                                            multiple occupancy vehicles).
        • Implement a specific northern suburbs transit           Indicative cost with major infrastructure:
          corridor that concentrates on a high density            $1.5 billion                                            • Begin to integrate low/zero emission and
          route, which could utilise a section of the existing                                                              autonomous vehicles for public transport with
          rail corridor, but then use on-road infrastructure      Indicative cost without major infrastructure:             a particular focus on connecting with other
          to terminate in the CBD. If the existing rail           $214 million                                              transport options.
          corridor is to be used it requires higher residential   • If a mode share of 20% has not been achieved          • Continue to concentrate housing development
          density to support a mass transit solution. In            in years 1-10, deliver a previously planned             in urban areas and in higher density hubs in
          addition, a Macquarie Point terminus would be             and costed major infrastructure project to              outlying areas.
          too far from other transit options in the CBD.            significantly reduce the volume of vehicles
                                                                    travelling into and through the CBD, particularly     • Continue to retrofit existing road infrastructure to
        • Concentrate housing development in existing                                                                       provide connections to active transport spines.
          urban areas and commence the development of               on Macquarie and Davey streets.
          higher density hubs in outlying areas.                  • If a mode share of 20% has been achieved,             • Invest in regional transport hubs to stimulate
                                                                    continue to reduce interaction between people           shared spaces and residential growth.
        • Continue to operate a ferry network of up to
          three routes and conduct a thorough review of             and vehicles in the city, including the significant   • Continue to encourage the development of low-
          the service, including impact on the road network.        reduction of people from Macquarie and Davey            cost housing in central locations.
                                                                    streets, through delivering better active transport
                                                                    options between the waterfront and CBD.

14 | 30-YEAR RACT GREATER HOBART MOBILITY VISION | APRIL 2019
• Increase investment in Intelligent Transport
Systems that allow vehicles to communicate
with traffic signals and other infrastructure to
facilitate efficient and safe movement.
• Continued enhancement of Mobility as
a Service as new modes of transport
become available.
YEARS 21-30
Indicative cost $26 million
• Retrofit Tasman Bridge to support more road
users by dedicating existing space to shared and
active options.
• Continue to enact a settlement strategy with
a focus on densifying existing housing that
surrounds the hubs created in previous periods.
• Complete work on separated cycle paths as part
of road upgrade projects with a focus on high-use
routes (Main Rd/Elizabeth St, Channel Highway/
Sandy Bay Rd and Clarence St), with a view to
continue into other locations in future years.
• Complete integration of low/zero emission and
autonomous vehicles for public transport with
a particular focus on connecting with other
transport options.
• Continue to invest in Intelligent Transport
Systems that allow vehicles to communicate
with traffic signals and other infrastructure to
facilitate efficient and safe movement.
30-YEAR RACT GREATER HOBART MOBILITY VISION | APRIL 2019 | 15Theme Project Years 1-5 Years 6-10 Years 11-20 Years 21-30
Deliver infrastructure projects that reduce interaction between people and
vehicles in the CBD
Create ‘end of line’ park-and-ride facilities to service key population centres (eg.
Bridgewater, Kingston, Sorell, Howrah, Claremont) with low cost/free parking.
Enforce clearways on Macquarie and Davey streets, as well as a review of pinch
points to determine other priority locations for clearways. RACT supports the
removal of on-street parking to facilitate this.
Create more shared, low-speed environments in the CBD.
Undertake analysis, assess options, plan and source funding for infrastructure
projects that significantly reduce the volume of traffic in the city, if a mode share
Infrastructure of 20% is not achieved in 10 years.
If a mode share of 20% has not been achieved in years 1-10, deliver a previously
planned and costed major infrastructure project to significantly reduce
the volume of vehicles travelling into and through the CBD, particularly on
Macquarie and Davey streets.
If a mode share of 20% has been achieved, continue to reduce interaction
between people and vehicles in the city, including the significant reduction
of people from Macquarie and Davey streets through delivering better active
transport options between the waterfront and CBD.
Retrofit the Tasman Bridge to support more road users by dedicating existing
space to shared and active options.
Establish prioritisation measures for shared mobility on key arterials (eg. ride
share, car share, public transport and multiply occupancy vehicles).
Focus investment around regional transport hubs to stimulate shared spaces
Social and
and residential growth.
Community
Establish comprehensive prioritisation measures for shared mobility on key
arterials (eg. ride share, car share, public transport and multiple occupancy
vehicles).
Develop and enact a settlement strategy that encourages infill development and
Urban densification around public transport routes and active urban centres.
Planning Concentrate housing development in existing urban areas and commence the
development of higher density hubs in outlying areas.
16 | 30-YEAR RACT GREATER HOBART MOBILITY VISION | APRIL 2019Theme Project Years 1-5 Years 6-10 Years 11-20 Years 21-30
Deliver active transport spines in the CBD in each direction, including from the
Active Rivulet Track to Intercity Cycleway, Elizabeth St south and north bound and from
Sandy Bay to CBD.
Transport
Retrofit existing infrastructure to provide connections to active transport spines.
Establish a limited ferry service with up to three routes between the CBD and Eastern
Shore.
Establish scheme to subsidise patronage of public transport.
Remove on-street parking in key locations to facilitate prioritisation measures for
public transport (eg. Main Rd/Elizabeth St, Sandy Bay Rd), as well as separated
cycleways.
Upgrade public transport infrastructure and access to information (eg. bus
shelters, arrival and departure times).
Establish transport hubs at key destinations including Royal Hobart Hospital,
Public Hobart Airport, University of Tasmania.
Transport Extend ferry network to up to eight terminals, each within a kilometre of key
cycleways and footpaths, stretching north and south of the city. Ferries should
also have capacity for bicycles.
Implement a specific northern suburbs transit corridor that concentrates on
a high density route, which could utilise a section of the existing rail corridor,
but then use on-road infrastructure to terminate in the CBD. If the existing rail
corridor is to be used it requires higher residential density to support a mass
transit solution.
Commence operation of an innovative Northern Suburbs public transport option
that concentrates on high-density routes.
Establish priority measures to support ride and car sharing services.
Integrate low/zero emission and autonomous vehicles for public transport with a
particular focus on connecting with other transport options.
Future Increase investment in Intelligent Transport Systems that allow vehicles to
communicate with traffic signals and other infrastructure to facilitate efficient
Mobility
and safe movement.
Establish systems to enable a mobility network where users can access all
transport modes under a single ticketing and payment gateway (ie. ‘mobility as
a service’).
30-YEAR RACT GREATER HOBART MOBILITY VISION | APRIL 2019 | 17GETTING THERE
RACT will stand behind the Greater Hobart Mobility Vision and use it as a
platform to advocate to all tiers of Government, other relevant stakeholders
and achieve community support. The Vision is informed by evidence,
expertise and the community and RACT will be working to ensure the goals
and initiatives contained in the document are fulfilled.
Realising the RACT Greater Hobart Mobility Vision will only be achieved if
approached collaboratively with a full understanding of opportunities and
challenges.
RACT is calling on:
Local government to act in the best interests of the Greater Hobart area
and not exclusively on issues relevant to their respective municipality.
Councils have a great deal of influence over parking, speed treatments,
active transport connections and engaging the community – all of which
can improve city-wide mobility.
The Tasmanian Government to approach the better movement of people in
a way that is evidence-based and removed from the political environment.
The Government is the gatekeeper of many major transport initiatives that
require significant funding and coordination with varied stakeholders.
The Australian Government to further recognise the importance of Hobart
in a national sense and direct funding accordingly. Hobart is internationally
regarded as a hub for arts and culture, food and drink and a gateway to many
World Heritage sites. An enhanced mobility network will help facilitate growth
in these areas.
18 | 30-YEAR RACT GREATER HOBART MOBILITY VISION | APRIL 201930-YEAR RACT GREATER HOBART MOBILITY VISION | APRIL 2019 | 19
OUR RESEARCH
        We reviewed all relevant and current plans, strategies and reports.
        We consulted with the Tasmanian Government, including relevant departments
        and Ministers, the Tasmanian Labor Party, the Tasmanian Greens, Bicycle
        Network Tasmania, Metro Tasmania, all six local government organisations in
        Greater Hobart and Regional Development Australia.

        We received the community’s input through:
        • Two online surveys with more than 2500 responses;
        • More than 70 submissions of ideas; and
        • A public forum that presented five possible scenarios for Greater Hobart.

        We established a panel of experts in:
        • Infrastructure;
        • Future mobility and emerging technologies;
        • Engineering;
        • Urban planning;
        • Active and public transport; and
        • Social and economic studies.
        We used all this data and cross-referenced it with transport data and
        international best practice to develop this all-encompassing Vision.

20 | 30-YEAR RACT GREATER HOBART MOBILITY VISION | APRIL 2019
30-YEAR RACT GREATER HOBART MOBILITY VISION | APRIL 2019 | 21
STAKEHOLDERS AND PARTNERS
        Stakeholders                                                                                Partners
        Tasmanian Government – Department of Premier    Bicycle Network Tasmania                    University of Tasmania
        and Cabinet
                                                        Pedestrian Council of Australia             Bitzios Consulting
        Department of State Growth – State Roads
                                                        TCT Pedestrian and Public Transport Users   MRCagney
        Infrastructure Tasmania                         Group
                                                                                                    RED Sustainability Consultants
        Local Government Association of Tasmania        Hobart Northern Suburbs Railway
                                                                                                    Flinders University
        City of Hobart                                  Tasmania Police
        Glenorchy City Council                          Road Safety Advisory Council
        Clarence City Council                           Regional Development Australia
        Kingborough Council                             Australian Electric Vehicle Association
        Brighton Council                                TasCOSS
        Sorell Council                                  TasRail and TasPorts
        Metro Tasmania                                  Hydro Tasmania and TasNetworks

22 | 30-YEAR RACT GREATER HOBART MOBILITY VISION | APRIL 2019
REFERENCES
• Australian Bureau of Statistics, Census of • Department of Treasury and Finance, 2014
Population and Housing: Understanding the Population Projections: Tasmania and its
Census and Census Data, Australia 2016 Local Government Areas, 2014.
• Australian Bureau of Statistics, Census of • Royal Automobile Club of Tasmania, RACT
Population and Housing: Commuting to Work Greater Hobart Mobility Survey, Hobart, 2018
- More Stories from the Census, Australia
• Royal Automobile Club of Tasmania, RACT
2016
Greater Hobart Travel Behaviour Survey,
• Australian Bureau of Statistics, Population Hobart, 2018
projections Australia 2017 – 2066, 2017
• Transport for NSW, Principles and Guidelines
• Australian Automobile Association, Road for Economic Appraisal of Transport
Congestion in Australia, Canberra, 2018 Investment and Initiatives, 2016
• Bureau of Infrastructure, Transport and • Indicative cost information provided by
Regional Economics, Traffic and congestion pitt&sherry
cost trends for Australian capital cities, 2018.
• Bureau of Infrastructure, Transport and
Regional Economics, Australian Infrastructure
Statistics–Yearbook 2018, 2018.
• Deloitte Access Economics, Greater Hobart
Transport Modelling for RACT, 2019
• Department of Infrastructure, Energy and
This document assumes the projects below
Resources, Greater Hobart Household Travel
will be delivered as per current Tasmanian and
Survey, 2010
Australian Government budget allocations:
• Department of State Growth, Hobart
Bridgewater Bridge, $576m
Congestion and Traffic Analysis, Hobart 2016
Hobart Airport interchange, $30m
• Department of State Growth, Hobart Traffic
Origin-Destination Report, Hobart 2017 Tasman Highway duplications, $5m
30-YEAR RACT GREATER HOBART MOBILITY VISION | APRIL 2019 | 2324 | 30-YEAR RACT GREATER HOBART MOBILITY VISION | APRIL 2019
You can also read